Genetic Algorithm for Optimizing the Routing in the
Wireless Sensor Network
Navdeep Kaur
Department of Electronics and communication Lovely Professional University
Phagwara, India
Deepiika Sharma
Assistant Professor in Department of Electronics and communication
Lovely Professional University Phagwara, India
ABSTRACT
Wireless sensor networks consist of large number of low cost sensor nodes. All the nodes in the network have a limited transmission range and their processing, storage capabilities and energy resources are limited. These sensor nodes collect the data from the particular area and transmit to the base station for the processing of sensed data. To perform routing in wireless sensor network with this limitation of low power, energy and storage capabilities is a major problem. Due to which the lifetime of the network decreases. To solve this problem of reduced lifetime of the network, an efficient algorithm is required to increase the lifetime of the network. In this paper the Genetic algorithm (GA) is purposed to enhance the lifetime of heterogeneous wireless sensor networks. The work is compared with the ETLE (Efficient Three Level Energy) in terms of the lifetime of the network.
Keywords
Wireless sensor networks, heterogeneous networks, Genetic Algorithm.
1.
INTRODUCTION
Wireless sensor network (WSN) consists of large number of devices that use sensors to monitor physical or environmental conditions such as temperature, pressure, motion etc. These devices are known as sensor nodes. Sensor nodes can be in number of hundreds to thousands. These sensor nodes communicate with each other and all the sensor nodes can organize themselves after the deployment in particular sensing area which we want to measure. It means all the sensor nodes have self-organizing capabilities .These sensor nodes combine with routers and a gateways to make the wireless sensor network. Every sensor node in wireless sensor network consists of processing unit consisting one or more microcontrollers, different types of memories, a radio frequency transceiver, a power unit for example batteries, and various numbers of sensors to sense the field.[1] There are two types of wireless sensor network based on the node parameters. One are homogeneous wireless sensor networks and other are heterogeneous wireless sensor networks. There are three common types of resource heterogeneity in sensor node that is computational heterogeneity, link heterogeneity, and energy heterogeneity.The most important heterogeneity is the energy heterogeneity because if there is no energy heterogeneity then the computational heterogeneity and link heterogeneity will, decreasing the network lifetime of the network. The heterogeneous networks increases the lifetime of network and provide the reliable transmission of information.[2]
Fig.1. Wireless sensor network structure
There are many protocols are discovered for the heterogeneous wireless sensor networks such as SEP, EEHC, ETLE etc. SEP is stable election protocol which improves the stable region of the clustering hierarchy process using the characteristic parameters of heterogeneity. Stable Election Protocol (SEP) is among the first an energy efficiency routing protocol that used a heterogeneous network, in the sense that election probabilities are weighted by the initial energy of the node relative to that of other nodes in the network. It is two-level heterogeneous WSNs, which is composed of two types of nodes accordingly to the initial energy. First nodes called as normal nodes and seconds nodes known as advanced nodes with more energy at the beginning. SEP may extend the lifetime of the network, but it cannot apply to multilevel heterogeneous WSNs. This contains the fraction of advanced nodes (m) and the additional energy factor between advanced and normal nodes (α). In order to prolong the stable region, SEP attempts to maintain the constraint of well-balanced energy consumption. Advanced nodes have to become cluster heads more often than the normal nodes, which is equivalent to a fairness constraint on energy consumption.[3].
33 presence of heterogeneous nodes.. In the model, it will assume
m is the fraction of the total number of nodes n, mo is the percentage of the total number of nodes m, which is equipped, with β times more energy resources than the normal node, which called as super nodes. The rest (1-mo)*m*n nodes are equipped with α time more energy than the normal nodes known as advance node and remained n*(1-m) as normal nodes. EEHC may extend the network lifetime and suitable for multilevel heterogeneous wireless sensor networks as compared to the LEACH protocol. EEHC has extended the lifetime of the network by 10% as compared with LEACH. [2]
ETLE is the Efficient Three Level Energy algorithm. All the sensor nodes in the network were randomly distributed and not mobile. Node clustering algorithm is use to form a cluster based network in the WSNs. ETLE algorithm for WSNs has a periodic round; each round is divided into four different phases known as information revise, cluster head selection, cluster creation and data communication. Each sensor node selects itself as a cluster head independently and by considering remaining energy for each node in each round .Some nodes are added with some percentage of energy, in order to form the energy heterogeneity in the network. In this m symbol is used to present the percentage of nodes and α as times more energy of nodes. Normally, in cluster-based network, some nodes will be selected as the cluster head. The cluster head will aggregate the sensing data of their cluster members and transmit to the sink node. It uses a single-hop data transmission to the sink node.Each sensor node selects itself as a cluster head independently and by considering remaining energy for each node in each round. In the ETLE the first node die more lately as compared to EEHC. This make the lifetime of the network is large as compared to EEHC. [5]
2.
DESCRIPTION OF THE GENETIC
ALGORITHM
Genetic algorithms encode the solutions as the chromosomes. This encoding of solutions is known as representation. In the working Genetic algorithm there is not one chromosome, there exists the set of chromosomes that is called population. The fitness value is also required in the Genetic algorithm in order to determine the quality of each solution. A Genetic Algorithm performs fitness test on the different solutions to select the one best solution. The better is the fitness value more will be the chance of survival.[5]
Population: The Genetic algorithm starts with population. The population consists of the number of chromosomes. These chromosomes represent the solution to particular problem. The chromosomes are represented as the sequence of zeros and ones. Initially the population is randomly generated. There are two methods to produce the new population one is the steady state Genetic algorithm and another is generational Genetic algorithm. The Steady state Genetic algorithm replaces the one or two chromosomes of the population. It means the new generation can contain some of previous members. The generational Genetic algorithm replaces all the members i.e. chromosomes of the population. In this new generation will not contain the previous members.
Fitness value: The fitness value is defined as the ability to survive and reproduce again. In the Genetic algorithm fitness value is defined by a function that is defining the particular problem. The more is the fitness value more are the chances of survival.
Selection : The selection process in the Genetic algorithm is used to select the chromosomes from the population. These chromosomes perform the crossover to create new chromosomes. Then the new made chromosomes will exists in the population. This new made population become the base of the next selection process. The chromosomes with highest fitness values have better chances of selection. There are three types of selection methods such as: Roulette-Wheel selection, Tournament selection and Rank selection.. In Tournament selection, two chromosomes are chosen randomly from the population. The one chromosome that has better fitness value will be selected among two chromosomes.
Crossover: Crossover is defined as the recombination of chromosomes. It is same as the reproductive process. The result of crossover depends on the selection of chromosomes which is made from the population. There are different types of crossover operators exist. The simplest operator is the single-point crossover where point is chosen at randomly and after that point the two parent chromosomes transfers the information.
Mutation: Due to crossover the new generation is introduced. This causes problem where no new genetic material is introduced in the offspring. Mutation allows new genetic patterns to be introduced in the new chromosomes. Mutation process provides a new sequence of genes into a chromosome. There is no guarantee that mutation process will provide the desirable features in the new chromosome.
Population Generation: A population consists of large number of chromosomes. Among all these chromosomes the best chromosome is used to generate the next population. Initially the population is randomly generated. There are two methods to produce the new population one is the steady state Genetic algorithm and another is generational Genetic algorithm.[5][6]
3.
PROPOSED MODEL
There are large numbers of protocols and algorithms that are proposed for wireless ad hoc networks. The sensor nodes are limited in power, computational capacities, and memory. To perform routing in wireless sensor network with this limitation of low power, energy and storage capabilities is a major problem. Due to which the lifetime of the network decreases. In order to solve this problem Genetic algorithm is purposed for the routing to enhance the lifetime of network.
3.1. Description of purposed algorithm
3.1.1 Deployment of sensor nodes
The three types of sensor nodes are deployed because of the heterogeneous wireless sensor network. The nodes are common energy nodes, more energy nodes and most energy nodes. These nodes are deployed in the 100m×100m area. The sink node is placed at the center location (50, 50).
3.1.2. Cluster formation
After the deployment of sensor nodes the clusters are formed. There are different methods for the cluster formation. In purposed algorithm clusters are formed by using K gridding method. The value of K is 3 in the purposed algorithm.
3.1.3. Cluster head election
value is defined by a function that is defining the particular problem. The function is called nutrient function. The nutrient function is an equation that is derived by analyzing the problem but the mathematical solution of such equation is not possible. One the bases of this the cluster head is elected in order to improve the network lifetime.
3.1.4. Data transmission
After the cluster head selection, all the nodes in the clusters transmit their data to their respective cluster heads. The cluster heads further transmit the data to the sink node.
3.2. Energy model
Let there is k bit of data which is to be transmitted. The amount of energy consumed during sending k bit of data to a distance d is calculated by using the equations that are given below. The below equation is called the free space model and this equation is used only when the value of d will be such as:
The below equation is known as the multipath fading model and this equation is used when the value of d is such that
The energy consumption during transmission is represented as
The energy for the transmission of the data is represented as:
The amount of energy for the amplification is represented as:
The amount of energy consumed during the reception of k bit of data is calculated from the equation given above. The energy consumed during the reception is represented such as:
3.3. Network model
The network is formed by three-level energy because the network is heterogeneous network. The network consists of three types of nodes: common energy nodes, more energy nodes and most energy nodes.
Let n is the total number of nodes. The most energy nodes are those which have α more times energy. The most energy nodes are in the fraction of m2 percent of n nodes.
The more energy nodes are those which have α/2 more times energy. The mort energy nodes are in the fraction of m1 percent of n nodes.
The common energy node has the initial energy Ec. These nodes are in the fraction of (1-(m2+ m1)) percent of n nodes.
The total energy of the nodes is given below:
Total Energy = common energy nodes + more energy nodes+ most energy nodes.
The energy of common nodes is represented as Ec,
The energy of more nodes is represented by Em2
The energy of most nodes is represented by Em1
4.
SIMULATION RESULTS
This section contains many simulations that are used to analyze and evaluate the performance of the proposed algorithm. This paper uses the MATLAB for the simulation and for results. After that to verify the proposed algorithm we will compare the results with ETLE (Efficient Three Level Energy).
4.1. Simulation setup
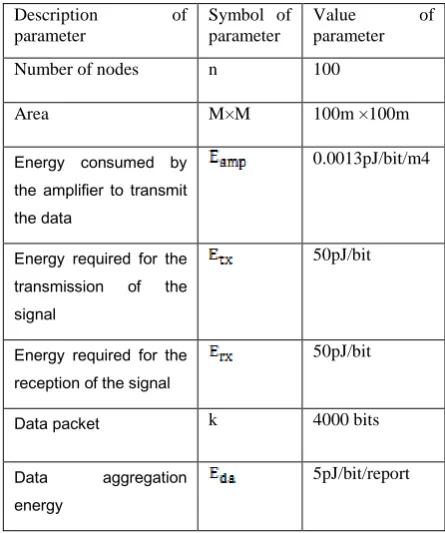
[image:3.595.314.537.316.583.2]The numbers of nodes simulated in the wireless sensor network are 100. All the nodes are deployed randomly in the sensing field of 100m ×100m area. There are three different types of nodes. The nodes are common energy nodes, more energy nodes and most energy nodes Every node transmits the k bit of data to the cluster head in a round. The simulation parameters that are used in the purposed algorithm are given in the Table I.
Table 1. Simulation parameters values
Description of parameter
Symbol of parameter
Value of
parameter
Number of nodes n 100
Area M×M 100m ×100m
Energy consumed by the amplifier to transmit the data
0.0013pJ/bit/m4
Energy required for the transmission of the signal
50pJ/bit
Energy required for the reception of the signal
50pJ/bit
Data packet k 4000 bits
Data aggregation
energy
5pJ/bit/report
4.2. Simulations and analysis
35
[image:4.595.326.514.124.297.2]Fig.2 Snapshot of sensor node’s deployment
Fig. 2 Deployment of sensor nodes
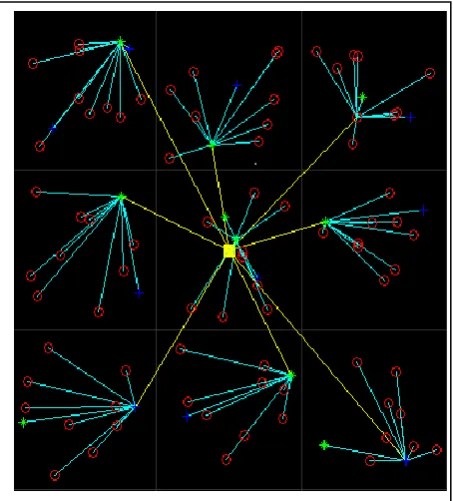
The following figure shows the cluster formation and the transmission of data between the nodes.
[image:4.595.326.548.393.593.2]
Fig. 3 Snapshot of cluster formation and transmission
Fig. 3 cluster formation
The following fig shows the network lifetime comparison between purposed algorithm and ETLE algorithm. The fig. 4 shows that the purposed algorithm is better than the ETLE
algorithm because in the purposed algorithm the first node dies later as compared to ETLE algorithm. So this make the lifetime of network short in ETLE algorithm and the purposed algorithm enhance the lifetime of network.
Fig. 4 The number of dead nodes in each round
A comparison for the first node die is shown in Table 2.The purposed algorithm and ETLE algorithm is compared in terms of lifetime of the network. The comparison is done on the basis of three different types of initial energies.
Table 2. First node dies comparison
The above table shows that the first node dies later in purposed algorithm on 1294th round while in the ETLE algorithm the first node dies on 1256th round. It means the first node dies in purposed algorithm 38 round later. So it increases the lifetime of network as compared to ETLE algorithm.
5. CONCLUSION
There are many protocols are discovered for the heterogeneous wireless sensor networks such as SEP, EEHC, ETLE etc. In this paper we proposed an algorithm to extend the lifetime of the network. The nodes are deployed randomly and cluster head us elected by the Genetic Algorithm on the basis of fitness value. It is shown that the first node dies later in the proposed algorithm as compare to ETLE (Efficient
Algorithm Initial energy in joules
Round at which first node dies
ETLE 0.5 609
Purposed algorithm
0.5 647
ETLE 0.25 1256
Purposed algorithm
0.25 1294
ETLE 1 2484
Purposed algorithm
[image:4.595.44.271.440.691.2]Three Level Energy). Thus increase the lifetime of the heterogeneous wireless sensor networks by 3% as compared to ETLE (Efficient Three Level Energy).
5.
REFERENCES
[1] Smriti Joshi & Anant Kr. Jaywalk “Energy-Efficient MAC Protocol for Wireless Sensor Networks - A Review” International Journal of Smart Sensors and Ad Hoc Networks (IJSSAN) ISSN No. 2248‐9738 Volume‐1, Issue‐4, 2012.
[2] D.kumar, T.C.Aseri and R.B.Patel “EEHC: Energy efficient hetergenous clustered scheme for wireless sensor networks”Computer Communications 32(2009), pp.662-667
[3] G. Smaragdakis, I.Matta and A.Bestavros, “SEP: A Stable Election Protocol for Clustered Heterogeneous Wireless Sensor Networks” Proceeding of 2nd International Workshop on Sensor and Actor Network Protocol and Applications (SANPA), Boston, U.S.A., 2004, pp.1-11.
[4] N.Tuah,M.Ismail,K. Jumari “Energy Efficient Algorithm for Heterogeneous Wireless Sensor Network”International Conference on Control System, Computing and Engineering © 2011 IEEE.
[5] Chien-Chih Liao and Chuan-Kang Ting “Extending the Lifetime of Dynamic Wireless Sensor Networks by Genetic Algorithm” WCCI 2012 IEEE World Congress on Computational Intelligence June, 10-15, 2012 - Brisbane, Australia
[6] Sajid Hussain, Abdul Wasey Matin, Obidul Islam “Genetic Algorithm for Hierarchical Wireless Sensor Networks” journal of networks, vol. 2, no. 5, september 2007.