http://dx.doi.org/10.4236/jbcpr.2014.22013
Study of the Porosity of the Tiles out of
Vibrated Mortar by Microstructural Analysis
Chakirou Akanho Toukourou
1, Gontrand Comlan Bagan
1, Adolphe D. Tchehouali
1,
Alain Vautrin
21Laboratoire d’Energétique et de Mécanique Appliquée (LEMA/EPAC), Cotonou, Bénin 2Département Mécanique et Matériaux (M&M/ENS-ME),St-Etienne, France
Email: [email protected], [email protected]
Received 5 April 2014; revised 13 May 2014; accepted 25 May 2014
Copyright © 2014 by authors and Scientific Research Publishing Inc.
This work is licensed under the Creative Commons Attribution International License (CC BY).
http://creativecommons.org/licenses/by/4.0/
Abstract
The promotion and the popularization of the micro concrete tiles in any locality obligation with a will of durable development pass by a standard of quality, which is based on the results of scien-tific and technical research taking account of local specificities. This work proposes to study the porosity of the micro concrete by micro structural analysis. From this study, it comes out that the variation of porosity compared to the ratio of the fine gravels (s/(s + g)) is decreasing. Indeed more the granular ratio increases less low is the density of pores of material. The decrease of po-rosity according to the granular rate is not infinite; it tends towards a minimum starting from a rate of fine gravel close to 50%. The results obtained justify well the ratio of fine gravel practised by tileries.
Keywords
Micro Concrete Tile, Porosity, Micro Structural Analysis, G Volume of Fine Gravel, S Volume of Sand
1. Introduction
Since about fifteen years, several projects of durable development are directed in the promotion and the popula-rization of the techniques and technologies of manufacture of the local materials, of which tiles. These last, in-troduced into many countries of Africa, Asia and America by the ILO, are supported by various projects of dur-able development.
po-rosity according to granulometry will make it possible to deduce the granular formulation to recommend [4]. Thus this work aims to define starting from a study of the microstructure of the micro concrete the ratios of sea sand and fine gravel making it possible to obtain less porous materials for the insurance of tiles of quality.
2. Material and Method
2.1. The Test-Tubes
The micro concrete can be defined as being a concrete, whose diameter of the aggregates entering its composi-tion do not exceed 10 mm [3] [5]. Indeed the maximum diameter of these aggregates is a funccomposi-tion thickness of the tile. In case of need where the tiles have a 8 mm thickness, this dimension is 5.5 mm [1]. In addition to the aggregates, the micro concrete is composed of cement and water. The ratio cement/ aggregates/water used for the manufacturing of the test-tubes is 1/1/0.5 in volume. The aggregates, of which hygrometry is 75%, and sand equivalent is 95%, the density and the bulk density are respectively 2.55 and 1620 kg/m3 , result from two dis-tinct sands of siliceous origin. One, of granular size varying between 0.08 and 2 mm is called fine sand or quite simply sand and is indicated by (s); the other of granular size ranging between 0.08 and 5.5 mm is called coarse sand or fine gravel and is indicated by (g). The distribution of the grains is illustrated by the grading curves of
Figure 1.
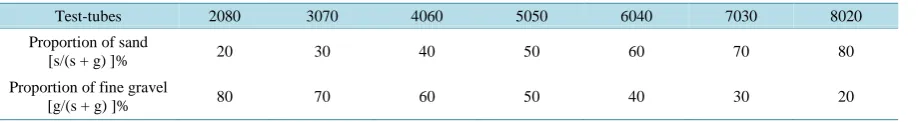
The test-tubes are different primarily by their granular composition gathered in Table 1. The test-tube 2080 consists of 20% of sand and 80% of fine gravel; the 3070 consists of 30% of sand and 70% of fine gravel; the 4060 consists of 40% of sand and 60% of fine gravel; the 5050 consists of 50% of sand and 50% of fine gravel; the 6040 consists of 60% of sand and 40% of fine gravel; the 7030 consists of 70% of sand and 30% of gravel; the 8020 consists of 80% of sand and 20% of fine gravel.
First, confirm that you have the correct template for your paper size. This template has been tailored for out-put on the custom paper size (21 cm × 28.5 cm).
2.2. Preparation of the Samples
The micro concrete samples were cut out starting from the test-tubes, coated and then polished thanks to a pro-vided polishing machine discs. On the discs grains of diamonds of gauges were fixed varying from 400 to 0.4 microns.
2.3. Methods of Characterization of the Micro Concrete
The quantitative analysis is the method essential which makes it possible to describe a microstructure by a series of geometrical parameters, to control or validate a model, to compare and study the behaviors of a structure un-der various experimental conditions [6].
The quantitative analysis of images relates to the morphological study of the structures as well as the quanti-fication of this morphology with measurement of parameters. On the images to be analyzed, the objects to be identified were treated to then be able to select them and define measurable sizes making it possible to know their content, their size, their form [6]. The characterization was made by the method of analyses of image thanks to the optical microscope or the magnifying glass binocular, provided one or the other with a device of acquisition and image processing, the whole controlled by a computer. The device of acquisition and image processing is illustrated on Figure 2 and Figure 3.
Various types of analysis were carried out [7]:
• the total analysis relates to the structure as a whole, such as for example the evolution of the various compo-nents;
• the individual analysis on the contrary is carried out particle by particle, for example the determination of the form or of the size of a component. This analysis, in opposition to the total analysis, does not relate on an image which represents the whole of the structure, but to a fraction of this unit. In this case the window of analysis restricts the study with part of the sample, and thus account should be held to this parameter and to utilize statistical methods to extend the results to the whole of the structure. Indeed the probability for an element of being completely included in the window depends on its size. During this study of the micro con-crete, the principle of total analysis is adopted, after a preliminary comparative study.
0 0,81 11 66,65 99,89 100
0,1 0,62 3,52 9,1 22,97 66
0,1 1 7 39 61 85
0 20 40 60 80 100 120
20 23 26 29 32 35 38 41 44
F
ilt
er
ed
in %
c
um
ul
at
ed
Module of sieves
Sand
Coarse
Figure 1. Distribution of the aggregates.
Figure 2. The device of image acquisition.
Table 1. Granular composition of the test-tubes.
Test-tubes 2080 3070 4060 5050 6040 7030 8020
Proportion of sand
[s/(s + g) ]% 20 30 40 50 60 70 80
Proportion of fine gravel
[g/(s + g) ]% 80 70 60 50 40 30 20
on the screen of the analyzer. It breaks up into four essential stages:
• frame grabbing,
• selection of the zones of interest,
• image processing and measurements,
• the interpretation of the results.
The first stage of any analysis is the development and the frame grabbing. This one is carried out by means of a system of entry chosen according to the sample to analyze, of the studied parameters and the medium.
The software of analysis is connected to an optical microscope with reflexion or a binocular magnifying glass associated with a camera. The camera provides an analogical signal corresponding to the image of the object observed which is transmitted to the software of analysis like to the control screen. This system of entry makes it possible to acquire, store, and to restore the image of the object. This image is a two-dimensional representation of the object at one moment given with a precise enlargement. The recorded image is defined by a whole of points images (often 512 × 512) called pixels and with each one is associated a value representative of the level with gray of the image in this point. There are 256 levels of gray which vary between the value 0 corresponding with the black and value 255 with the white [7].
If contrast would not allow an acquisition which makes it possible to distinguish the different part from the image, one proceeds initially by an impression, thanks to the camera fixed on the binocular magnifying glass. It is the copy of the printed image which makes it possible to carry out acquisition through the medium of an overhead projector (Figure 3).
Three samples are used for each test.
3. Results and Discussion
The pores appear black with a random distribution of size (Figure 4). Let us note that each sample carries same designation that the test-tube from which it is cut out.
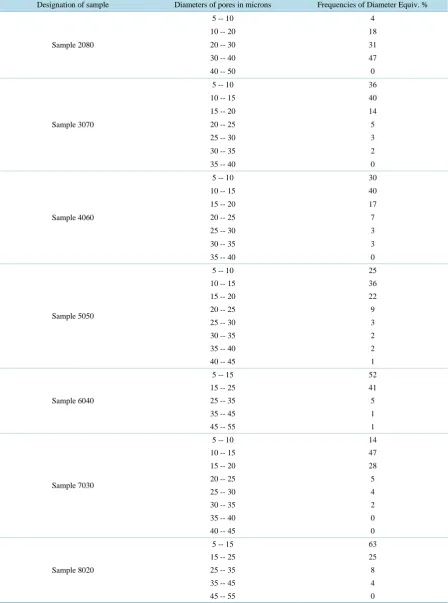
The results obtained after acquisition and image processing are represented in Table 2 they are graphically il-lustrated by the curves of Figure 5. These curves represent the distribution of the pores according to the equiva-lent diameter.
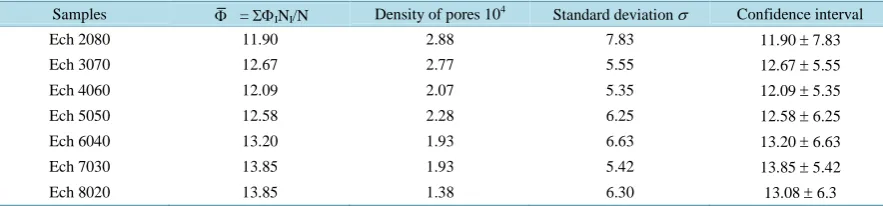
It is noted that the populations of pores of size ranging between 5 and 50 microns have a distribution qua-si-normal. Table 3 gives their parameters characteristic with a threshold of 68.27% and one confidence coeffi-cient equal to 1 [8].
Through this table, it is important to realize that average diameter of samples increases when density of pores decreases with the proportion of fine gravel. This fact permits to suppose that vibration made in samples fabrica-tion influences internal strength against micro concrete pastes viscosity, stressing fine gravels, which moves and divides the diameter of pores. So more proportions of fine gravel create more divided diameter and more density of pores.
The analysis of the density of pores compared to the rate (s/(s+g)) of fine gravel contained in the micro con-crete according to the curve of Figure 6.
This curve indicates that the number of pores of diameters ranging between 5 and 50 microns tends towards a constant value from 50%. The pores are responsible for micro concrete’s water suction. More pores result in permeability of this tile material. So minimizing the number of pores gives the warranty of non-permeability tile.
4. Conclusion
Figure 4. Morphology of the micro concrete.
Distribution of the pores according to equivalent diameter between 5 and 50 microns
0 10 20 30 40 50 60 70 80
5 15 25 35 45 55
Diameters (microns)
Fr
e
que
nc
ies
(%
)
2080 3070 4060 5050 6040 7030
8020
Figure 5. Distribution curves of the pores.
Figure 6. Variation of the density compared to the coarse sand rates.
work in which swarm a multitude with variable pores of dimensions.
Table 2. Distribution of the pores by sample.
Designation of sample Diameters of pores in microns Frequencies of Diameter Equiv. %
Sample 2080
5 -- 10 4
10 -- 20 18
20 -- 30 31
30 -- 40 47
40 -- 50 0
Sample 3070
5 -- 10 36
10 -- 15 40
15 -- 20 14
20 -- 25 5
25 -- 30 3
30 -- 35 2
35 -- 40 0
Sample 4060
5 -- 10 30
10 -- 15 40
15 -- 20 17
20 -- 25 7
25 -- 30 3
30 -- 35 3
35 -- 40 0
Sample 5050
5 -- 10 25
10 -- 15 36
15 -- 20 22
20 -- 25 9
25 -- 30 3
30 -- 35 2
35 -- 40 2
40 -- 45 1
Sample 6040
5 -- 15 52
15 -- 25 41
25 -- 35 5
35 -- 45 1
45 -- 55 1
Sample 7030
5 -- 10 14
10 -- 15 47
15 -- 20 28
20 -- 25 5
25 -- 30 4
30 -- 35 2
35 -- 40 0
40 -- 45 0
Sample 8020
5 -- 15 63
15 -- 25 25
25 -- 35 8
35 -- 45 4
Table 3. Parameters of distribution of the pores.
Samples Φ = ΣΦINI/N Density of pores 104 Standard deviation σ Confidence interval
Ech 2080 11.90 2.88 7.83 11.90 ± 7.83
Ech 3070 12.67 2.77 5.55 12.67 ± 5.55
Ech 4060 12.09 2.07 5.35 12.09 ± 5.35
Ech 5050 12.58 2.28 6.25 12.58 ± 6.25
Ech 6040 13.20 1.93 6.63 13.20 ± 6.63
Ech 7030 13.85 1.93 5.42 13.85 ± 5.42
Ech 8020 13.85 1.38 6.30 13.08 ± 6.3
In the same way the results of this work show as this decreasing tends towards a limit from 50% of fine gra-vels. This is in perfect agreement with investigation of micro concrete structure through water absorption [9], and with the rate of 2/3 used in tileries.
Acknowledgements
This research was carried out with the financial support of the POTEMAT/BENIN. Thanks are due to Dr. Eme-ruwa Edjikeme for his useful suggestions and fruitful discussions and Dr. SANDE Oladélé for technical support on experimental tests on concretes.
References
[1] SKAT, BIT (1992) Manuel de production, Tuiles en fibro et vibro-mortier. outil 22, Genève, 15, 33.
[2] Baron, J. and Sauterey, R. (1980) Le béton hydraulique, connaissance et pratique. Presses de l’école nationale des ponts et chaussées, Vincennes, 2-1, 2-15, 12-33, 12-36.
[3] Lemaitre, J. and Chaboche, J.-L. (1985) Mécanique des matériaux solides. Dunod, Paris.
[4] Lowel, S., Joan, E. and Schields, E. (1984) Powder Surface Area and Porosity. Deuxième Édition, Powder Technology Serie, London, 55, 86.
[5] Jouenne, C.A. (1984) Traité de céramique et matériaux minéraux. Edition Septima, A 2011-1, 2011-17, Paris.
[6] Zanutto, S. (1999) Caractérisation physique de la microstructure de composite ciment-verre. Rapport de stage IUT de St-Etienne France.
[7] Spiegel, M.R. (1972) Théorie et applications de la statistique. Série Schaum, New York, 122, 123, 156, 164.
[8] Document Normatif (1997) Tuiles en mortier vibré. Burkina Faso, 15, 25, 35, 44.
range of academic disciplines. SCIRP serves the worldwide academic communities and contributes to the progress and application of science with its publication.