Koichiro Sasaki, Akihiko Ito, Hiroyuki Torikai
Department of Intelligent Machines and System Engineering, Hirosaki University, Hirosaki, Japan
Received 16 November 2015; accepted 14 December 2015; published 17 December 2015
Copyright © 2015 by authors and Scientific Research Publishing Inc.
This work is licensed under the Creative Commons Attribution International License (CC BY). http://creativecommons.org/licenses/by/4.0/
Abstract
In this study, we investigate the flame spread characteristics of binary mixed liquid fuels that are both in super-flash condition. We propose a method for estimating flashpoint and flame spread rate for binary mixed liquid fuels from binary vapor concentration distribution and compare these estimated values with experimental results. In addition, we measure the flame height and center of the flame leading edge for binary mixed liquid fuels. The results show that, when the flashpoint of each single fuel is known, the flashpoint of the binary mixed liquid fuel can be calcu-lated. Moreover, the fuel that most influence combustion changes near the intersection of vapor concentration distribution in accordance with Raoult’s law. Photographs of the flame indicate discontinuity. We can calculate flame spread rate by using the ratio of each diffusion coefficient to judge equivalently. Finally, it is found that the flame height and center of flame leading edge are proportional to total vapor concentration of the binary mixed liquid fuels.
Keywords
Flame Spread, Binary Mixed Liquid Fuels, Raoult’s Law, Flashpoint, Super-Flash Condition
1. Introduction
The flame spread characteristics of mixed liquid fuel depend on the distribution of vapor concentration by each liquid component that is formed. However, the relationship between vapor concentration distribution and flame spread rate is not clear. The purpose of this study is to reveal the relationship between vapor concentration distribution of mixed liquid fuel and flame spread rate. In this study, we try ethanol-methanol combinations which are both in super-flash condition. We measure distribution of vapor concentration and flame spread rate of binary mixed liquid fuels under these conditions and consider the relationship.
2. Estimation of Flashpoint and Flame Spread Rate for Binary Mixed Liquid Fuels
2.1. Flashpoint of Binary Mixed Liquid FuelsTo derive the flashpoint of binary mixed liquid fuels, we measured the vapor concentration of binary mixed liq-uid fuels in accordance with Raoult’s law [14]. The flashpoint of binary mixed liquid fuels depends on the composition of each liquid composition. So it is very hard to measure the flashpoint for all liquid compositions. With this background, we examined prediction methods of the flashpoint of binary mixed liquid fuels using the flashpoint of simple ingredients and Raoult’s law. In this study, we used vapor concentration at 1mm from the liquid surface and regarded it as a quasi-steady condition. At first, we measured the flashpoint of each simple ingredient and defined A which has lower flashpoint and B which has higher flashpoint. And each flash point is determined as TA TB. Secondly, we calculated vapor concentration of each ingredient of the binary mixed liquid fuels. To keep the lower limit of the different flammable materials constant, we used a correction value. We multiplied the correction value F by the vapor concentration of fuel BCB and summed up FCB and vapor con-centration of fuel A. The sum is cm. The equations are below:
A B
F=c c (1)
m A B
c =c +FC (2)
At each liquid phase composition, if the vapor concentration is higher than the flammable material’s lower limit cm, the temperature at this time is defined as the flashpoint.
2.2. Flame Spread Rate of Binary Mixed Liquid Fuels
The flame spread rate of binary mixed liquid fuels depends on the fuel vapor concentration which is generated by each liquid composition. Therefore, we tried to calculate by converting total vapor concentration into single component fuel. Equation (2) indicates the concentration conversion equation
t t
C′ = ⋅X C (3)
t
C′ is vapor concentration after conversion. Ct is vapor concentration before conversion. The basic
charac-teristics of mixed fuels under super-flash conditions are pre-mixed flame and burning velocity. To judge the va-por concentration of binary mixed liquid fuels by the burning velocity equivalently, we used the conversion value X for single component fuel and composition of maximum burning velocity with an equivalent ratio of 1. We calculated the maximum burning velocity of methanol as 55 cm/s [15] and ethanol as 47 cm/s [16].
Secondly, flame spread over mixed liquid fuels when both of them are in super-flash condition depends on total fuel vapor concentration. Therefore, we used Equation (3) to calculate flame spread rate over binary mixed liquid fuels
a t i
V =c V (4)
a
V is the flame spread rate of mixed fuels when both of them are in super-flash condition. Vi is defined as
flame spread rate per 1 vol% by flame spread rate of the single component fuel divided by vapor concentration. If liquid temperature is determined, vapor concentration is also determined and if vapor concentration distribu-tion is determined, flame spread rate is also determined. ct is the total vapor concentration of mixed fuels in
each liquid fuel composition.
3. Experimental Apparatus and Methods
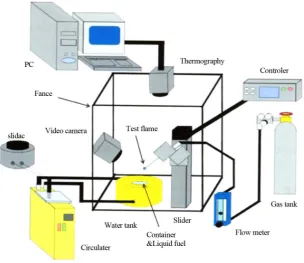
3.1. Measurement of Flashpoint of Binary Mixed Liquid Fuels
Figure 1. Experimental apparatus for measurement of flashpoint.
according to [JISK2256]. We poured the fuel 10 mm from edge of the fuel container to the fuel surface. When the test flame approached the fuel, the distance from the top of the test flame nozzle at the lowest to the fuel surface was 9.3 mm. The fuel container was kept cool by cooling circulation water from a circulator to keep the fuel container temperature less than 10˚C from the predicted flashpoint. When the fuel container temperature neared the flashpoint, we opened the cover and move the apparatus up and down. After that, we judged ignition by observation. We raised the liquid temperature 1˚C/1 min and measured for 30 s. Finally, we performed the experiment five times for each condition and we used methanol and ethanol. The flashpoint of methanol is 15.6˚C and ethanol is 18˚C in an open cup [17].
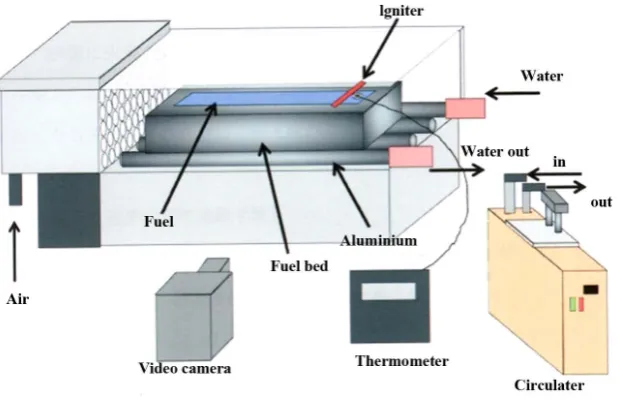
3.2. Measurement of Flame Spread Rate over Binary Mixed Liquid Fuels
Figure 2 shows the experimental apparatus to measure flame spread rate over binary mixed liquid fuels. The fuel container is made of aluminum and the size is 20 mm wide 250 mm long and 3 mm thickness. We per-formed the experiment in a wind tunnel with a counter current of 0.1 m/s. The cross-sectional size was 70 mm × 70 mm and the length was 300 mm. To keep the initial fuel temperature constant, we set aluminum piping under the fuel container with diameter 10 mm × length 270 mm and circulated water. We used nichrome wire to ignite and filmed by video camera (CASIO EX-F1). To measure liquid temperature, we used a thermocouple which was attached on the edge of the fuel container. We performed the experiment five times and the initial liquid temperatures were 18˚C, 20˚C, 24˚C and 28˚C. The fuels were ethanol and methanol the same as the flashpoint measurement—both of them were in super-flash condition.
3.3. Measurement of Flame Shape on Binary Mixed Liquid Fuels
Figure 2. Experimental apparatus for measurement of flame spread rate.
phase composition by investigating the theoretical mixture ratio. Figure 3 shows the measurement method of flame center. We measured the maximum height of flame curvature from the liquid surface on the photographs which we filmed to measure flame spread rate. We indicated the relationship between measured flame height and vapor concentration distribution. Vapor concentration distribution is calculated by Equation (4) [14] and (5)
(
)
*
1 erferf 4
i s
c c = − y Dt (5)
*
i s
c =αkc (6)
where k is the infrared absorption coefficient [14]. cs is saturated vapor concentration calculated by the literature [18] [19]. D is the diffusion coefficient which depends on temperature and pressure. D can be calculated by equ-ation (6) [20] and using the temperature in the laboratory T0 and pressure P
(
) (
2)
0 0 273 0
D=D T P P (7)
where D0 is the diffusion coefficient at 0˚C 1 atm (standard conditions) and methanol is 0.135 cm2/s, ethanol is
0.1020 cm2/s [21]. P0 is atmospheric pressure.
3.4. Measurement of Flame Height on Binary Mixed Liquid Fuels
We measured flame height and flame center at the same time. Figure 4 shows the measurement method for flame height. We investigated how the flame shape changes at each liquid phase composition. In the photo-graphs, we defined the maximum height of blue flame by eyesight from the liquid surface as flame height. We indicated the relationship between flame height and vapor concentration distribution calculated by Equation (5) and Equation (6).
4. Experimental Results and Examination
4.1. Appearance of Flame Spread on Binary Mixed Liquid Fuels
Figure 5 shows the appearance of flame spread on methanol/ethanol mixed fuels at 20˚C. The appearances are different due to the component of binary mixed liquid fuels. Based on these photographs, we considered the re-lationship between vapor concentration distribution and flashpoint and flame spread rate.
4.2. The Relationship between Flashpoint and Liquid Fuel Composition
Figure 3. Measurement of flame center.
[image:5.595.193.433.434.606.2]Figure 4. Measurement of flame height.
Figure 5. Photographs of flame (T = 20˚C).
sition of ethanol increases, the less the flashpoint decreases. This is because the vapor of methanol increases near the liquid surface and it reaches the lower limit concentration. Figure 7 shows a comparison of experimental results and estimated results using Equation (1) and Equation (2).
This is the better method to predict flashpoint because the estimated result and experimental result match well.
Figure 6. Flashpoint of binary liquid fuels.
Figure 7. Comparison of experimental result and estimated value of flashpoint.
flashpoint. The reason why we couldn’t measure flashpoint under 60 - 90 methanol composition, is because the gap between flashpoint and burning point is small in the case where methanol liquid composition increases.
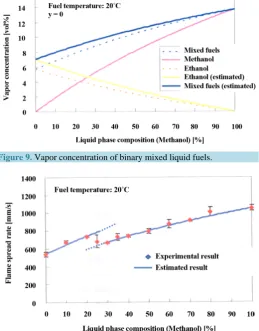
Figure 8. Flame spread rate on binary mixed liquid fuels.
Figure 9. Vapor concentration of binary mixed liquid fuels.
Figure 10. Estimation of flame spread rate on binary mixed liquid fuels.
[image:7.595.184.444.299.631.2]Figure 11. Comparison of experimental results and estimated values.
that flammable vapor on the liquid surface reaches the theoretical mixture ratio. But by the influence of the rise of liquid fuel, a gap is generated between experimental value and estimated value. So we need to consider equivalent concentration. As for flame spread over binary mixed liquid fuel, the predominating liquid fuel changes at the cross section of vapor concentration distribution in accordance with Raoult’s law. To calculate flame spread rate over binary mixed liquid fuels by vapor concentration, one liquid fuel must be converted to the other’ by Equation (2). The calculation equation is indicated below:
t b a
c =c +c X (8)
i b b
V =V c (9)
where Va is flame spread rate over binary mixed liquid fuels, Vi is flame spread rate per 1 vol% of
predomi-nated liquid fuel and ct is total vapor concentration at each liquid phase composition. We defined the
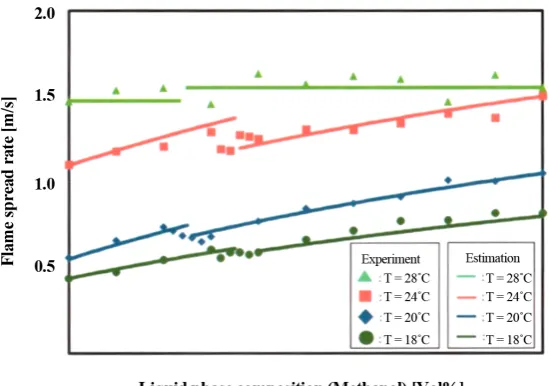
extin-guish distance as 1 mm from the liquid surface. Raoult’s law is adopted on the liquid surface, but actually a fuel vapor distribution exists. So we considered this. Vapor concentration distribution depends on the kinds of liquid fuel. So we used a conversion coefficient X which is the ratio of diffusion coefficient. Thus to calculate flame spread rate over binary liquid fuels, we use Equation (9). If the value at extinguish distance 1 mm reaches the theoretical mixture ratio of each fuel, the flame spread rate is constant. From the experiment of measurement of vapor concentration and flame shape, if the liquid phase composition of methanol is 0% - 25%, we regarded the predominating liquid fuel to be ethanol. If the liquid phase composition of methanol is 26% - 100%, we re-garded the predominating liquid fuel to be methanol. From Figure 9 and Figure 10, the experimental results and estimated results match well. In the case that liquid temperature is 28˚C, the flame spread rate is constant be-cause ethanol and methanol reach the theoretical mixture ratio. We changed the predominating liquid fuel to 20% because the cross section of Raoult’s law is near 20%. However we found the result that the cross section didn’t change, but the discontinuity point was displaced.
4.4. Flame Center and Vapor Concentration on Binary Mixed Liquid Fuels
Figure 12. Flame center on binary mixed liquid fuels.
Figure 13. Flame height on binary mixed liquid fuels.
4.5. Flame Height and Vapor Concentration on Binary Mixed Liquid Fuels
To calculate the flashpoint of binary mixed liquid fuels, if the flashpoint of a single liquid fuel is known, we can calculate one liquid fuel’s flammable lower limit by re-compensating the other using Raoult’s law and a correc-tion value. Figure 13 shows the relationship between flame height of vapor concentration distribution and each liquid phase composition at each liquid temperature. Flame height and vapor concentration rise proportionally to the rise of methanol composition in the same way as the flame center. Thus the lean limit of binary mixed liquid fuels also expands by increasing ethanol composition. But the judgement of flame height is by eyesight and the blue flame height changes at each place. So we need to consider more precise method.
5. Conclusions
We aim to establish a prediction method by using the mixed liquid fuels methanol and ethanol in super-flash condition and Raoult’s law to calculate vapor concentration distribution. The conclusions are follows:
1) To calculate the flashpoint of binary mixed liquid fuels, if the flashpoint of a single liquid fuel is known, we can calculate one liquid fuel’s flammable lower limit by re-compensating the other using Raoult’s law and a correction value.
2) For the flame spread rate over binary mixed liquid fuels, the predominating liquid fuel changes near the cross section of vapor concentration distribution in accordance with Raoult’s law.
[image:9.595.209.417.277.439.2]4) When the liquid temperature is 28˚C, the flame spread rate is constant. This is why flammable vapor formed near the liquid surface reaches theoretical mixture ratio.
5) In the case that we calculate flame spread rate over binary mixed liquid fuel by vapor concentration distri-bution from flame spread rate over single liquid fuel and Raoult’s law, we cannot calculate it by the total amount of binary mixed liquid fuel vapor. So we can calculate the flame spread rate by using a conversion coefficient to judge the liquid fuels equivalently.
6) The flame center of binary mixed liquid fuels is proportional to the rise of total vapor concentration of bi-nary mixed liquid fuels.
7) The flame height on binary mixed liquid fuels is proportional to the rise of total vapor concentration of bi-nary mixed liquid fuels.
Acknowledgements
We would like to thank Kenji Takimoto working in Shigeru Corporation, Ltd and Kota Mikami working in To-shiba Plant Systems and Services Corporation for experimental supports and discussions.
References
[1] Burgoyne, J.H., Roberts, A.F. and Quinton, P.G. (1968) The Spread of Flame Across a Liquid Surface. I. The Induc-tion Period. Proceedings of the Royal Society, A308, 39-53. http://dx.doi.org/10.1098/rspa.1968.0206
[2] Burgoyne, J.H., Roberts, A.F. and Quinton, P.G. (1968) The Spread of Flame Across a Liquid Surface. II. Steady-State Conditions. Proceedings of the Royal Society, A308, 55-68. http://dx.doi.org/10.1098/rspa.1968.0207
[3] Burgoyne, J.H., Roberts, A.F. and Quinton, P.G. (1968) The Spread of Flame Across a Liquid Surface. III. A Theoret-ical Model. Proceedings of the Royal Society, A308, 69-79. http://dx.doi.org/10.1098/rspa.1968.0208
[4] Glassman, I., Hansel, J. and Eklund, T. (1969) Hydrodynamic Effects in the Flame Spreading, Ignitability and Steady Burning of Liquid Fuels. Combustion and Flame, 13, 99-101. http://dx.doi.org/10.1016/0010-2180(69)90037-6 [5] Kikaino-Kenkyu, I.H. (1971) Hyomenwokanetsusaretaekitai no ryudo. Kikai no Kenkyu, 23, 1505-1510.
[6] Akita, K. and, Fujiwara, O. (1971) Pulsating Flame Spread along the Surface of Liquid Fuels. Combustion and Flame,
17, 268-269. http://dx.doi.org/10.1016/S0010-2180(71)80172-4
[7] Akita, K. (1972) Some Problems of Flame Spread along a Liquid Surface. Symposium (International) on Combustion,
14, 1075-1083. http://dx.doi.org/10.1016/S0082-0784(73)80097-9
[8] Newman, J.S. (1979) Lase Droplet Velocimeter Measurements of the Gas and Liquid Flow Fields Induced by Flame Propagation over a Liquid Surface. MSE Thesis, Princeton University, Princeton.
[9] Hirano, T., Suzuki, T., Mashiko, I. and Tanabe, N. (1980)Gas Movements in Front of Flames Propagating across Me-thanol. Combustion Science and Technology, 22, 83-91. http://dx.doi.org/10.1080/00102208008952373
[10] Mackinven, R., Hansel, F. and Glassman, I. (1970)Influence of Laboratory Parameters on Flame Spread across Liquid Fuels. Combustion Science and Technology, 1, 293-306. http://dx.doi.org/10.1080/00102206908952209
[11] Matsumoto, Y. and Saito, T. (1980)Ekimennenshodenpanikansurukenkyu. JSEM, 46, 996-1006. (in Japanese) [12] Matsumoto, Y. and Saito, T. (1981) Flame Propagation over Liquid Fuel at Sub-Flash Temperature. Bulletin of JSEM,
24, 123-138.
[13] Takahashi, K., Ito, A., Kudo, Y., Konishi, T. and Saito, K. (2008) Scaling Analysis on Pulsating Flame Spread over Liquids. International Journal of Chemical Engineering, 2008, Article ID: 178292.
http://dx.doi.org/10.1155/2008/178292
[14] Takimoto, K., et al. (2008) Speech Papers Correction, Combustion Symposium Part 46, 286-287. [15] Hirano, T. (1986) Nenshogaku-Nenshogensho to sonoseigyo-, Kaibun-do, 49-63. (In Japanese)
[16] Gulber, O.L. (1982) Laminar Burning Velocities of Methanol, Ethanol and Isooctane-Air Mixtures. Proceedings of the Combustion Institute, 19, 275-281.
[17] Drysdale, D. (1999) An Introduction to Fire Dynamics. 2nd Edition, Wiley, Hoboken, 203. [18] Ueda, M. (Year) Shitsudo to Johatsu—Kiso to Keisokugijutsu Made. Colona Co., 2-4. (In Japanese)
[19] Kuratera, T., Terasaki, K., Nagai, N. and Ito, K. (1982) Kogyo netsurikigaku. Asakurashoten, Tokyo, 96-98. (In Japa-nese)
Vi: Flame spread rate over mainly liquid fuel per 1 vol% [m/s]
Ci: Vapor concentration of ingredient i of binary mixed liquid fuels [vol%]
*
i
C : Vapor concentration of ingredient ionly [vol%]
Cs: Saturated vapor concentration [vol%]
y: The height from liquid surface [mm]
T: Temperature [˚C]
T0: Temperature in laboratory [˚C]
TA: Flashpoint of fuel which has lower flashpoint [˚C] TB: Flashpoint of fuel which has higher flashpoint [˚C] t: Time [s]
P: Pressure [Pa]
D: Diffusion coefficient [cm2/s]
D0: Diffusion coefficient at 0˚C, 1 atm [cm2/s]
α: Inherent value of each liquid fuel [-]