Georgia State University
ScholarWorks @ Georgia State University
Public Health Theses School of Public Health
Spring 5-9-2015
Analysis of the Association between Availability of
School Facilities Available for Physical Activity and
MET Scores among Adolescents aged 12-15:
NHANES National Youth Fitness Survey 2012
Alana CilwickGeorgia State University
Follow this and additional works at:https://scholarworks.gsu.edu/iph_theses
This Thesis is brought to you for free and open access by the School of Public Health at ScholarWorks @ Georgia State University. It has been accepted for inclusion in Public Health Theses by an authorized administrator of ScholarWorks @ Georgia State University. For more information, please contact
Recommended Citation
Cilwick, Alana, "Analysis of the Association between Availability of School Facilities Available for Physical Activity and MET Scores among Adolescents aged 12-15: NHANES National Youth Fitness Survey 2012." Thesis, Georgia State University, 2015.
Page 1
Analysis of the Association between Availability of School Facilities Available for Physical
Activity and MET Scores among Adolescents aged 12-15: NHANES National Youth Fitness
Survey 2012
Alana Cilwick
Page 2
Acknowledgments
I would like to thank the faculty and staff of the School of Public Health at Georgia State
University for the education and guidance provided over the past two years. Specifically I would
like to thank my thesis committee, Dr. Rodney Lyn and Wes Heath, for their support and endless
Page 3
Abstract
Background:
Physical activity (PA) is a means to improve the overall health and well-being of adolescents. Daily PA helps decrease the risk of obesity, chronic diseases, and mental health disorders. However, adolescents are not participating in sufficient amounts of daily PA and negative health related conditions are becoming more prevalent. Youth spend the majority of their days at school. PA in the school environment is influenced by a number of factors
including, break/free times, access to PA facilities, and allotted time for physical education (PE). Improving the factors that contribute to school-based PA levels may facilitate an increase in adolescent’s overall PA level. The purpose of this study is to determine if there is a relationship between access to school facilities for PA during free/lunch periods and MET scores of
adolescents aged 12-15 years. A secondary purpose of this study is to determine if access to school facilities for PA during free/lunch periods is associated with body mass index (BMI).
Methods:
Data for this study were obtained from the 2012 National Health and Nutrition Examination Survey (NHANES) National Youth Fitness Survey (NYFS). MET scores were computed by combing data for moderate and vigorous PA variables by assigning a MET score of 4.0 to moderate recreational activities, and an 8.0 to vigorous recreational activities. METS per week were computed by multiplying MET scores by minutes per week. To determine if mean MET scores or BMI differ significantly between those with and without access to PA, t-tests were conducted on the overall sample and were also stratified by gender.
Results:
Of the 1,640 participants included in the survey, 478 (242 Male, 236 Female) participants met inclusion criteria to be in the analysis of MET scores and BMI. Students with access to PA facilities had a mean MET score 124.71 lower than students without access to PA facilities (p= 0.64). Students with access to PA facilities had a mean BMI 0.49 lower than students without access to PA facilities (p= 0.31). Neither result is statistically significant.
Conclusion:
Page 4
Table of Contents
Acknowledgements………2
Abstract………..……….3
Table of Contents………..……….4
Background………...………….6
Purpose of Study……….…...8
Literature Review………..9
Benefits of PA……….………9
Causes of Decreased PA….….….………...………10
Break-time PA………...………...14
School PA and BMI……….16
Socioeconomic Status……….………..18
Summary of Literature………...18
Methods……….……19
Data………...19
Participants………..…….19
Independent Variable……….…….20
METs……….…20
Dependent Variables………..…..21
Gender…..……….…………...….…22
Data Analysis………23
Results………..….24
Discussion……….29
Limitations………33
Page 5
References……….35
List of Tables Table 1………...24
Table 2………...25
Table 3………...26
Table 4………...26
Table 5………...27
Table 6………...27
Page 6
Background
Physical activity (PA) is regarded by the Centers for Disease Control and Prevention
(CDC, 2011) as one of the most important things one can do for one’s health. The World Health
Organization (WHO) estimates that 1.9 million deaths throughout the world are attributable to
physical inactivity and more than 2.6 million deaths result from being overweight or obese
(Dobbins, Husson, DeCorby, & La Rocca, 2013). The many health benefits associated with PA
include: weight control, reduced risk of chronic diseases (e.g. cardiovascular disease, type 2
diabetes, and some cancers), strengthening of bones and muscles, improved mental health and
mood, improved agility, and increased chances of longer living (Centers for Disease Control and
Prevention, 2011). Apart from these benefits, PA behavior in adolescence is also shown to be
carried over into adulthood (Kobel, Kettner, Erkelenz, Kesztyus, & Steinacker, 2015).
In 2013, the Youth Risk Behavior Survey (YRBS) found that 15.2% of high school
students had not participated in at least 60 minutes of any kind of PA on at least one out of seven
days. A 2011 CDC study found that only three out of ten high school students reported
participating in 60 minutes of PA every day. The USDHHS (2008) guidelines recommend that
children and adolescents should participate in at least 60 minutes of PA daily. Adolescents are
likely to reach these goals by participating in unstructured play, such as recess time, or structured
play, such as organized games and sports. However, as stated, many adolescents are not reaching
the PA levels suggested by the USDHHS guidelines.
Results of decreased PA levels can be seen in the increasing childhood and adolescent
obesity rates from 10.6% in 1999 to 13.7% in 2013 (Youth Risk Behavior Survey, 2013). In
2012, the CDC reported that over one third of children and adolescents were either overweight or
Page 7
increased 30.5% between 2001 and 2009 (Dabelea et al., 2014). As noted above, weight control
and reduced risk of type 2 diabetes are two health benefits of increased PA. In 2013, the YRBS
reported that only 27.1% of students reported being physically active for at least 60 minutes per
day for seven days. The increase of these two diseases may be associated with decreased levels
of PA in adolescents.
Nationally, the school setting has been a central focus in efforts to increase youth PA.
Schools represent a key environment to promote PA in adolescents (Sutherland et al., 2014).
Schools have been recognized as being an ideal environment for increased PA as they enable all
children to avail themselves of the opportunity for PA (Kobel et al., 2015). Most PA at school is
completed during physical education (PE) classes with break times being the only other time
adolescents can partake in PA (Kobel et al., 2015). While PE classes are required in
approximately 75% of all states in elementary through high schools, adolescents spend less than
half the time period participating in moderate to vigorous PA (MVPA) (Babey, Wu, & Cohen,
2014). Other times for PA include free/elective periods, breaks, or lunchtime. Previous research
is limited on the amount of PA adolescents participate in during these times and if schools
provide access to PA facilities during these free times. However, one study did find that when
children had breaks/free time during school, they only spent 25% of the break participating in
MVPA (Kobel et al., 2015). Opportunities to improve PA at school can improve students’
knowledge and awareness of PA benefits, as well as influence a greater percentage of youth
adopting healthy lifestyle behaviors (Tompkins, Zizzi, Zedosky, Wight, & Vitullo, 2004). The
potential for schools to positively affect adolescent’s PA make it crucial to further investigate
factors that influence PA in the school environment.
Page 8
Purpose of Study
The purpose of this study is to determine if there is a relationship between access to
school facilities for PA during free/lunch periods and MET (Metabolic Equivalents of Task)
scores of adolescents aged 12-15 years. Body mass index (BMI) will also be tested as a
dependent variable. This study also aims to determine if these relationships differ between boys
and girls.
Page 9
Literature Review
Benefits of PA
The WHO (2015) reports that regular and adequate levels of PA improve muscular and
cardiorespiratory fitness, as well as bone and functional health. Moreover, school-based
interventions have been found to positively impact MVPA, television viewing, blood cholesterol
and maximal oxygen uptake (VO2max) (Dobbins et al., 2013). The list of benefits of PA is well
established and continuously growing.
A systematic review of health benefits of PA in school-aged adolescents examined the
following health outcomes: cholesterol and blood lipids, high blood pressure, metabolic
syndrome, overweight and obesity, bone mineral density, depression, and injuries (Janssen &
Leblanc, 2010). Results yielded a positive effect of PA on cholesterol, high blood pressure,
overweight and obesity, bone mineral density, and depression (Janssen & Leblanc, 2010). These
health benefits coincide with the impact that PA has been shown to decrease psychological stress
indices such as anxiety, tension, depression and anger (Sothern, Loftin, Suskind, Udall, &
Blecker, 1998). Reducing stress may enhance the immune system, contributing to the overall
health of adolescents (Sothern et al., 1998).
Other benefits of school PA include cognitive and behavioral benefits in the classroom.
The Physical Activity Across the Curriculum (PAAC) project found that physically active
academic lessons of moderate intensity improved overall performance on a standardized test of
academic achievement by 6% (Donnelly & Lambourne, 2011). These academic lessons
incorporate PA, such as hopping and skipping, into the traditional classroom setting. Lessons like
this provide students with additional opportunities for PA while still adhering to the necessary
Page 10
that PA has a significantly positive impact on children’s cognitive outcome and academic
achievement, especially aerobic exercise (Fedewa & Ahn, 2011). A cross-sectional and
longitudinal study of 11 year olds objectively measured data collected from the Avon
Longitudinal Study of Parents and Children in the U.K. to determine if academic attainment and
PA are related in adolescents (Booth et al., 2013). Higher MVPA was found to be associated
with higher subsequent academic attainment (Boot et al., 2013). Therefore, increasing PA in and
out of the school environment may help improve performance in the classroom.
Causes of Decreased PA
The causes for low levels of PA in adolescents include environmental, motivational, and
other factors. The WHO (2015) relates decreasing PA levels with high or rising gross national
product. Also adding to the problem is declining leisure time PA and increasing sedentary
behaviors at school and at home. Altogether, both time spent at school and at home influence PA
behaviors in adolescents are causing the decline in PA levels.
Built Environment
The growing trend in lower levels of PA in youth may be influenced by built
environment and neighborhood design. Greater access to outdoor play/sports areas/parks and
availability of PA-related facilities have been associated with higher levels of PA in youth (Slater
et al., 2010). A cross-sectional study of 8th and 10th graders found that increased local area PA
outlets were associated with higher levels of PA (Slater et al., 2010). The same study concluded
that lower levels of neighborhood safety were associated with decreased PA, higher prevalence
of obesity and higher BMI (Slater et al., 2010). The results demonstrate how youth are more
Page 11
Urban settings can greatly affect the PA levels of youth. Typically, urban environments
are more compact and have fewer green spaces than rural environments, making those who live
further from green spaces less likely to visit them (Coombes, Jones, & Hillsdon, 2010).
Adolescents with exposure to greener neighborhoods and spaces are more likely to have a lower
BMI and higher MVPA (Edwards, Hooper, Knuiman, Foster, & Giles-Corti, 2015). These green
spaces and parks not only need to be in close proximity, but also need to include safety and other
specific features. Edwards et al. (2015) found that higher park use by adolescents was associated
with the presence of lighting around park, a skate park, walking paths, BBQs, picnic tables,
public access toilets, and a high number of trees. Improving the features of parks increases the
odds that adolescents will use them for PA.
Built environment also plays a role in active school commuting. Studies have found that
adolescents who participate in active modes of transport (walking or cycling) are more likely to
have overall increased PA. A study on built environment as a factor to active school commuting
found that differences in built environment along school routes were significantly associated
with frequency of active commuting to school and overall daily MVPA (Oreskovic et al., 2014).
The study found that even though higher traffic volume occurred among high connectivity
routes, these high connectivity routes were associated with 18 more minutes of daily MVPA than
routes with low connectivity (Oreskovic et al., 2014). Improving the connectivity and walkability
of routes to school can help increase PA in adolescents.
Passive transportation may prohibit adolescents from reaching daily PA
recommendations. In a systematic review of active school transport related to physical fitness,
the majority of studies examined found that active school travelers were more active than those
Page 12
same review found that active school transport interventions lead to increases in PA (Larouche et
al., 2014). A yearlong cross-sectional study of modes of transportation to school found that
adolescents in Norway who cycled to school had better cardiorespiratory fitness compared to
passive transport to school (Ostergaard, Kolle, Steene-Johannessen, Anderssen, & Andersen,
2013).
Sedentary Behavior
Sedentary behavior consists of any activities that use an energy expenditure of less than
or equal to 1.5 METs while in a sitting or reclining posture (Herman, Hopman, & Sabiston,
2015). Watching television and using a computer are sedentary behaviors that youth are likely to
participate in. Sedentary behaviors are associated with negative health outcomes that are typical
of physical inactivity. Findings of a systematic review on health outcomes related to sedentary
behavior found that sedentary behavior is associated with all-cause cardiovascular mortality,
regardless of PA level or BMI (Rezende, Lopes, Rey-Lopez, Matsudo, & Luiz, 2014). The same
review found that sedentary behavior is associated with increased risk of colorectal, breast,
endometrial, ovary, and prostate cancer (Rezende et al., 2014). Other adolescent health outcomes
associated with sedentary discovered in the review include risk of obesity, increased blood
pressure and total cholesterol, self-esteem and behavior problems, and physical fitness and
academic achievement (Rezende et al., 2014). Another systematic review reinforces the health
outcomes stated above but also reports that increased sedentary time in adolescents is associated
with increased risk for metabolic syndrome and risk for cardiovascular disease (Tremblay et al.,
Page 13
While at home, adolescents participate in greater amounts of screen time (e.g. computer
and television activities). A study of diet and PA behaviors in Mexican school aged children 8-10
years, found through questionnaire data that participants exceeded the two-hour limit of “screen
time” per day recommended by the American Academy of Pediatrics (Perez-Rodriguez,
Melendez, Nieto, Aranda, & Pfeffer, 2012). Mental health may also be affected by sedentary
behavior such as high screen-time use as reported by Kremer et al. (2014). Results of the study
found that young adolescents who participated in PA and who had low levels of screen-time
were less likely to report depressive symptoms than those with higher amounts of screen-time
(Kremer et al., 2014). Screen-time is also associated with cardiorespiratory fitness. A study of
Australian adolescents found a significant inverse relationship between screen-time and
cardiorespiratory fitness (Sandercock & Ogunleye, 2013). Results from both of these studies
illustrate that increased screen-time leads to decreases PA, which affects fitness level and mental
health status in adolescents.
Physical Education (PE)
PE has been associated with increased PA among adolescents (Drake et al., 2012). The
impact that PE classes can have on adolescents has led to policy creation that requires a certain
amount of PE in schools. The current PE requirement in California requires 200 minutes of PE
every ten school day for students grades one through six and 400 minutes of PE every ten school
days for students in grades seven through twelve (Consiglieri, Leon-Chi, & Newfield, 2013).
Results of a study on the observance of the California PE policy discovered that there is low
Page 14
to PE requirements indicates that while adolescents attend PE classes, they are still not
participating in enough PA during these classes.
As of 2013, the number of states that required PE was 43 for elementary schools, 40 for
middle schools, and 46 for high school (Carlson et al., 2013). However, the number of states that
require the recommended 150 minutes/week of PE for elementary schools was three, one state
required the recommended 225 minutes/week of PE for middle schools, and no states met the
recommended 225 minutes/week of PE for high schools (Carlson et al., 2013). The problem
seems not to be the policies but the adherence to the PE policies.
Break-Time PA
The literature on the use of school PA facilities during lunch, free, or elective periods is
limited. However, a few studies have discussed the impact that break times at school have on
PA. A German study examining the incidence of break times related to PA discusses the
advantages of this time over formal PE classes; one main advantage being that adolescents have
the chance to engage in daily PA through play (Kobel et al., 2015). Similarly, a study examining
adolescents’ PA during recess and lunchtime, discusses how these periods are prevalent for
almost all adolescents every school day and increasing PA during these periods could make a
significant contribution to their overall PA levels (Yildirim et al., 2014). Other researchers note
taking advantage of these informal situations to increase PA as an opportunity to encourage
active play in children (Hyndman, Benson, Ullah, & Telford, 2014a). However, an obstacle to
enhancing PA levels in adolescents has to do with the limited play spaces and equipment
available to adolescents during these break times or lunch periods (Hyndman et al., 2014a).
Researchers agree that unstructured active play at school can be a great opportunity to address
Page 15
Understanding the amount of time available for adolescents to engage in PA during
school is crucial to understanding if break times, lunch periods, and free periods are feasible
times to encourage adolescents to increase their PA. Results of a study conducted in Vancouver
found that while most participants were meeting overall school PA guidelines, opportunities to
engage adolescents more effectively during lunch and PA periods were being missed (Nettlefold
et al., 2011). These results are similar to studies concluding that children who have a greater
amount of break times have higher amounts of MVPA during the day (Kobel et al., 2015). This
is consistent with findings of a study that found longer morning breaks plays a role in increasing
MVPA behaviors in 9-11 year olds (Mantjes et al., 2012). Other results have shown that students
are more likely to participate in break time MVPA if allowed to bring in sports equipment to
school, or have access to school-owned sports equipment (Ridgers, Timperio, Crawford, &
Salmon, 2013). Results of a break time intervention that incorporated the use of games during
15-minute school breaks found that children were more active during the games program than
during standard playtime (Loprinzi, Cardinal, Loprinzi, & Lee, 2012). The studies suggest that
increasing break times, as well as increasing access to PA equipment, may help increase daily
MVPA in school adolescents.
Literature on the topic has also addressed the enjoyment levels and age groups that are
participating in break and lunch time PA. A study on rural school PA found that adolescents
older than 11 years participated in less playground PA during break times than children aged 8-9
years (Escalante, Backx, & Saavedra, 2014). As adolescents grow older, it is important to target
school interventions towards them to increase their break time PA. When further examining how
to increase break and lunch time PA, a study on adolescents’ enjoyment discusses the importance
Page 16
Finch, & Telford, 2014b). Results of the study identified high levels of children’s enjoyment of
lunchtime play among elementary children (Hyndman et al., 2014b). However, the study did not
conduct further research on whether or not adolescents participating had high levels of PA during
lunchtime.
School PA and BMI
School environment may also have the ability to affect body mass index (BMI) in
adolescents. Some studies have found that requiring PE in school is associated with lower BMI,
and while results can be inconsistent, the school food and PA environments play at least some
role in student’s weight status (Vericker, 2014). However, BMI and school environment has
mostly been researched in terms of school lunch offerings, not PA.
Previous research has concluded that a combination of diet and PA are important factors
for maintaining a healthy BMI range (Dobbins et al., 2013). Elgar et al. (2005) also found that
PA in early adolescence reduced BMI increases during adolescence. The association between PA
and BMI also affects the mental health status of adolescents. A study on Chinese adolescents
discovered that low PA level and high BMI increase the risk for depression (Wang, Fu, Lu, Tao,
& Hao, 2014). These results demonstrate the impact that PA has on BMI, and BMI on mental
health status in adolescents.
Some studies suggest that increased PA can reduce BMI. A study aiming to better
understand the relationship between PA and BMI found that a decrease in MVPA among boys
was associated with an increase in BMI scores (Basterfield et al., 2014). Another study also
reported that increased MVPA predicted reduced BMI score over a three-year follow-up in
obese/overweight children (Trinh, Campbell, Ukoumunne, Gerner, & Wake, 2013). Similar
Page 17
participants were clustered into either low PA, high sedentary behavior (LPAHSB) and high PA,
low sedentary behavior (HPALSB) groups (Lee, 2014). Participants in the LPAHSB had the
greatest BMI while participants in the HPALSB cluster had the lowest BMI (Lee, 2014). The
studies above suggest that increasing the amount of PA adolescents participate in while at school
may help decrease their BMI.
Other studies have found in general no significant relationship between PA and BMI
(Aires et al., 2010) and that school lunch may have a larger impact on BMI compared to PA
(Vericker, 2014). There has not been research done on BMI in relation to use of school facilities
available to adolescents during free periods for PA.
Results from school-based interventions have found that increased PA during school may
help reduce BMI. A Chinese intervention study placed children and adolescents aged 7 to 15
years into either a control group or an intervention group that consisted of a multi-component PA
intervention (PE improvement, extracurricular PA, PA at home, and health education lectures)
for 12 weeks (Li et al., 2014). Results of the intervention showed that those who participated in
the intervention had significantly decreased levels of BMI, skinfold thickness and fasting
glucose, and increased duration of MVPA (Li et al., 2014). A systematic review of obesity
treatment in adolescents found that throughout the majority of the trials that assessed BMI
change, intervention participants had a significantly greater reduction in BMI compared with
participants in the control groups (Peirson et al., 2015).
Other school-based interventions have found no significant effects related to BMI. The
SPARK (Sports, Play, and Recreation for Youth) was developed to increased PA, improve
cardiorespiratory fitness, and weight status among elementary students after school (Herrick,
Page 18
intervention or control groups. Results showed there was no difference between groups in mean
change of MVPA, BMI z-score, or cardiorespiratory fitness (Herrick et al., 2012).
Socioeconomic Status (SES)
Socioeconomic status (SES) may be another predictor to PA level in adolescents. The
physical fitness of an adolescent with a low SES may be affected due to lack of health education,
low-quality food, and lack of recreation facilities (Bohr, Brown, Laurson, Smith, & Bass, 2013).
The physical fitness status of low SES youth can be seen in their overall level of PA. A study of
high school girls found significant differences between high and low SES groups for body
composition, mile run, and physical activity, with girls from lower SES having lower levels of
overall fitness (Bohr et al., 2013). The differences between the groups may be another factor to
consider when attempting to understand youth PA at school. School-based PA offers
opportunities to combat factors like SES, as all youth should have equal access to school
facilities.
Summary of Literature
Results of the literature review reflect the increasing trend in decreased PA in
adolescents. The causes of lower PA include built environment, increased screen-time, and low
participation in PE classes. The school environment is both a cause of decreasing PA and a
possible solution. Increasing PE classes and allowing adolescents to take part in PA during break
times may improve PA levels. The benefits to increased PA make it crucial to explore how
schools can make changes to improve the overall health of adolescents.
Page 19
Methods
This study aims to determine if there is a relationship between access to school facilities
for PA during free/lunch periods and recreational MVPA and BMI in adolescents aged 12-15.
Data and IRB Approval
Data for this study were obtained from the 2012 National Health and Nutrition
Examination Survey (NHANES) National Youth Fitness Survey (NYFS), conducted by the
National Center for Health Statistics (NCHS), a division of the Centers for Disease Control and
Prevention (CDC). The NYFS was administered in congruence with the 2012 NHANES. The
NCHS Research ERB approved the NYFS and informed signed consent was obtained from all
participants. Approval for this study came from the Georgia State University IRB. IRB approval
was based on Designation of Not Human Subjects Research due to the nature of the secondary
data in this study.
Participants
The NYFS collected data on PA and fitness levels of children and adolescents aged 3-15
through both questionnaires and physical examination. Of the 2,065 children and adolescents
selected to participate in the survey, 1,640 were interviewed, and 1,576 were examined. Of the
1,640 participants, 823 (50.2%) were male and 817 (49.8%) were female. The PA questionnaire
was administered to participants’ aged 12-15, who answered the questionnaire themselves. This
study will only be looking at participants aged 12-15 because of the age limitation of the PA
Page 20
Independent Variable
The independent variable for this study is access to school facilities. The PA
questionnaire asked if students were allowed to use school facilities such as the gymnasium,
tennis courts, weight room, or track during lunch or a free/elective period during school time.
Participants either answered “yes”, “no”, or “don’t know”. Those who did not answer or that
answered, “don’t know” were recorded as “missing”.
Metabolic Equivalents of Task (METs)
Metabolic equivalents of task (METs) are defined by the U.S. Department of Health and
Human Services (2008) as the ratio of the rate of energy expended during an activity to the rate
of energy expended at rest. METs are a simple way to express the energy cost of physical
activities as a multiple of the resting metabolic rate (Jette, Sidney, & Blumchen, 1990). For
example, 1 MET is the rate of energy expenditure while at rest, 4 METs relate to moderate PA,
and 8 METs are associated with vigorous PA. MET-minutes refer to the amount of minutes an
individual partakes in a task times the MET. For example, an individual that participates in 30
minutes of 4 METs receives 120 MET-minutes (US, Department of Health and Human Services,
2008). Assigning a MET to all types of physical activities helps provide a general system to
understand energy expenditure. However, there are some limitations to using the METs system.
One limitation is a person's size. A larger individual can be expected to have a larger resting
oxygen uptake compared to a smaller person (Jette et al., 1990). An individual’s percentage of
body fat also affects their metabolic rate. For example, two individuals that weigh the same but
Page 21
1990). However, even with these limitations, METs represent an effective and simple method to
understand energy expenditure.
The use of METs in PA studies has been used to produce a general scale for
understanding PA levels. A study assessing PA behavior and peer influence in young children
attached accelerometers to the hips of children to record their PA and then converted the
accelerometer data into METs (Barkley et al., 2014). Similar, a study using the ActiGraph
GT1M, a PA recording device attached to a child’s hip, was used to record PA and calculated
METs in children with attention deficit hyperactivity disorder (ADHD) (Lin, Yang, & Su, 2013).
METs have also been converted based on self-report of PA. An intervention study of overweight
children aimed at improving BMI and PA asked children weekly to recall their PA and then a
MET was assigned to each activity (Siwik et al., 2013). Whether being used objectively or
subjectively, METs are useful to get a general level of PA in adolescents.
Dependent Variables
The main dependent variable for this study is MET scores for moderate and vigorous
recreational activities. To calculate the MET scores, six different variables were examined
including: participation in vigorous recreational activities, days per week participating in
vigorous activities, minutes per day vigorous recreational activities, participation in moderate
recreational activities, days per week participating in moderate recreational activities, and
minutes per day moderate recreational activities. According to the survey, vigorous recreational
activities included sports or fitness activities that cause large increases in breathing or heart rate,
like running or basketball, for at least 10 minutes continuously. Moderate recreational activities
Page 22
brisk walking, bicycling, or swimming, for at least 10 minutes continuously. Data for the six
variables were collected by first asking participants if they participated in vigorous or moderate
recreational PA for at least 10 minutes (Centers for Disease Control and Prevention, Division of
Health and Nutrition Examination Surveys, 2012). If yes, participants are then asked on average
how many days per week do they participate in moderate or vigorous PA. Finally, participants
answered how many minutes per day they participated in moderate or vigorous PA on average.
These six variables were converted by assigning MET scores to the moderate and
vigorous activities. For moderate activities, a MET score of 4.0 was assigned, while a MET score
of 8.0 was assigned to vigorous activities. To find the MET minutes of PA per week, reported
minutes of moderate or vigorous PA was multiplied by the moderate (4.0) or vigorous (8.0) MET
scores. MET scores for this study were determined by the suggestions of the NYFS as given in
the appendix (Centers for Disease Control and Prevention, Division of Health and Nutrition
Examination Surveys, 2012). The final MET score variable used for this analysis is the METs
per week, which combines the moderate and vigorous categories into a single MET score. The
secondary dependent variable for this study is BMI. BMI in the NYFS (2012) was taken as part
of the examination section. BMI is calculated based on height and weight of an individual. BMI
values of the survey ranged from 11.9 to 48.3 (Centers for Disease Control and Prevention,
Division of Health and Nutrition Examination Surveys, 2012).
Gender
A possible contributing factor to PA level in adolescents is gender. Socio-demographics
and lifestyle factors have been noted as important determinants of PA among adolescents (Seo et
al., 2013). It has been previously established that among youth, boys tend to be more physically
Page 23
Cerin, 2010). The difference in PA among girls and boys remains true at school, with boys
engaging in more PA than girls. A study on PA gender differences found that boys engaged in
greater amounts of MVPA than girls and boys were more likely to meet daily PA guidelines
(Crespo et al., 2013). The difference between boys and girls engagement in PA is well
established in the literature however it must be taken into account when discussing the
participation of adolescents in PA during break times at school.
Data Analysis
First, recreational PA data from the survey was transformed into MET scores as
explained above. A number of tests were conducted for the analysis. An independent samples
t-test was conducted to determine if there was a significant relationship between the means of
those who do and do not have access to school PA facilities. Weights were accounted for the in
the procedure with the weight variable provided in the NYFS data. A weight from the
questionnaire data was used for the MET analysis and examination weights were used for the
BMI analysis. Another t-test was performed to determine if there was a relationship between the
secondary dependent variable (BMI) and school facilities. After the overall t-test was completed,
two other independent sample t-tests were conducted among male and female participants
separately to determine if the association differed between the genders. P < .05 and 95% CI were
used to determine statistical significance for all procedures. All statistical analyses were
Page 24
Results
[image:25.612.70.410.126.704.2]Demographics
Table 1: Demographics N % Mean SD
Age 13.39 1.09
METS/WK 2758.03 3030.19
BMXBMI 22.79 5.45
Sex
Male 242 50.63
Female 236 49.37
Race
Mexican American 60 12.55 Other Hispanic 70 14.64 Non-Hispanic White 212 44.35 Non-Hispanic Black 100 20.92 Other Race - Including Multi-Racial 36 7.53
Annual Household Income
$ 0 to $ 4,999 9 1.89
$ 5,000 to $ 9,999 10 2.10 $10,000 to $14,999 29 6.09 $15,000 to $19,999 27 5.67 $20,000 to $24,999 44 9.24 $25,000 to $34,999 57 11.97 $35,000 to $44,999 32 6.72 $45,000 to $54,999 29 6.09 $55,000 to $64,999 31 6.51 $65,000 to $74,999 32 6.72 $20,000 and Over 14 2.94
Under $20,000 3 0.63
$75,000 to $99,999 41 8.61 $100,000 and Over 108 22.69
Access
Yes 276 57.74
Page 25
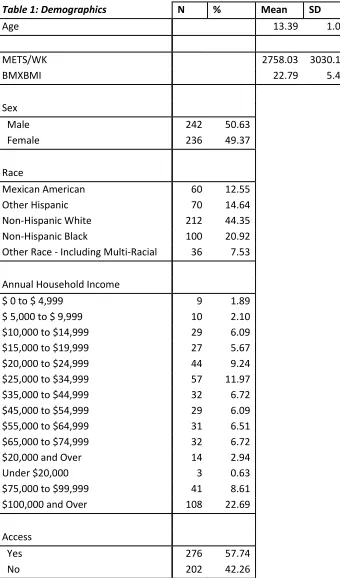
Table 1 illustrates the demographics of the participants that were included in the analysis.
Demographics were not weighted. Of the 1,640 participants included in the survey, 478 were
within the age range (12-15) and had complete data. The overall mean weighted METS per week
for females in this study is 2239.50 and 3247.70 for males. The overall mean weighted BMI for
females in this study is 23.01 and 22.62 for males.
MET Scores Results
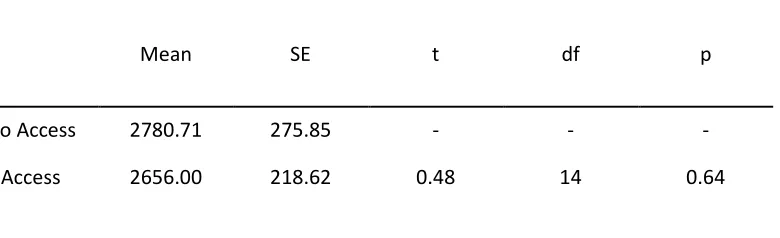
The overall mean weighted METS per week for participants in this study with and
without access to facilities at school is 2728.10. The MET score t-test results shows a -124.71
difference between no access (µ=2780.71) and access (µ=2656.00), but this difference is not a
statistically significant difference from 0 (p= 0.64). Table 2 shows results of the MET score and
facilities t-test.
[image:26.612.85.475.448.567.2]
Table 2: MET Scores and Facilities
Mean SE t df p
No Access 2780.71 275.85 - - -
Access 2656.00 218.62 0.48 14 0.64
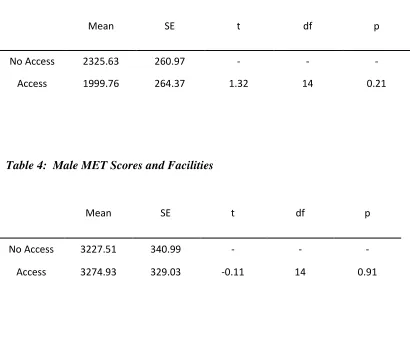
The effect of availability of school facilities on MET scores was also tested separately for
boys and girls. The results of the female MET score t-test showed a -325.87 difference between
no access (µ=2325.63) and access (µ=1999.76) to facilities, which is not a statistically significant
difference (p= 0.21). Table 3 shows results of the MET analysis with the facilities variable for
Page 26
access (µ=3227.51) and access (µ=3274.93) to facilities, which is not a statistically significant
difference (p= 0.91). Table 4 shows the results of the MET analysis with the facilities variable
for males.
[image:27.612.69.479.201.551.2]
Table 3: Female MET Scores and Facilities
Mean SE t df p
No Access 2325.63 260.97 - - -
Access 1999.76 264.37 1.32 14 0.21
Table 4: Male MET Scores and Facilities
Mean SE t df p
No Access 3227.51 340.99 - - -
Access 3274.93 329.03 -0.11 14 0.91
BMI Results:
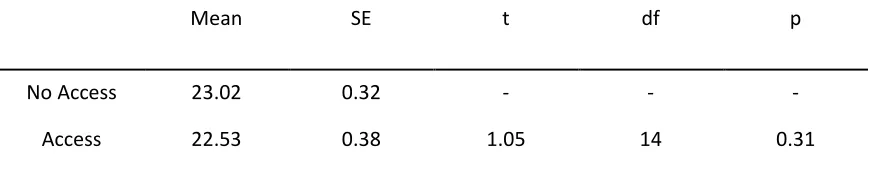
The overall mean weighted BMI of adolescents with and without access to facilities for
this study is 22.81. The results of the BMI t-test show a -0.49 difference between no access (µ=
23.02) and access (µ=22.53) to facilities, which is not a statistically significant difference (p=
Page 27
Table 5: BMI and Facilities
Mean SE t df p
No Access 23.02 0.32 - - -
Access 22.53 0.38 1.05 14 0.31
The effect of availability of school facilities on BMI was also tested separately for boys
and girls. The results of the female BMI score t-test showed a -1.02 difference between no access
(µ=23.44) and access (µ=22.42) to facilities, which is not a statistically significant difference (p=
0.08). Table 6 shows results of the BMI analysis with the facilities variable for females. The
results of the male BMI score t-test showed a 0.02 difference between no access (µ=22.61) and
access (µ=22.63) to facilities, which is not a statistically significant difference (p= 0.98). Table 7
shows the results of the BMI analysis with the facilities variable for males.
Table 6: Female BMI and Facilities
Mean SE t df p
No Access 23.44 0.61 - - -
Page 28
Table 7: Male BMI and Facilities
Mean SE t df p
No Access 22.61 0.47 - - -
Page 29
Discussion
The purpose of this study was to examine the association of access to school PA facilities
during free/elective periods and MET scores. The secondary purpose of this study was to
examine the relationship between school facilities and BMI. Neither MET scores nor BMI were
significantly associated with access to school PA facilities during free/elective periods. The
effect of access to school PA facilities on MET scores was also shown to not be statistically
significant among males or females separately.
Results of this study showed that adolescents aged 12-15 with access to school PA
facilities during free, elective, or lunch periods had MET scores per week 124.71 less than those
who said they did not have access, but this difference was not significantly different from zero.
This study also found that the BMI of those with access was 0.49 less than those without access.
Both results were not statistically different to say that access to school facilities had either a
positive or negative effect on MET scores or BMI.
Overall, males showed to have higher average MET scores (µ= 3247.70) than females
(µ= 2239.50). Males also had a lower average BMI (µ= 22.62) than females (µ= 23.01). These
results coincide with previous literature, which reports that males engage in more PA than
females and have a lower BMI. The results of this study suggest that female and male
adolescents need specially tailored PA interventions. Specifically targeting female and male
adolescents separately through tailored PA interventions may help improve their MET scores and
possibly their BMI. However, before creating these tailored interventions, a better understanding
for the reasons females and males are not participating in PA would be needed. Crespo et al.
(2013) reports that males and females have different correlates for PA, which may partly explain
Page 30
pressure, and perceived norms (Peykari et al., 2015). Considering these factors when creating
female targeted PA interventions may help make interventions more effective. An example of
this has to do with female body image. Adolescent girls may prefer being in classes with their
same-sex peers as they may be sensitive to issues of body image and self-presentation while
being active in mixed-sex environments (Pearson, Braithwaite, & Biddle, 2015). Results of a
meta-analysis investigating adolescent girls PA interventions found that out of the 45 studies
included in the analysis, the average treatment effect for adolescent girls involved in PA
interventions was significant but small (Pearson et al., 2015). The meta-analysis concluded that
interventions to increase PA in adolescent girls may be a challenging task as it requires behavior
change. To improve effectiveness of similar interventions, evidence based practices, longer
follow-ups, use of objective measures, and assessment of potential mediators of behavior change
should be implemented (Pearson et al., 2015).
While the results from this study suggest that males participate in more PA than females,
there are still ways to improve the health of adolescent boys. A 16-month randomized, controlled
school-based study compared the effects of a daily PA program among boys and girls
(Macdonald, Kontulainen, Khan, & McKay, 2007). Findings suggest that daily PA enhances
bone strength at the distal tibia in prepubertal boys, but not in girls the same age (Macdonald et
al., 2007). Another intervention aimed to increase cardiovascular fitness and body composition
in adolescent black boys (Howe, Harris, & Gutin, 2011). Results of this intervention found that
after 10-months of an after-school PA intervention, boys who attended the intervention at least
3-days/ week had significant reduction in body fat, BMI, and fat mass compared to those in a
Page 31
PA interventions. It is recommended that future studies and interventions, target adolescent boys
and girls separately to improve their PA levels.
The lack of a statistically significant difference of variables in this study does not confirm
the absence of a relationship between PA and school facilities. Hood et al., (2014) researched PA
breaks and facilities in secondary schools. Compared to a 2006 study, Hood et al. (2014) found
that the prevalence of PA breaks was much lower (27.2% lower for middle school students and
9.3% lower for high school students) than the levels of PA in the School Health Policies and
Programs Study (SHPPS) four years prior. The decreasing amounts of PA breaks provide
adolescents with less time to participate in PA, decreasing their overall PA level. The same study
found a small but statistically significant association between facilities and PA, and PA breaks in
middle schools were associated with lower rates of obesity and overweight (Hood et al., 2014).
This study illustrates the influence that school breaks may have on PA and weight status and
continuous research should be conducted to determine the effect of school breaks related to PA
and if they serve as an opportunity to influence PA.
While there was no statistically significant relationship found in this study, according to
the literature suggests a relationship between school PA interventions and adolescent’s PA
levels.Previous studies have specifically examined the effect of school PE interventions on
adolescent’s PA. A PE intervention was found to be effective in improving the PA habits and
physical performance of adolescents and decreasing daily sedentary activities (Sacchetti et al.,
2013). It has also been found through a study of high school students that higher school day
MVPA was associated with higher overall MVPA (Long et al., 2013). These results suggest that
Page 32
A possible explanation for the statistically insignificant differences seen in this study may
have to do with time available to partake in PA during the free/lunch periods. The NYFS data did
not ask participants how much time was available during free/lunch periods. While students may
have access to PA facilities throughout the school day, if they do not have enough time to utilize
them, their MET scores would not be affected. To better understand if access affects MET
scores, further details on time available to students would need to me collected. A previous study
found that very little MVPA is performed during recess at school with children spending about
73% of recess time participating in sedentary activities (Perez-Rodriguez et al., 2012). Future
research on the subject should include time available to be spent on PA at school as a possible
barrier to PA participation.
While the results of this study did not show a statistically significant difference in mean
METS or BMI between those with and without access to PA facilities at school, other research
has shown that both social and built environments can affect adolescents’ PA level. Adolescents’
perceptions of access to PA facilities also are proven to be more closely associated with use of
facilities than proximity (Carroll-Scott et al., 2013). It is also possible that statistically
insignificant difference relates to a lack of intentional effort by adolescents to use the school PA
facilities provided. Adolescents need to have motivation to participate in PA in order for it to
have a positive effect on them. The lack of essential motivation and the pressure of academic
assignments influences adolescents to remove PA from their daily priorities (Peykari et al.,
2015). Recommendations for future research would be to include built environment as a
contributing factor to PA level as well as investigate the effects of motivation on PA.
The importance of increased PA at school is not just important to increase overall PA but
Page 33
access to school PA facilities and academic performance. However, more research is needed to
improve our understanding of the relationship between PA and academic achievement. Donnelly
and Lambourne (2011) found that a curriculum-based PA intervention improved academic
achievement in participants, as well as decreased BMI.
Limitations
The first limitation to this study is that the data from the PA questionnaire was
self-reported. Self-reported data can be biased or false, especially self-reported data from adolescents.
Adolescents may either underestimate or overestimate the amount of PA they participate in,
therefore data may not accurately reflect the actual amount of PA. Also, adolescents may be
unaware whether or not they have access to PA facilities at school during their lunch or free
periods. The data from the examination portion of the NYFS would be based on surveyor
reporting, and while this method is less likely to be biased, there is still a possibility for surveyor
error.
A final limitation in this study is that potentially important confounders, like SES were
not controlled for in the analysis. SES may affect the amount of PA that adolescents participate
in.
Implications and Future Studies
While results from this study showed no statistically significant relationship between
school facility access and MET scores, time spent at school represents an opportunity to
influence PA level in adolescents and should not be overlooked. Further research should
Page 34
collected related to free/lunch period PA and whether adolescents at school have access to PA
facilities. Time available to engage in PA during school breaks should be researched further as
well. Improving access within the school environment has vast implications for adolescent’s
overall wellbeing. Tailoring PA interventions differently between girls and boys would also be
important in the future since barriers to PA differ among gender. As stated, adolescent females’
PA participation is strongly affected by social influences compared to adolescent boys who are
more influenced by their physical abilities to participate in PA (Peykari et al., 2015). Focusing
programs that target these key issues may allow for more effective interventions.
It is known that increased PA in adolescents can lead to many health benefits including:
weight control, mental health, cognitive achievement, and decreased risk for type 2 diabetes and
other chronic diseases. Future interventions should also focus on PA promotion programs, and
not just on increasing access. Results from previous literature emphasize the need for providing
adolescent health programs based on specific needs (Peykari et al., 2015). Other evidence
suggests that school-based PA interventions of longer duration may influence adolescents’ PA
level (Dobbins, Husson, DeCorby, & LaRocca, 2013). The importance of providing programs
based on previous research will help create efficient PA interventions. The long list of benefits
associated with increased PA illustrates the need for future research and interventions on the
topic. Finally, the potential for school facilities to positively impact the benefits of PA make it
crucial to further investigate PA opportunities school facilities may provide adolescents.
Page 35
References:
Aires, L., Silva, P., Silva G., Santos, M. P., Ribiero, J. C., & Mota, J. (2010). Intensity of physical activity, cardiorespiratory fitness, and body mass index in youth. Journal of Physical Activity and Health, 7 (1), 54-9.
Babey, S. H., Wu, S., & Cohen, D. (2014). How can schools help youth increase physical activity? An economic analysis comparing school-based programs. Preventative Medicine, 69, 55-60.
Barkley, J. E., Salvy, S. J., Sanders, G. J., Dey, S., Von Carlowitz, K. P., & Willamson, M. L. (2014). Peer influence and physical activity behavior in young children: an experimental study. Journal of Physical Activity and Health, 11 (2), 404-9.
Basterfield, L., Jones, A. R., Parkinson, K. N., Reilly, J., Pearce, M. S., Reilly, J. J., & Adamson, A. J. (2014). Physical activity, diet and BMI in children aged 6-8 years: a cross-sectional analysis. Biomedical Journal, 4 (6).
Bohr, A. D., Brown, D. D., Laurson, K. R., Smith, P. J., & Bass, R. W. (2013). Relationship between socioeconomic status and physical fitness in junior high school students. The Journal of School Health, 83 (8), 542-7.
Booth, J. N., Leary, S. D., Joinson, C., Ness, A. R., Tomporowski, P. D., Boyle, J. M., & Reilly, J. J. (2014). Associations between objectively measure physical activity and academic attainment in adolescents from a UK cohort. British Journal of Sports Medicine, 48, (3),
265-270.
Carlson, J. A., Mignano, Sallis, J. F., Chriqui, J. F., Schneider, L., McDermid, L. C., & Agron, P. (2013). State policies about physical activity minutes in physical education or during school. The Journal of School Health, 83 (3), 150-6.
Carroll-Scott, A., Gilstad-Hayden, K., Rosenthal, L., Peters, S. M., McCaslin, C., Joyce, R., & Ickovics, J. R. (2013). Disentangling neighborhood contextual associations with child body mass index, diet, and physical activity: the role of built, socioeconomic, and social environments. Social Science and Medicine, 95, 106-14.
Centers for Disease Control and Prevention. (2011). The benefits of physical activity. Physical Activity and Health. Retrieved from
Page 36
Consiglieri, G., Leon-Chi, L., & Newfield, N. S. (2013). Policy challenges in the fight against childhood obesity: low adherence in San Diego area schools to the California education code regulating physical education. Journal of Obesity. 483017.
Coombes, E., Jones, A. P., & Hillsdon, M. (2010). The relationship of physical activity and overweight to objectively measure green space accessibility and use. Social Science and Medicine, 70 (6), 816-22.
Crespo, N.C., Corder, K., Marshall, S., Norman, G. J., Patrick, K., Sallis, J. F., & Elder, J. P. (2013). An examination of multilevel factors that may explain gender differences in children’s physical activity. Journal of Physical Activity and Health, 10 (7), 982-92.
Dabelea, D., Mayer-Davis, E. J., Saydah, S., Imperatore, G., Linder, B., Divers, J., Bell, R., Badaru, A., Talton, J. W., Crume, T., Liese, A. D., Merchant, A. T., Lawrence, J. M., Reynolds, K., Dolan, L., Liu, L. L., & Hamman, R. F. (2014). Prevalence of type 1 and type 2 diabetes among children and adolescents from 2001 to 2009. The Journal of American Medical Association, 311 (17), 1778-86.
Drake, K. M., Beach, M. L., Longacre, M. R., MacKenzie, T., Titus, L. J., Rundle, A. G., & Dalton, M. A. (2012). Influence of sports, physical education and active commuting to school on adolescent weight status. Pediatrics, 130 (2). 296-304.
Dobbins, M., Husson, H., DeCorby, K., & LaRocca, R. L. (2013). School-based physical activity programs for promoting physical activity and fitness in children and adolescents aged 6 to 18. The Cochrane Database of Systematic Reviews, 2.
Donnelly, J. E., & Lambourne, K. (2011). Classroom-based physical activity, cognition, and academic achievement. Preventative Medicine, 52, 36-42.
Edwards, N., Hooper, P., Knuiman, M., Foster, S., & Files-Corti, B. (2012). Associations between park features and adolescent park use for physical activity. The International Journal of Behavioal Nutrition and Physical Activity. 12 (21).
Elgar, F. J., Roberts, C., Moore, L., & Tudor-Smith, C. (2005). Sedentary behavior, physical activity and weight problems in adolescents in Wales. Public Health, 119 (6), 518-24.
Escalante, Y., Backx, K., & Saavedra, J. M. (2014). Relationship between break-time physical activity, age, and sex in a rural primary schools, Wales, UK. Journal of Human Kinetics, 40, 227-34.
Page 37
Fedewa, A. L. & Ahn, S. (2011). The effects of physical activity and physical fitness on
children’s achievement and cognitive outcomes: a meta-analysis. Research Quarterly for Exercise and Sport, 82(3), 521-35.
Herman, K. M., Hopman, W. M., & Sabiston, C. M. (2015). Physical activity, screen time and self-rated health and mental health in Canadian adolescents. Preventative Medicine, 73,
112-6.
Herrick, H., Thompson, H., Kinder, J., & Madsen, K. A. use of SPARK to promote after-school physical activity. Journal of School Health, 82 (10), 457-61.
Hood, N. E., Colabinachi, N., Terry-McElrath, Y. M., O’Malley, P. M., & Johnston, L. D. (2014). Physical activity breaks and facilities in US secondary schools. The Journal of School Health, 84 (11), 697-705.
Howe, C. A., Harris, R. A., & Gutin, B. (2011). A 10-month physical activity intervention improves body composition in young black boys. Journal of Obesity.
Hyndman, B. P., Benson, A. C., Ullah, S., Finch, C. F., & Telford, A. (2014). Children’s enjoyment of play during school lunchtime breaks: an examination of intraday and interday reliability. Journal of Physical Activity and Health, 11(1), 109-17.
Hyndman, B. P., Benson, A. C., Ullah, S., & Telford, A. (2014). Evaluating the effects of the Lunchtime Enjoyment Activity and Play (LEAP) school playground intervention on children’s quality of life, enjoyment and participation in physical activity. Biomedical Central Public Health, 14 (164).
Janssen I. & Leblanc, A. G. (2010). Systematic review of the health benefits of physical activity and fitness in school-aged children and youth. The International Journal of Behavioral Nutrition and Physical Activity, 7(40).
Jette, M., Sidney, K., & Blumchen, G. (1990). Metabolic equivalents (METS) in exercise testing, exercise prescription, and evaluation of functional capacity. Clinical Cardiology, 13(8),
555-65.
Page 38
Kremer, P., Elshaug, C., Leslie, E., Toumbourou, J. W., Patton, G. C., & Williams, J. (2014). Physical activity, leisure-time screen use and depression among children and young adolescents. Journal of Science and Medicine in Sport, 17 (2), 183-7.
Lam, J. W., Sit, C. H., & Cerin, E. (2010). Physical activity and sedentary behaviours in Hong Kong primary school children: prevalence and gender differences. Preventative
Medicine, 51(1), 96-7.
Larouche, R., Sauders, T. J., Faulkner, G., Colley, R., & Tremblay, M. (2014). Associations between active school transport and physical activity, body composition, and
cardiovascular fitness: a systematic review of 68 studies. Journal of Physical Activity and Health, 11 (1), 206-27.
Lee, P. H. (2014). Association between adolescents’ physical activity and sedentary behaviors with change in BMI and risk of type 2 diabetes. PLoS One, 9 (10).
Li, X. H., Lin, S., Guo, H., Huang, Y., Wu, L., Zhang, Z., Ma, J., & Wang, H. J. (2014). Effectiveness of a school-based physical activity intervention on obesity in school children: a nonrandomized controlled trial. Biomedical Central Public Health, 14.
Lin, C. Y., Yang, A. L., & Su, C. T. (2013). Objective measurement of weekly physical activity and sensory modulation problems in children with attention deficit hyperactivity disorder.
Research in Developmental Disabilities, 34(10), 3477-86.l
Long, M. W., Sobol, A. M., Cradock, A. L., Subramanian, S. V., Blendon, R. J., & Gortmaker, S. L. (2013). School-day and overall physical activity among youth. American Journal of Preventative Medicine, 45(2), 150-7.
Loprinzi, P. D., Cardinal, B. J., Loprinzi, K. L., & Lee, H. (2012). Benefits and environmental determinants of physical activity in children and adolescents. Obesity Facts, 5(4), 597-610.
Macdonald, H. M., Kontulainen, S. A., Khan, K. M., McKay, H. A. (2007). Is a school-based physical activity intervention effective for increasing tibial bone strength in boys and girls? Journal of Bone and Mineral Research, 22 (3), 434-46.
Page 39
Nettlefold, L., McKay, H. A., Warburton, D. E., McGuire, K. A., Bredin, S. S., & Naylor, P. J. (2011). The challenge of low physical activity during the school day: at recess, lunch and in physical education. British Journal of Sports Medicine, 45(10), 813-9.
Oreskovic, N. M., Blossom, J., Robinson, A. I., Chen, M. L., Uscanga, D. K., & Mendoza, J. A. (2014). The influence of the built environment on outcomes from a “walking school bus study”: a cross-sectional analysis using geographical information systems. Geospatial Health, 9 (1), 37-44.
Ostergaard, L., Kolle, E., Steene-Johannessen, J., Anderssen, S. A., & Andersen, L. B. (2013). Cross sectional analysis of the association between mode of school transportation and physical fitness in children and adolescents. International Journal of Behavior Nutrition and Physical Actiity, 10 (91).
Pearson, N., Braithwaite, R., & Biddle, S. J. (2015). The effectiveness of interventions to increase physical activity among adolescent girls: a meta-analysis. Academy of Pediatrics, 15 (1), 9-18.
Peirson, L., Fitzpatrick-Lewis, D., Morrison, K., Warrren, R., Usman Ali, M., & Raina, P. (2015). Treatment of overweight and obesity in children and youth: a systematic review and meta-analysis. CMAJ Open, (3 (1), 35-46.
Perez-Rodriguez, M., Melendez, F., Nieto, C., Aranda, M., & Pfeffer, F. (2012). Dietary and physical activity/inactivity factors associated with obesity in school-aged children.
Advances in Nutrition, 3(4), 622S-628S.
Peykari, N., Eftekhari, M. B., Tehrani, F. R., Afzali, H. M., Hejazi, F., Atoofi, M. K, Qorbani, M., Asayesh, H., & Djalalinia, S. (2015). Promoting physical activity participation among adolescents: the barriers and the suggestions. International Journal of Preventative Medicine, 6 (12).
Rezende, L. F., Lopes, M. R., Rey-Lopez, J. P., Matsudo, V. K., & Luiz, O. C. (2014). Sedentary behavior and health outcomes: an overview of systematic reviews. PLoS One. 9 (8).
Ridgers, N. D., Timperio, A., Crawford, D., & Salmon, J. (2013). What factors are associated with adolescents’ school break time physical activity and sedentary time? Plos One, 8(2).
Sacchetti, R., Ceciliani, A., Garulli, A., Dallolio, L., Beltrami, P., & Leoni, E. (2013). Effects of a 2-year school-based intervention of enhanced physical education in the primary school.
Page 40
Sandercock, G. R. & Ogunleye, A. A. (2013). Independence of physical activity and screen time as predictors of cardiorespiratory fitness in youth. Pediatric Research, 73 (5), 692-7.
SAS Institute Inc., (2002-2004) SAS 9.1.3 Help and Documentation, Cary, NC: SAS Institute Inc.
Seo, D. C., King, M. H., Kim, N., Sovinski, D., Meade, R., & Lederer, A. M. (2013). Predictors for moderate- and vigorous-intensity physical activity during an 18-month coordinated school health intervention. Preventative Medicine, 57(5), 466-70.
Sit, C. H., McKenzie, T. L., Cerin, E., McManus, A., & Lian, J. (2013). Physical activity for children in special school environment. Hong Kong Medical Journal, 4, 42-2.
Siwik, V., Kutob, R., Ritenbaugh, C., Cruz, L., Senf, J., Aickin, M., Going, S., & Shatte, A. (2013). Intervention in overweight children improves body mass index (BMI) and physical activity. Journal of the American Board of Family Medicine, 26(2), 126-37.
Slater, S. J., Ewing, R., Powell, L. M., Chaloupka, F. J., Johnston, L. D., O’Malley, P. M.
(2010). The association between community physical activity settings and youth physical activity, obesity, and bmi. The Journal of Adolescent Health, 47 (5). 496-503.
Sothern, M. S., Loftin, M., Suskind, R. M., Udall, J. N., & Blecker, U. (1998). The health benefits of physical activity in children and adolescents: implications for chronic disease prevention. European Journal of Pediatrics, 158 (4), 271-4.
Sutherland, R., Campbell, E., Lubans, D. R., Morgan, P. J., Okely, A. D., Nathan, N., Gilham, K., Lecathelinais, C., & Wiggers, J. (2014). Physical education in secondary schools located in low-income communities: physical activity levels, lesson context and teacher interaction. Journal of Science and Medicine in Sport.
Tremblay, M. S., LeBlanc, A. G., Kho, M. E., Saunders, T. J., Larouche, R., Colley, R. C., Goldfield, G., & Gorber, S. C. (2011). Systematic review of sedentary behavior and health indicators in school-aged children and youth. International Journal of Behavior, Nutrition, and Physical Activity, 8, (98).
Trinh, A., Campbell, M., Ukoumunne, O. C., Gerner, B., & Wake, M. (2013). Physical activity and 3-year BMI change in overweight and obese children. Pediatrics, 131(2), 470-7.
Page 41
2008 Physical Activity Guidelines. Retrieved from
http://www.health.gov/paguidelines/guidelines/appendix1.aspx
Vericker, T. C. (2014). Children’s school-related food and physical activity behaviors are associated with body mass index. Journal of the Academy of Nutrition and Dietetics, 114(2), 250-6.
Wang, H., Fu, J., Lu, Q., Tao, F., & Hao, J. (2014). Physical activity, body mass index and mental health in Chinese adolescents: a population based study. Journal of Sports Medicine and Physical Fitness, 54 (4), 518-25.
World Health Organization. (2015). Physical Activity Fact Sheet. Retrieved from http://www.who.int/mediacentre/factsheets/fs385/en/
Yildirim, M., Arundell, L., Cerin, E., Carson, V., Brown, H., Crawford, D., Hesketh, K. D., Ridgers, N. D., Te Velde, S. J., Chinapaw, M. J., & Salmon, J. (2014). What helps children to move more at school recess and lunchtime? Mid-intervention results from Transform-Us! cluster-randomised controlled trial. British Journal of Sports Medicine, 48(3), 271-7.