Georgia State University
ScholarWorks @ Georgia State University
Public Health Theses School of Public Health
Summer 8-11-2015
A Comparative Analysis of State School Food
Preparation Practices in NJ, GA & KY, 2006 - 2012
Shanice BattleFollow this and additional works at:https://scholarworks.gsu.edu/iph_theses
This Thesis is brought to you for free and open access by the School of Public Health at ScholarWorks @ Georgia State University. It has been accepted for inclusion in Public Health Theses by an authorized administrator of ScholarWorks @ Georgia State University. For more information, please contact Recommended Citation
Battle, Shanice, "A Comparative Analysis of State School Food Preparation Practices in NJ, GA & KY, 2006 - 2012." Thesis, Georgia State University, 2015.
ABSTRACT
A Comparative Analysis of State School Food Preparation Practices in NJ, GA & KY, 2006 - 2012
By Shanice Battle
Background: Over the past decade, the U.S. has struggled to effectively address the childhood obesity epidemic. Healthy eating is paramount to child health, especially in terms of obesity prevention. The rate of obese adolescents in grades 9-12 between 2005 and 2013 remained about the same in Georgia, decreased in New Jersey, and increased in Kentucky. It is possible that school meals could be different amongst these states.
Methods: This study analyzed changes and differences in school food preparation practices between 3 selected states. These regions were chosen based on their relatively low (New Jersey), intermediate (Georgia), and high (Kentucky) obesity rates. Both SHPPS 2006 and 2012 nutrition services data was chosen for this analysis to look at changes in school food preparation practices in each state and in the overall sample over time using independent samples t-tests and one way ANOVA.
Results: Overall, statistically significant changes (p<.05) in food preparation practices were observed in seven out of 22 food preparation practice variables between 2006 and 2012. New Jersey and Georgia improved their food preparation practices between 2006 and 2012 while Kentucky improved in some areas and worsened in others. Between states comparisons showed Kentucky had several practices different from New Jersey and Georgia in 2006 but by 2012 there were very few differences between states.
A Comparative Analysis of School Food Preparation Practices in New Jersey, Georgia and Kentucky 2006-2012
by
Shanice D. Battle
B.S., Virginia Commonwealth University
A Thesis Submitted to the Graduate Faculty of Georgia State University in Partial Fulfillment
of the
Requirements for the Degree
MASTER OF PUBLIC HEALTH
APPROVAL PAGE
A Comparative Analysis of State School Food Preparation Practices in New Jersey, Georgia and Kentucky, 2006-2012
by
Shanice Battle
Approved:
___ Dr. Ike Okosun - Committee Chair
__Dr. Rodney Lyn - Committee Member
Author’s Statement Page
In presenting this thesis as a partial fulfillment of the requirements for an advanced degree from Georgia State University, I agree that the Library of the University shall make it available for inspection and circulation in accordance with its regulations governing materials of this type. I agree that permission to quote from, to copy from, or to publish this thesis may be granted by the author or, in his/her absence, by the professor under whose direction it was written, or in his/her absence, by the Associate Dean, School of Public Health. Such quoting, copying, or publishing must be solely for scholarly purposes and will not involve potential financial gain. It is understood that any copying from or publication of this dissertation which involves potential financial gain will not be allowed without written permission of the author.
____________________________________ Shanice D. Battle
TABLE OF CONTENTS
LIST OF TABLES………..………...07
LIST OF FIGURES………...08
INTRODUCTION...09
1.1 Background……….……….………... 09
1.2 Research Aims………...………...………..10
REVIEW OF THE LITERATURE...10
2.1 Childhood Obesity in the U.S.………..………...…….10
2.2 The Cost of Childhood Obesity……….….12
2.3 Childhood Obesity in Selected States...………...………...…13
2.4 Risk Factors for Childhood Obesity in School Environment………...14
2.5 The National Student Lunch Program………....15
2.6 School Food Preparation Practices...18
METHODS…...………... 19
3.1 Sample……….19
3.2 State Selection………...………..………..………..20
3.3 Variables of Interest…………...23
3.4 Response Rate……….24
3.4 Data Analysis...24
RESULTS...25
4.1 Differences in School Food Preparation Practices Overall 2006-2012………...25
4.2 Differences in School Food Preparation Practices: State Specific...25
4.3 Differences in School Food Preparation Practices: Between States………...26
DISCUSSION... 33
5.1 Discussion of Findings………...33
5.2 Policy and Practice Implications……….37
5.3 Limitations………..38
5.4 Conclusions……...39
REFERENCES...40
List of Tables
Table 1. District School Food Preparation Practices in NJ, GA, and KY, 2006 versus 2012. Table 2. District School Food Preparation Practices in NJ 2006 versus 2012.
List of Figures
Introduction
1.1 Background
Childhood obesity is a complex health issue caused by an amalgamation of several social
and biological factors. Based on an analysis of National Health and Nutrition Examination
Survey surveillance data by Ogden and colleagues (2014) about 32% of U.S. children ages 2-19
are obese or overweight with about 17% (12.7 million) being obese. Current rates are 3 times as
high as they were in 1980 (Story, Kaphingst & French, 2006). Childhood obesity is a major
component of the obesity epidemic that presents two main public health concerns. Children who
are obese have several health risks and consequences and these children have higher chances of
adulthood obesity.
Hence, the U.S. has struggled to effectively address the childhood obesity epidemic as
American children and adolescents have suffered from the health consequences of obesity at
increased rates over the past decade. While some states have seen reductions in overall
adolescent overweight and obesity rates others have remained at an intermediate or increasingly
high rate of adolescent obesity. For example, the rate of obese adolescents in grades 9-12
between 2005 and 2013 remained about the same in Georgia, decreased in New Jersey, and
increased in Kentucky. While many factors may be attributing to these differences, it is possible
that the school meal preparation differs amongst these states.
Healthy eating is paramount to child health, especially in terms of obesity prevention.
Children with a healthy diet are less likely to become obese and are consequently less likely to
develop diabetes, cardiovascular disease and cancer. The school environment is especially
important in terms of combating the adolescent obesity epidemic in this country. Over 31 million
(Cullen, Chen, Dave, & Jensen, 2015). Also, it is estimated that children consume anywhere
from 19-50% of their daily food at school (Story et al, 2006) provided through the National
Student Lunch Program (NSLP) and School Breakfast Program (SBP). This places large
responsibility on the NSLP to ensure children are served nutritious food in schools by utilizing
healthy school food preparation practices. The NSLP and SBP nutrition policies have been
revised several times in the past 50 years. Each revision was made out of increasing
consciousness of how school food impacts adolescent health.
1.2 Research Aims
To date, no studies have directly evaluated the differences in school food preparation
practices between states with variances in adolescent obesity. This study will analyze changes in
school food preparation practices between 3 selected states. These regions were chosen based on
their relatively low (New Jersey), intermediate (Georgia) and high (Kentucky) rates of
adolescent obesity. Practices in 2006 will be compared to 2012 within each state to identify any
changes that may indicate more or less obesogenic school food preparation practices. In addition,
there will be a side-by-side comparison of each state’s school food preparation practices within
each year to understand differences that exist as a result of their differences in the utilization of
unhealthy practices.
Literature Review
2.1 Childhood Obesity in the U.S.
Overweight and/or obese status is determined using body mass index (BMI) guidelines
set by the Center for Disease Control and Prevention (CDC, 2015). Children who are overweight
fall in the 85th BMI percentile and obese children fall in the 95th BMI percentile. In an analysis
childhood obesity rates for ages 2-19 were 17.1% and 16.9%, respectively. Amongst adolescents
ages 12-19 the obesity rate was 17.4% in 2003-2004 and 20.5% in 2012. The overall
2011-2012 statistics show no significant decrease in the obesity prevalence.
Adolescents who struggle with attaining a healthy weight experience immediate and long
term consequences if the struggle persists. According to the CDC (2015), obesity is a risk factor
for high blood pressure, high cholesterol, gastro-esophageal reflux and joint problems, which all
can lead to more serious conditions such as cardiovascular disease and Type 2 Diabetes if left
unresolved. Childhood obesity can also be associated with depression, low self-esteem and lack
of social health (CDC, 2015). According to the CDC, recent study results showed at least one
cardiovascular disease risk factor such as high blood pressure or high cholesterol in 70% of
obese children while 39% had at least two (CDC, 2012). Obese children are also at increased risk
for the development of type 2 diabetes. In addition, the impact of obesity on the adolescent body
can lead to joint issues, muscoskeletal discomfort, heartburn, sleep apnea, and asthma (CDC,
2012). Previous studies have shown a predictive association between adolescent and adulthood
obesity. The US National Longitudinal Study of Adolescent Health (Add Health)
(The, Suchindran, North, Popkin & Gordon-Larsen, 2010) followed a cohort of individuals from
1996 to 2009 to record incident adulthood severe obesity to determine its relationship with
adolescent weight status. The and colleagues (2010) observed a 7.9% incident adulthood obesity
rate (95% CI, 7.4-8.5%). This group had higher adolescent body mass index (BMI) and were
primarily minority (mainly non-Hispanic black women). In addition, less than 5% of adolescents
who were not obese developed adulthood obesity. This prevalence remained stable after
adolescent obesity rates and health implications of this condition it is imperative to continue to
address every aspect of the current hindrances to obesity rate reduction.
2.2 The Cost of Childhood Obesity
The economic burden of childhood obesity characterizes this epidemic as one we cannot
afford to ignore. Using data from the Medical Expenditure Panel Survey, Trasande and
Chatterjee (2009) compared health care utilization, outpatient visit expenditures, prescription
drug expenditures and emergency room expenditures between obese/overweight and
normal/underweight adolescents age 6-19 years old over a two-year period. Over 40% of the
sample were children who were either obese both years, overweight both years or obese 1 year
and overweight the other. Compared to normal/underweight children, the children who were
obese both years or obese one year and overweight for the other had combined 45.3% higher
outpatient visit expenditures, 54.5% prescription drug expenditures and 29.5% higher emergency
room expenditures. The overall additional medical cost for overweight and obese children
projected in the U.S. was $14.1 billion.
Trasande and Chatterjee also reviewed differences in health care utilization. 6-19 year old
obese subjects had 38.3% more outpatient appointments and 29.7% more prescriptions than their
normal and underweight counterparts. In another study, overweight and obese children were
found to have a combined additional $74,000 in medical costs for primary care and mental health
visits (Estabrooks & Shetterly, 2007). In addition, the predicted lifetime increased medical costs
for just obese children compared to normal weight children is estimated to be $12,000-$19,000
(Finkelstein, Wan Chen Kang, & Malhotra, 2014). The economic impact of adolescent obesity is
well documented in the literature. With the known economic and racial disparities amongst the
healthcare utilization such as parental time off of work for appointments and transportation
expenses, weight status improvement would not only improve adolescent health but also relieve
a considerable amount of financial burden.
2.3 Childhood Obesity in Selected States
Although there have been adolescent obesity interventions implemented on a national
level the statistics in this population look completely different in each state. The aim of this
analysis is to compare states with childhood obesity rates that are low, intermediate and high
with respect to school food preparation practices. Based on differences in 2013 childhood obesity
rates, New Jersey, Georgia and Kentucky were selected. Although there are states with
adolescent obesity rates lower than New Jersey, The state of New Jersey [Figure 2] has seen
much success in addressing the rate of childhood adolescent obesity. In 2005, the obesity rate for
high school students was 11.3%. In 2011, only 10.0% of adolescents ages 10-17 were obese and
in 2013 only 8.7% of high school students were obese. These statistics have placed New Jersey
in the top 10% of all ranked states for adolescent obesity. New Jersey’s childhood obesity
prevention and reduction initiatives have been advantageous at making their childhood obesity
rates among the lowest in the country.
Georgia [Figure 3] has seen a somewhat moderate level of success in addressing the
obesity epidemic. The high school obesity rate has not changed much, ranging from 12.3% in
2005 to 12.7% in 2013. In 2011, Georgia’s obesity rate for 10-17 year olds was 16.5%. Although
these rates are not among the highest or lowest for adolescents in the U.S. it does not show any
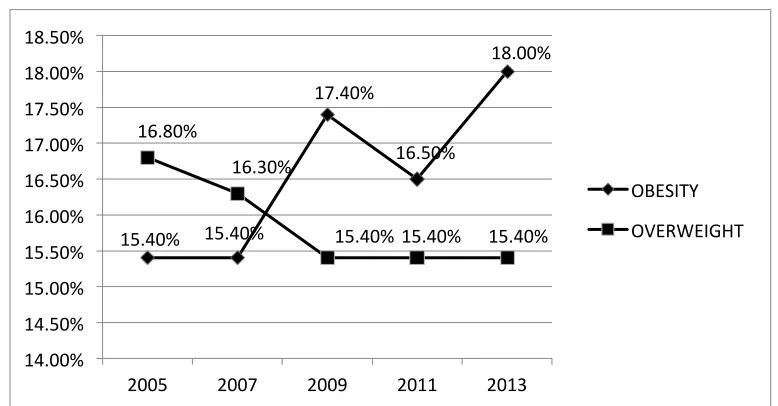
significant decreases. Kentucky, however, is among the states with high rates of adolescent
obesity [Figure 4]. The percentage of adolescent obesity increased from 15.4% in 2005 to 18.0%
school students. In addition, 19.7% of 10-17 year old Kentucky children were found to be obese
in 2011. With efforts to decrease adolescent obesity both nationally and within each state, key
differences in the school food environment are likely.
2.4 Risk Factors for Childhood Obesity in the School Environment
There are several important factors relevant to childhood obesity in the school
environment. First, there is the availability of nutritious foods at school. The United States
Department of Agriculture (USDA) provides guidelines for school breakfast and lunch programs
nationwide. Foods served through this program are to provide a nutritious meal for all students
based on USDA standards and prevent hunger for students at risk (Gunderson, 2003). There are
other foods sold in schools that are not a part of the USDA programs called competitive foods.
These are sold in vending machines, during fundraisers, at school snack bars, in school stores
and as a la carte options in cafeterias (Story et al, 2006). More recently, farm to school and
school garden programs were initiated. Farm to school programs connect schools to locally
grown ingredients and school garden programs allow students to experience planting, nurturing,
harvesting and preparing their own foods (Story et al, 2006).
Second, there are curriculum related factors relevant to childhood obesity in schools.
Obesity is a function of consuming and using calories, and to use enough calories to prevent
obesity an adequate amount of physical activity is necessary (School Health Guidelines to
Promote Healthy Eating and Physical Activity, 2011). Although the Federal government’s daily
recommendation for children and adolescents is at 60 minutes per day, each state has the
authority to set a requirement for a minimum amount of physical activity to ensure each district
meets this standard. In addition, extracurricular sports and activity programs help students
childhood obesity. Teaching students about nutrition, exercise and weight management at early
ages are important investments for healthy weight outcomes throughout life (Story et al, 2006).
Lastly, school health services are related to childhood obesity. Health professionals in
elementary, middle and high schools are useful for routine screenings, disseminating health
information and providing referrals to students who need them. Specifically, monitoring height,
weight and BMI are crucial to characterizing obesity in school environments and assessing the
need for interventions (Story et al, 2006).
2.5 The National Student Lunch Program
This analysis will focus specifically on food offered through USDA programs. The
National School Lunch Program (NSLP) was initiated in 1946 as a way for U.S. schools to
receive financial assistance from the federal government to provide meals to students. In 1966
the Child Nutrition Act established the School Breakfast Program as an addition to the NSLA in
an effort to maximize student health (NSLP, 2014). Since its creation its purpose has expanded,
and school food has the responsibility of concurrently ensuring nutrition is not a barrier to
academic performance, alleviating hunger, reducing waste and mitigating childhood obesity
amongst other roles (Disiena, 2015). There have been several changes to this program that range
from adding food safety regulations to nutrition requirements all with regard to child health.
The Dietary Guidelines for Americans (DGFA) is a 5-year publication beginning in 1980.
The DGFA includes specific recommendations for various aspects of diet such as controlling
weight, which foods to decrease and increase for increased health, establishing beneficial eating
practices and making healthy choices (DGFA, 2005). The Healthy Meals for Healthy Americans
Act of 1994 required schools to meet the Dietary Guidelines for Americans (DGFA) when
result of this act the School Meals Initiative (SMI) became one of the first amendments that set
regulations for nutritional content of school meals for all children over the age of 2. This
initiative recommended schools offer meals with less than 30% of calories from fat and less than
10% from saturated fat. In addition, at least one third of the daily allowances of dietary fiber,
protein, vitamin A, vitamin C, calcium and iron each day during breakfast and lunch. The SMI
also recommends sodium reduction (less than 600 mg for breakfast, less than 800 mg for lunch)
and cholesterol (less than 75mg for breakfast, less than 100mg for lunch) (Abraham et al, 2000).
In 2009, out of growing concern for the quality and quantity of school meals to optimize
child development, the Institute of Medicine (IOM) issued a report outlining recommendations
for changes the USDA should make to the NSLP. The IOM outlined specific alterations such as
increased access to fruits vegetables and whole grains, upper and lower calorie limits for school
meals, and the need for increased focus on reducing saturated fat and reducing sodium. This
report drew the attention of several school food decision makers, beginning with major food
distribution companies. The three main companies serving as food providers for U.S. schools
pledged to meet the IOM’s standards by providing ingredients that met the fat, fruit, vegetable,
sodium and whole grain recommendations (Front Matter, 2010)(IOM, 2013).
Following this declaration the President Obama signed the Healthy Hunger Free Kids Act
of 2010 that required U.S. schools to meet the IOM recommendations by giving the USDA the
opportunity to reform the school lunch and breakfast programs (School Meals, 2015). This was
the first major legal revision of the NSLP since the student meals initiative of 1994. Also in
2010, the first lady launched the Lets Move! initiative that not only promoted increases in
food environments by increasing food quality, partnering with local chefs and placing more salad
bars in schools (Eat Healthy, 2015).
In 2012 the USDA officially released new school meal standards. These guidelines
outlined the required components of school meals specifically focusing on fruits, vegetables,
grains, meat, milk, calories, saturated fat, sodium and trans fat. Each component was described in
terms of portioning by grade level, frequency of offerings (daily, weekly), which meals they
must be a part of (lunch, breakfast) and even which food groups the foods offered must belong
to. In addition, there were strict rules implemented for what types of foods can serve as
substitutions for each category and a plan for monitoring and compliance was discussed in detail
(Nutrition Standards in the National School Lunch and School Breakfast Programs, 2012).
How compliant are schools with set guidelines for meal nutrition? The periodic School
Nutrition Dietary Assessment (SNDA) answers this question by analyzing school meals
offered and served based on the SMI and DGFA. The 2004-2005 fiscal year SNDA found only
19% of schools served meals that met the total fat standard and only 28% of schools met the
saturated fat standard. Gordon and colleagues also found there was an excessive amount of
sodium served in schools meals – zero percent of schools met the sodium standard (the average
sodium content was over 1,300mg per meal). Overall, less than 7% of all schools offered lunches
that met all SMI nutritional content standards. The 2009-2010 SNDA showed some
improvement. Fox and Colleagues (2012) found only 34% of schools met the total fat standard
and 50% met the saturated fat standard. Sodium content was not included in the 2009-2010
report. In addition only 14% of schools offered meals that met all SMI standards. Fat and sodium
in the past decade combined with the current state of the childhood obesity epidemic, further
evaluation of school food is warranted.
2.6 School Food Preparation Practices
The Centers for Disease Control and Prevention conducts the School Health Policies and
Practices Survey (SHPPS) every 6 years since 1994 as a measurement of the 8 components of
school health (Kyle, Brener, Kann, Ross, Roberts, Lachan, Robb & McManus, 2006). These
components - Health education, Physical education and activity, Health services, Mental health
and social services, Nutrition services, Healthy and safe school environment, Faculty and staff
health promotion and Family and community involvement- are measured across private and
public elementary, high, and middle schools at the state, district, and classroom level (Kyle et al,
2006). The aims of the survey are to describe changes in policies and practices over time,
the professionals responsible for implementing these policies and practices, and any collective
efforts amongst staff and with outside institutions to ensure school health (Kyle et al, 2006).
School food preparation practices were analyzed based on SHPPS 2000 data and again
for SHPPS 2006. Based on the results of the SHPPS 2000 analysis only about 36% (8/22) of the
school food preparation techniques to reduce sugar, fat and salt were practiced always or almost
always (Wechsler, Brener, Kuester & Miller, 2001). While the majority of institutions offered a
variety of foods about 30% did not have a daily choice of 2 or more fruits, vegetables or entrees.
In addition, according to Wechsler and colleagues, most milk in schools was high in fat and only
about 20% of schools had both low and skim fat alternatives (2001). The SHPPS 2006 analysis
by O’Toole, Anderson, Miller, and Guthrie (2007) also reviewed all nutrition services in
schools. Most of all school districts (49.1% to 91.4%) always or almost always used techniques
technique (O’Toole et al, 2007). However, when reviewing sugar, fat and salt substitution and
reduction there were some alarming practices directly related to the risk factors and
complications of childhood obesity. An evaluation of the substitution of ingredients showed only
14.3% of school districts exchanged low sodium canned vegetables over regular vegetables and
only 32.5% of U.S. school districts substituted salt in recipes. In addition, less than 30% of all
districts used each method of fat, salt or sugar reduction always or almost always. These analyses
were done as overall assessments of practices in the U.S. and no state comparisons were made.
These results illustrate the need for a review of district school food preparation practices
in each state for two main reasons. First, although almost half of schools had satisfactory meat
and vegetable practices it would be valuable to know if states with higher and lower childhood
obesity rates differ in these categories. Second, salt, sugar and fat are of major concern in
relation to adolescent obesity. It is crucial to evaluate if states with lower and higher obesity rates
have healthier or unhealthier reduction and substitution techniques. As obesity rates follow
alarmingly different trends in each state and school meals provide a substantial portion of the
adolescent diet, it is important to investigate the nutritional quality of school food in states that
struggle to address this epidemic and in those that do not. An observation of poor school food
preparation practices in states with higher or lower adolescent obesity will be useful for
justifying further examination of the NSLP and provide support for closer monitoring of school
food preparation policy implementation.
Methods
3.1 Sampling
Data from the SHPPS 2006 and 2012 nutrition services data are chosen for this analysis
over time. District level nutrition services data are selected to compare food preparation practices
between states because this data is not collected at the state level. In SHPPS, a nationally
representative sample of all elementary middle and high schools completed the survey. All
public and private schools in all 50 states and the District of Columbia that receive only funding
from a school board (with limited guidance) are eligible (Kyle et al, 2006). The SHPPS 2006 and
2012 surveys used mostly identical sampling techniques. Using census data, school districts were
first separated into 4 strata by high/low poverty and rural/urban population. They were classified
based on U.S. median percent living below the federal poverty level and U.S. median rural
population. Then, geographic primary sampling units (PSUs) were created based on these strata.
For the 2006 survey, 5520 PSUs were created based off the national sample resulting in 13, 694
total districts (Kyle et al, 2006). From this pool, 820 districts were selected, 104 were determined
to be ineligible after sampling, 722 school districts were surveyed and 538 (74.5%) responded by
completing at least one module of the survey (Kyle et al, 2006). For the 2012 survey, 5407
PSUs were created resulting in 12,784 total districts. From this pool, 1057 districts were selected,
9 were determined to be ineligible after sampling, 1048 school districts were surveyed and 804
(76.7%) responded by completing at least one module of the survey (Brener et al, 2012).
3.2 State Selection
The CDC uses 3 categories to classify states by childhood obesity rate by grouping states
with less than 10%, 10-14%, and 15-19% together based on percentage of high school students
who were obese (Adolescent and School Health, 2014). For the purposes of state selection these
were determined to be low, intermediate and high rate groups. For the analyses, New Jersey,
Georgia and Kentucky were randomly chosen and rates between 2005 and 2013 are graphed
2006 and 2012 SHPPS data collection [Figures 1-3]. This information was obtained from Youth
Risk Behavioral Surveillance System (YRBSS), which was developed in 1991 by the CDC to
monitor the main causes of death and disease incidence among U.S. adolescents in grades 9-12
(CDC, 2013). A total of 89 districts (all from GA, KY and NJ) were selected. 16 districts were
removed because they did not have primary responsibility for preparing food resulting in 73
[image:22.612.115.498.264.463.2]districts (36 from 2006 and 37 from 2012 SHPPS) used for analysis.
Figure 1. Prevalence of Adolescent Obesity and Overweight in New Jersey, 2005-2013
Percentages are based on prevalence of obesity among US high school students. Source: Youth Risk Behavior Surveillance System, CDC.
Figure 2. Prevalence of Adolescent Obesity and Overweight in Georgia, 2005-2013
11.30% 10.20% 11.00%
8.70%
15.20% 14.10% 15.20%
14.00%
0.00% 2.00% 4.00% 6.00% 8.00% 10.00% 12.00% 14.00% 16.00%
2005 2009 2011 2013
OBESITY
OVERWEIGHT
12.30% 13.70% 12.30%
15.00%
12.70% 14.80%
18.00%
14.70% 15.80%
17.10%
0.00% 2.00% 4.00% 6.00% 8.00% 10.00% 12.00% 14.00% 16.00% 18.00% 20.00%
OBESITY
[image:22.612.112.503.507.719.2]Percentages are based on prevalence of obesity among US high school students. Source: Youth Risk Behavior Surveillance System, CDC.
Figure 3. Prevalence of Adolescent Obesity and Overweight in Kentucky, 2005-2013
Percentages are based on prevalence of obesity among US high school students. Source: Youth Risk Behavior Surveillance System, CDC.
Figure 4. Obese Youth Over Time (CDC, 2014)
15.40% 15.40%
17.40%
16.50%
18.00%
16.80%
16.30%
15.40% 15.40% 15.40%
14.00% 14.50% 15.00% 15.50% 16.00% 16.50% 17.00% 17.50% 18.00% 18.50%
2005 2007 2009 2011 2013
OBESITY
[image:23.612.162.485.389.683.2]3.3 Variables of Interest
There are 23 food preparation variables measured in the SHPPS 2006 survey and 25 for
the 2012 survey. These variables are separated into four categories: ingredient
substitution, ingredient reduction, fat reduction during meat preparation and fat reduction during
vegetable preparation. The ingredient substitution questions ask how often oil, meat, salt, canned
vegetables butter, cheese, milk, yogurt, and other dairy products were substituted for healthier
reduced fat options. The ingredient reduction items ask how often sugar fat and salt was reduced
in a school food recipe. The fat reduction questions ask how often meats were roasted, boiled or
baked instead of fried, how often was meat drained by roasting on a rack or manually drained,
and how often fat was trimmed from meat. In addition, there are questions about how often
skinless poultry was used, how often and solid fat was spooned from chilled meats and how
often it was skimmed off warm broth. Finally, the vegetable preparation questions ask how often
potatoes were boiled, mashed or baked instead of fried, how much other vegetables were
steamed and how often they were prepared without the addition of butter margarine, cheese or
cream. All answers are recorded on a likert scale with choices never, rarely, sometimes, and
always or almost always. All questions ask how often each preparation or cooking practice was
used in the past 30 days.
There are some differences in variables measured on the 2006 and 2012 survey. In the
2012 survey, the meat preparation questions have an additional answer to select if
the responding district only uses precooked meat. This answer was coded to missing because
there is no way to assess how the precooked ingredient was prepared. In addition,
the ingredient substitution items on the SHPPS 2012 survey ask how often canned fruits and
in analysis when comparing 2012 practices between states and not when analyzing differences
between 2006 and 2012 practices.
3.4 Response Rate
The SHPP surveys are sent for completion by the staff member who knows the most
about each component (Kyle et al, 2006). For the nutrition services module the respondents had
various titles and not all districts completed the module. Both the 2006 and 2012 food
preparation practices section of the nutrition services questionnaires begin with the question
“Does your district nutrition services program have primary responsibility for cooking foods for
schools in your district, for example in a central kitchen?” (Nutrition Services District
Questionnaire, 2012). A “No” answer to this question instructs the respondent to skip the
nutrition services section. Twenty-two more questions about food preparation practices for a
total of 23 food preparation variables used for analysis follow this. The overall response rate for
the nutrition services module was almost identical for the 2006 (64.5%) (Kyle et al, 2006) and
2012 (63.0%) (Brener et al, 2012) surveys.
3.5 Data Analysis
Independent samples t –tests were used to compare mean responses to food preparation
practices questions between 2006 and 2012 survey years. Independent samples t-tests were also
used to compare mean responses to food preparation practices questions for New Jersey, Georgia
and Kentucky separately between 2006 and 2012. One-way ANOVA tests were used to
compare mean responses in Georgia, Kentucky, and New Jersey to one another for 2006 and
2012. Statistical significance was based on p<.05. For variables with p= .000 the independent
Results
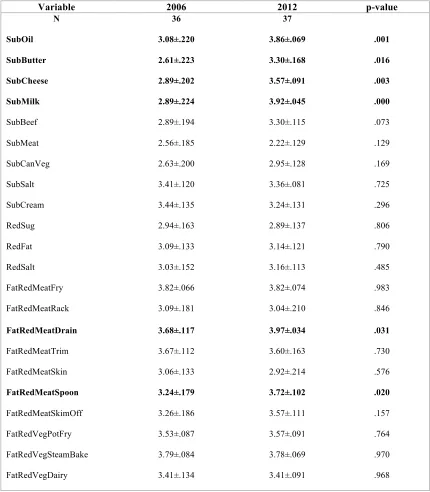
4.1 Differences in Food Preparation Practices: 2006 versus 2012
The 2006 and 2012 SHPPS food preparation practices were compared in the entire
sample. Statistically significant changes (p<.05) in food preparation practices were observed in
seven food preparation practice variables. Results of this independent samples t-test are shown in
[Table 1]. On average, in New Jersey, Georgia and Kentucky used healthier ingredient
substitution practices for grease, oil, butter, shortening, margarine, cheese and whole milk more
often in 2012 than 2006 (based on a statistically significant increased mean). In addition, these
school districts used healthier food preparation practices for meat by roasting, baking, or broiling
it rather than frying, draining fat from browned meat and spooning solid fat from chilled meat or
poultry broth.
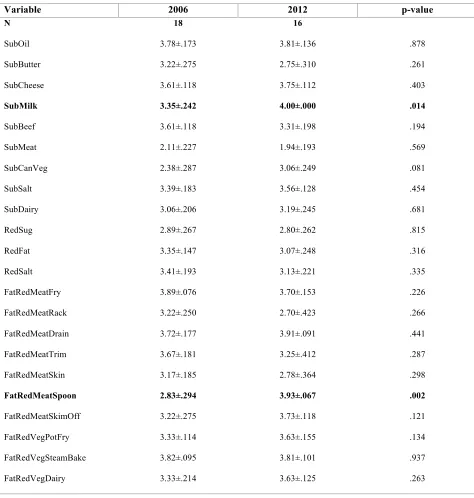
4.2 Differences in Food Preparation Practices: State Specific 2006 versus 2012
Study states showed significant differences in food preparation practices in 2006 versus
2012. In New Jersey, on average, whole milk was substituted more often for healthier low fat
options and food preparation staff reduced fat during meat preparation by spooning off solid fat
from chilled meat or poultry broth. There were no other significant changes in food preparation
practices in the study period as shown in [Table 2]. Georgia also showed few statistically
significant differences in food preparation between 2006 and 2012. On average, the amount of
salt in recipes was reduced or low sodium canned vegetables were used more often in 2012 than
2006 [Table 3].
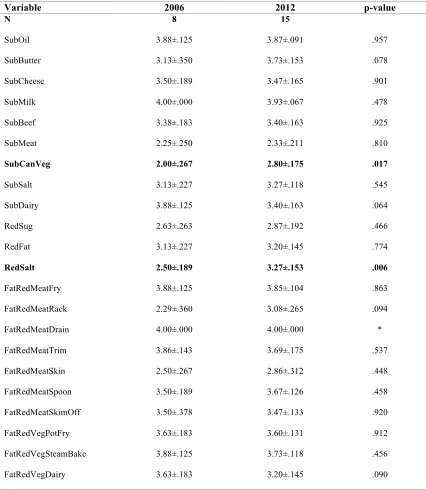
As for the high adolescent obesity state (KY), there were several statistically significant
differences in food preparation practices for the study periods. In 2012, food preparation staff
use of 4 substitution practices [Table 4]. Grease, oil, shortening, butter, margarine, cheese, whole
milk and regular ground beef were all substituted for healthier options more often in 2012 than in
2006. In addition, fat was reduced more often during meat preparation by draining it from
browned meat, trimming or skin removal. Meat, canned vegetables, salt, and mayonnaise were
substituted for healthier options less often in 2012 than in 2006. This was the only state to have a
significant change in vegetable preparation by frying potatoes slightly more frequently.
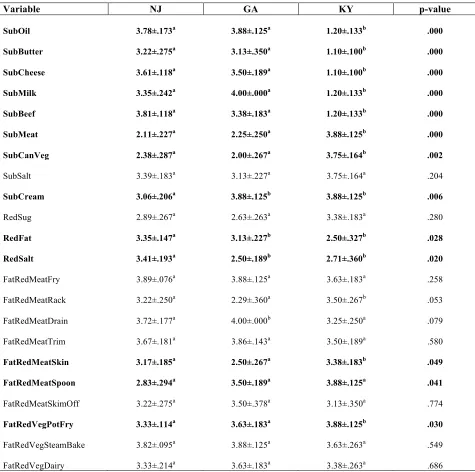
4.3 Differences in Food Preparation Practices: Between States in 2006 and 2012
In 2006 there were several significant differences in food preparation practices between
the three selected states [Table 5]. The average frequency of fat and salt reduction in New Jersey
was significantly different from GA and KY. The mean frequency of mayonnaise substitution in
GA and KY was significantly different from NJ. Lastly, KY had 8 statistically significantly
different ingredient substitution practices than GA and NJ. On average, these KY school districts
substituted oil, butter, cheese, milk, beef, meat and canned vegetables less often than GA or NJ.
KY removed skin from meat during preparation more frequently and fried potatoes less
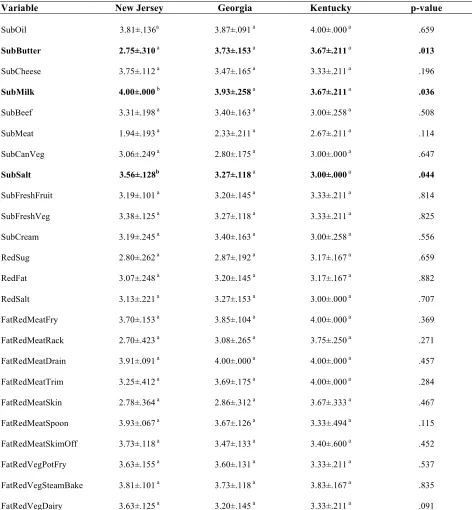
frequently than GA and NJ. In 2012 there were very few statistically significant differences in
food preparation practices between the selected states [Table 6]. NJ substituted whole milk and
Table 1. District School Food Preparation Practices in NJ, GA, and KY, 2006 versus 2012.
Variable 2006 2012 p-value
N 36 37
SubOil 3.08±.220 3.86±.069 .001
SubButter 2.61±.223 3.30±.168 .016
SubCheese 2.89±.202 3.57±.091 .003
SubMilk 2.89±.224 3.92±.045 .000
SubBeef 2.89±.194 3.30±.115 .073
SubMeat 2.56±.185 2.22±.129 .129
SubCanVeg 2.63±.200 2.95±.128 .169
SubSalt 3.41±.120 3.36±.081 .725
SubCream 3.44±.135 3.24±.131 .296
RedSug 2.94±.163 2.89±.137 .806
RedFat 3.09±.133 3.14±.121 .790
RedSalt 3.03±.152 3.16±.113 .485
FatRedMeatFry 3.82±.066 3.82±.074 .983
FatRedMeatRack 3.09±.181 3.04±.210 .846
FatRedMeatDrain 3.68±.117 3.97±.034 .031
FatRedMeatTrim 3.67±.112 3.60±.163 .730
FatRedMeatSkin 3.06±.133 2.92±.214 .576
FatRedMeatSpoon 3.24±.179 3.72±.102 .020
FatRedMeatSkimOff 3.26±.186 3.57±.111 .157
FatRedVegPotFry 3.53±.087 3.57±.091 .764
FatRedVegSteamBake 3.79±.084 3.78±.069 .970
FatRedVegDairy 3.41±.134 3.41±.091 .968
Comparison of mean responses to questions about food preparation practices between 2006 and 2012 in all 3 states. The p-value is from
independent samples t -test (means ± standard errors) differences across the two study time points. Statistically significant differences across the
Table 2. District School Food Preparation Practices in New Jersey in 2006 versus 2012.
Variable 2006 2012 p-value
N 18 16
SubOil 3.78±.173 3.81±.136 .878
SubButter 3.22±.275 2.75±.310 .261
SubCheese 3.61±.118 3.75±.112 .403
SubMilk 3.35±.242 4.00±.000 .014
SubBeef 3.61±.118 3.31±.198 .194
SubMeat 2.11±.227 1.94±.193 .569
SubCanVeg 2.38±.287 3.06±.249 .081
SubSalt 3.39±.183 3.56±.128 .454
SubDairy 3.06±.206 3.19±.245 .681
RedSug 2.89±.267 2.80±.262 .815
RedFat 3.35±.147 3.07±.248 .316
RedSalt 3.41±.193 3.13±.221 .335
FatRedMeatFry 3.89±.076 3.70±.153 .226
FatRedMeatRack 3.22±.250 2.70±.423 .266
FatRedMeatDrain 3.72±.177 3.91±.091 .441
FatRedMeatTrim 3.67±.181 3.25±.412 .287
FatRedMeatSkin 3.17±.185 2.78±.364 .298
FatRedMeatSpoon 2.83±.294 3.93±.067 .002
FatRedMeatSkimOff 3.22±.275 3.73±.118 .121
FatRedVegPotFry 3.33±.114 3.63±.155 .134
FatRedVegSteamBake 3.82±.095 3.81±.101 .937
FatRedVegDairy 3.33±.214 3.63±.125 .263
Comparison of mean responses to questions about food preparation practices between 2006 and 2012 in NJ. The p-value is from independent
samples t -test (means ± standard errors) differences across the two study time points. Statistically significant differences across the two time
Table 3. District School Food Preparation Practices in Georgia in 2006 versus 2012
Variable 2006 2012 p-value
N 8 15
SubOil 3.88±.125 3.87±.091 .957
SubButter 3.13±.350 3.73±.153 .078
SubCheese 3.50±.189 3.47±.165 .901
SubMilk 4.00±.000 3.93±.067 .478
SubBeef 3.38±.183 3.40±.163 .925
SubMeat 2.25±.250 2.33±.211 .810
SubCanVeg 2.00±.267 2.80±.175 .017
SubSalt 3.13±.227 3.27±.118 .545
SubDairy 3.88±.125 3.40±.163 .064
RedSug 2.63±.263 2.87±.192 .466
RedFat 3.13±.227 3.20±.145 .774
RedSalt 2.50±.189 3.27±.153 .006
FatRedMeatFry 3.88±.125 3.85±.104 .863
FatRedMeatRack 2.29±.360 3.08±.265 .094
FatRedMeatDrain 4.00±.000 4.00±.000 *
FatRedMeatTrim 3.86±.143 3.69±.175 .537
FatRedMeatSkin 2.50±.267 2.86±.312 .448
FatRedMeatSpoon 3.50±.189 3.67±.126 .458
FatRedMeatSkimOff 3.50±.378 3.47±.133 .920
FatRedVegPotFry 3.63±.183 3.60±.131 .912
FatRedVegSteamBake 3.88±.125 3.73±.118 .456
FatRedVegDairy 3.63±.183 3.20±.145 .090
Comparison of mean responses to questions about food preparation practices between 2006 and 2012 in GA. The p-value is from independent
samples t -test (means ± standard errors) differences across the two study time points. Statistically significant differences across the two time
Table 4. District School Food Preparation Practices in Kentucky in 2006 versus 2012.
Variable 2006 2012 p – value
N 10 6
SubOil 1.20±.133 4.00±.000 .000
SubButter 1.10±.100 3.67±.211 .000
SubCheese 1.10±.100 3.33±.211 .000
SubMilk 1.20±.133 3.67±.211 .000
SubBeef 1.20±.133 3.00±.258 .000
SubMeat 3.88±.125 2.67±.211 .001
SubCanVeg 3.75±.164 3.00±.000 .002
SubSalt 3.75±.164 3.00±.000 .004
SubDairy 3.88±.125 3.00±.258 .006
RedSug 3.38±.183 3.17±.167 .433
RedFat 2.50±.327 3.17±.167 .128
RedSalt 2.71±.360 3.00±.000 .480
FatRedMeatFry 3.63±.183 4.00±.000 .139
FatRedMeatRack 3.50±.267 3.75±.250 .567
FatRedMeatDrain 3.25±.250 4.00±.000 .040
FatRedMeatTrim 3.50±.189 4.00±.000 .098
FatRedMeatSkin 3.38±.183 3.67±.333 .438
FatRedMeatSpoon 3.88±.125 3.33±.494 .249
FatRedMeatSkimOff 3.13±.350 3.40±.600 .678
FatRedVegPotFry 3.88±.125 3.33±.211 .038
FatRedVegSteamBake 3.63±.263 3.83±.167 .549
FatRedVegDairy 3.38±.263 3.33±.211 .909
Comparison of mean responses to questions about food preparation practices between 2006 and 2012 in KY. The p-value is from independent
samples t -test (means ± standard errors) differences across the two study time points. Statistically significant differences across the two time
Table 5. Differences in food preparation practices in 2006 in NJ, GA and KY.
Variable NJ GA KY p-value
SubOil 3.78±.173a 3.88±.125a 1.20±.133b .000
SubButter 3.22±.275a 3.13±.350a 1.10±.100b .000
SubCheese 3.61±.118a 3.50±.189a 1.10±.100b .000
SubMilk 3.35±.242a 4.00±.000a 1.20±.133b .000
SubBeef 3.81±.118a 3.38±.183a 1.20±.133b .000
SubMeat 2.11±.227a 2.25±.250a 3.88±.125b .000
SubCanVeg 2.38±.287a 2.00±.267a 3.75±.164b .002
SubSalt 3.39±.183a 3.13±.227a 3.75±.164a .204
SubCream 3.06±.206a 3.88±.125b 3.88±.125b .006
RedSug 2.89±.267a 2.63±.263a 3.38±.183a .280
RedFat 3.35±.147a 3.13±.227b 2.50±.327b .028
RedSalt 3.41±.193a 2.50±.189b 2.71±.360b .020
FatRedMeatFry 3.89±.076a 3.88±.125a 3.63±.183a .258
FatRedMeatRack 3.22±.250a 2.29±.360a 3.50±.267b .053
FatRedMeatDrain 3.72±.177a 4.00±.000b 3.25±.250a .079
FatRedMeatTrim 3.67±.181a 3.86±.143a 3.50±.189a .580
FatRedMeatSkin 3.17±.185a 2.50±.267a 3.38±.183b .049
FatRedMeatSpoon 2.83±.294a 3.50±.189a 3.88±.125a .041
FatRedMeatSkimOff 3.22±.275a 3.50±.378a 3.13±.350a .774
FatRedVegPotFry 3.33±.114a 3.63±.183a 3.88±.125b .030
FatRedVegSteamBake 3.82±.095a 3.88±.125a 3.63±.263a .549
FatRedVegDairy 3.33±.214a 3.63±.183a 3.38±.263a .686
Values are mean responses (±standard error) for food preparation practice variables between all states and in 2006 based on one way ANOVA.a
show mean responses with no differences between states in 2006.b show mean responses with differences between states in 2006. Bold text shows
Table 6. Differences in food preparation practices in 2012 in NJ, GA and KY.
Variable New Jersey Georgia Kentucky p-value
SubOil 3.81±.136a 3.87±.091 a 4.00±.000 a .659
SubButter 2.75±.310 a 3.73±.153 a 3.67±.211 a .013
SubCheese 3.75±.112 a 3.47±.165 a 3.33±.211 a .196
SubMilk 4.00±.000 b 3.93±.258 a 3.67±.211 a .036
SubBeef 3.31±.198 a 3.40±.163 a 3.00±.258 a .508
SubMeat 1.94±.193 a 2.33±.211 a 2.67±.211 a .114
SubCanVeg 3.06±.249 a 2.80±.175 a 3.00±.000 a .647
SubSalt 3.56±.128b 3.27±.118 a 3.00±.000 a .044
SubFreshFruit 3.19±.101 a 3.20±.145 a 3.33±.211 a .814
SubFreshVeg 3.38±.125 a 3.27±.118 a 3.33±.211 a .825
SubCream 3.19±.245 a 3.40±.163 a 3.00±.258 a .556
RedSug 2.80±.262 a 2.87±.192 a 3.17±.167 a .659
RedFat 3.07±.248 a 3.20±.145 a 3.17±.167 a .882
RedSalt 3.13±.221 a 3.27±.153 a 3.00±.000 a .707
FatRedMeatFry 3.70±.153 a 3.85±.104 a 4.00±.000 a .369
FatRedMeatRack 2.70±.423 a 3.08±.265 a 3.75±.250 a .271
FatRedMeatDrain 3.91±.091 a 4.00±.000 a 4.00±.000 a .457
FatRedMeatTrim 3.25±.412 a 3.69±.175 a 4.00±.000 a .284
FatRedMeatSkin 2.78±.364 a 2.86±.312 a 3.67±.333 a .467
FatRedMeatSpoon 3.93±.067 a 3.67±.126 a 3.33±.494 a .115
FatRedMeatSkimOff 3.73±.118 a 3.47±.133 a 3.40±.600 a .452
FatRedVegPotFry 3.63±.155 a 3.60±.131 a 3.33±.211 a .537
FatRedVegSteamBake 3.81±.101 a 3.73±.118 a 3.83±.167 a .835
FatRedVegDairy 3.63±.125 a 3.20±.145 a 3.33±.211 a .091
Values are mean responses (±standard error) for food preparation practice variables across all states in 2012 based on one way ANOVA.a show
mean responses with no differences between states in 2012.b show mean responses with differences between states in 2012.Bold text shows
Discussion
5.1 Discussion of Findings
The goal of this study is to determine if there are any differences between states with
varying rates of adolescent obesity due to no known existing analysis of this kind. To fill this gap
in knowledge a comparison of school food preparation practices in New Jersey, Georgia and
Kentucky between 2006 and 2012 was made. Overall, Kentucky had the most significant
changes from 2006-2012. While some food preparation practices improved, this was the only
state to have any negative changes between 2006 and 2012. When comparing 2006 to 2012
Kentucky improved their substitution of oil, butter, cheese and milk. On the contrary, this state
did not improve their meat, canned vegetables, salt and dairy substitution practices. While some
of Kentucky’s practices positively changed during the study period to mirror other states its high
level of obesity shows the need for progress. In Georgia, there were only improvements to
canned vegetable and salt reduction techniques. While most of the means for GA preparation
practices increased they were not significant. As for New Jersey, this state also had only two
significant changes, their mean substitution of milk and removal of fat from warm broth
increased.
This analysis also compared school food preparation practices between states in 2006 and
2012. School food preparation practices between these 3 states were dramatically different in
2006 but became very similar to one another by 2012. It was mainly Kentucky’s food
preparation practices that varied from the rest of the group. New Jersey and Georgia both had
healthier oil, butter, cheese, milk, beef, meat and canned vegetable routines. New Jersey alone
implemented better cream, fat and salt substitution methods in 2006 than Georgia and Kentucky.
observed in Kentucky. By 2012, there were only 2 significant differences between states; New
Jersey had the best milk and salt substitution habits (even though the other states’ means weren’t
very far off).
To date, this is the first analysis of school food preparation practices by state adolescent
obesity trends based on SHPPS data. These results are consistent with the changes to school food
preparation practices observed between 2000 and 2006. A nationwide analysis showed cheese
and salt substitution practices improved. In addition, fat reduction practices (trimming fat from
meat and preparing potatoes without deep-frying) were used more often. These results support an
ongoing trend of improvements to school food preparation practices. These findings are not,
however, consistent with IOM findings as a result of their 2008 evaluation of school lunches.
Two of the main recommendations call for reduced fat consumption; implying student meal
content was still too high. This was an overall analysis to initiate policy reform and did not
include obesity data as a characteristic for comparison or account for specific policy
implementation such as school food preparation practices (The Nutrition Standards, 2008). A
state-by-state analysis with obesity and other population factors included is necessary to further
conceptualize and strengthen the argument that there may be practices unique to low,
intermediate or high adolescent obesity states and internal differences in school nutrition
implementation.
Throughout the analysis there were some themes in observed modifications to school
food preparation practices. Food preparation related to reducing fat consumption by altering
milk, butter, oil and cheese and meat were consistently changed over time and within each state.
Moreover, reducing salt consumption was also a reoccurring observation. These modifications
2004, the Institute of Medicine (IOM) released a report with plans to intervene in the childhood
obesity epidemic by confronting nutrition in schools amongst other factors in society (Krisberg,
2004). Specifically, the IOM cited the need to control the consumption of unhealthy foods in
school environments that are high in fat and salt content. In 2005, IOM recommendations were
announced that continued to pinpoint the need for fat and salt reduction through policy changes
to restrict competitive foods and urged school meals to meet the Dietary Guidelines for
Americans (DGFA). The most recent 2009 recommendations sparked further investigation into
the nutritional quality of NSLP meals. A 2011 survey of meals served in 75 U.S. schools
revealed while most met the cholesterol and calorie limits less than 10 to around 20% of schools
met saturated and trans fat suggestions (Smith and Chezem, 2011) while none of the schools
surveyed met the sodium standard.
The DGFA have served as the underlying nutritional standard for school meals for
several years. The variations in guidelines coinciding with the study period are consistent with
observed alterations to school food preparation practices. The 2005 DGFA suggests reducing
saturated fat intake by consuming low or fat free milk and lean poultry and meat, limiting the
consumption of oils by choosing foods with reduced content and consuming as little trans fat as
possible (USDA, 2005). The recommendations were pushed as 2005-2006 NHANES data
showed cheese as the 2nd highest contributor of dietary saturated fat for Americans ages 2 and
older. Also, 2006 legislation required food labels to indicate trans fat content (USDA, 2010).
According to the 2010 DGFA Americans still struggled with fat consumption; few fat intake
changes were observed from 1990-2006. On the other hand, trans fat consumption was shown to
dietary changes and more specific suggestions such as removing fat from meat during
preparation by trimming or skin removal were added (USDA, 2010).
Salt consumption has been another focus for reduction in the U.S. diet. According to the
2005 DGFA, only 12% of sodium in the U.S. diet is naturally occurring. This guideline suggests
less than 2,300mg per day for people of all ages and proposed reduction during preparation and
not adding salt at the table as the most effective methods. A 2005-2006 analysis of NHANES
data showed children 12-19 consumed 3,000-4,500 mg per day (USDA, 2010). A 2008-2009
analysis showed no improvements in salt consumption among school-aged children and the
highest consumption among high school students (Cogswell et. al. 2014). Since then the
recommendation was updated to 1,500mg per day as of the 2010 DGFA in an effort to reduce
high blood pressure amongst children and adults (USDA, 2010).
Fat and salt are two dietary components that impact multiple health outcomes if
controlled. Reducing fat and salt consumption are associated with reduced risk of obesity, high
blood pressure, atherosclerosis and cardiovascular disease. The replacement of whole and
reduced fat milk with low and skim milk has the potential to significantly reduce saturated fat
intake (Rehm et al, 2015). Salt substitution and reduction combined with increased fruit and
vegetable consumption has the potential to stop hypertension and improve blood pressure control
(Svetkey et al., 2004). In addition, positive association has been shown between salt and sugar
sweetened beverage consumption, which is related to other negative health outcomes (Grimes et
al, 2013). Undeterred by policy recommendations and evidence supporting the multiple benefits
of reducing salt and fat intake, the U.S. diet still has many obstacles to overcome in adopting
5.2 Policy and Practice Implications
The National Student Lunch program has served over 224 billion meals since its creation
and continues to be a major contributor to the adolescent diet (Disiena, 2015). Several changes,
additions, amendments and revisions have been enforced for this program all with the original
purpose of maximizing child health in mind. In reality, creating a perfect NSLP is impossible.
Even if a perfect program was created, perfect implementation is another impediment to ensuring
our nations children only have access to healthy food in schools. There are, however, a few
policy and practice implications for the findings described above.
The overall issue at hand is addressing the barriers to improved school food preparation
practices. More stringent monitoring of districts that fail to utilize healthy food preparation
practices could provide a necessary push to ensuring implementation but also requires the need
for more legislation. A sanction for not meeting USDA standards comes to mind but may
indirectly negatively impact the children the NSLP was created to serve. In addition, many steps
in the process of food preparation could be modified. First, an assessment of resources is
necessary to ensure district facilities, appliances, and foods are not obstacles to healthy
preparation. Second, school food personnel may require additional training to properly utilize
reduction and substitution techniques. Third, instead of relying on school food personnel to
actively reduce and substitute ingredients it may be necessary to only offer and provide food and
recipes that are already low in saturated fat and sodium, for example. This would remove the
room for human error and ensure a certain level of consistency. Fourth, it is understood healthier
practices may require better training, resources and focused intervention that may imply the need
for increased fiscal support for the NSLP. Either way, increased focus on the creation of school
5.4 Limitations
These findings are interpreted in the context of identified methodological limitations.
First, there are several factors that contribute to obesity in the school environment and school
food preparation practices are only a small piece of the overall picture. These results should not
be interpreted as evidence supporting or refuting an association. Second, no matched
demographic data was publicly available on the selected school districts so the results are
presented without accounting for the social, economic and environmental risk factors that could
further characterize each state and their capacity to implement healthy food preparation
practices. Poverty and urbanicity data was available for each district but the sample size was too
small to actually run an analysis based on these variables.
Third, there were an uneven amount of districts from each state included in the analysis.
Combined with the lack of demographic data it is hard to understand how much of the adolescent
population in each state is represented in the selected districts and how much food preparation
practices in these districts reflect the entire state (even though these districts were chosen as part
of a national sample and are presumed to be accurately representative of each state). Fourth,
different personnel answered the SHPP surveys sent to each district. While most (60-80%) of
respondents were food service or child nutrition managers, directors, supervisors, or coordinators
some district surveys were completed by principals or superintendents who may not have been
the most knowledgeable about district food preparation practices over the past 30 days. Fifth,
when reporting practices related to obesity reduction such as school food preparation practices
there may be some response bias given the recent increased cultural awareness and sensitivity to
5.3 Conclusion
Overall, school food preparation practices are different in New Jersey, Georgia and
Kentucky. Since 2006, New Jersey and Georgia have made improvements in school food
preparation practices while Kentucky practices have both improved and worsened. By 2012,
there were very few statistically significant differences in school food preparation practices
between the three states. The state with the highest adolescent obesity rates was the only state to
show declines in the average use of healthier school food preparation practices. Conducting an
overall analysis of all states grouped by adolescent obesity trends could help tease out the true
relationship between school food preparation practices and whether unhealthy practices are more
common in states with certain demographic characteristics. The school food environment has
seen some improvements in school food preparation practices and while some states are
struggling to keep up, others are steadily headed in the right direction. Public health efforts
should seek to address barriers to providing healthy foods in schools for regions that show the
References
Abraham, S., Chattopadhyay, M., Sullivan, C., Mallory, L., Steiger, D. M., Daft, L., & ... Food
and Nutrition Service (USDA), W. D. (2000). The School Meals Initiative
Implementation Study. First Year Report.
Adolescent and School Health: Obesity Youth Over Time. (2014, June 12). Retrieved July 22,
2015, from http://www.cdc.gov/healthyyouth/obesity/obesity-youth-txt.htm
Balaji, A., Brener, N., & McManus, T. (2010). Variation in School Health Policies and Programs
by Demographic Characteristics of US Schools, 2006. Journal Of School Health, 80(12),
599-613. doi:10.1111/j.1746-1561.2010.00547.x
Basics About Childhood Obesity. (n.d.). Retrieved June 15, 2015.
Brener, N., Jones, S., Kann, L., & McManus, T. (2003). Variation in school health policies and
programs by demographic characteristics of US schools. Journal Of School Health, 73(4),
143-149. doi:10.1111/j.1746-1561.2003.tb03592.x
Brener, N., Roberts, A., Trott, J., Lacy, K., Ngaruro, A., Rob, W., & Song, W. (2013). Chapter
2:Methods. In Results from the School Health Policies and Practices Study 2012. Atlanta:
U.S. Department of Health and Human Services Centers for Disease Control and
Prevention.
Brener, N., Wheeler, L., Wolfe, L., Vernon-Smiley, M., & Caldart-Olson, L. (2007). Health
services: results from the School Health Policies and Programs Study 2006. Journal Of
School Health, 77(8), 464-485. doi:10.1111/j.1746-1561.2007.00230.x
Centers for Disease Control and Prevention. Overweight and Obesity, 27 Feb.
2015. Web. 02 June 2015.
Fruit and Vegetable Selection and Consumption in Response to the New National School
Lunch Program Regulations: A Pilot Study. Journal Of The Academy Of Nutrition And
Dietetics, 115(5), 743-750. doi:10.1016/j.jand.2014.10.021
Dietary guidelines for Americans (DGFA) [electronic resource]. (2005). Washington, D.C.: U.S.
Dept. of Health and Human Services : U.S. Dept. of Agriculture.
Disiena, L. (2015). Practice What You Preach: Does the National School Lunch Program Meet
Nutritional Recommendations Set by Other USDA Programs?. Journal Of Law & Health,
28(1), 163-199.
Dor, A., Ferguson, C., Tan, E., Langwith, C. "A Heavy Burden: The Individual Costs of Being
Overweight and Obese in the United States." Sep 21, 2010.
http://publichealth.gwu.edu/departments/healthpolicy/DHP_Publications/pub_uploads/dh
pPublication_35308C47-5056-9D20-3DB157B39AC53093.pdf
Eat Healthy. (n.d.). Retrieved July 19, 2015, from http://www.letsmove.gov/
Estabrooks, P., & Shetterly, S. (2007). The prevalence and health care use of overweight children
in an integrated health care system. Archives Of Pediatrics & Adolescent Medicine,
161(3), 222-227.
Finkelstein, E. A., Wan Chen Kang, G., & Malhotra, R. (2014). Lifetime Direct Medical Costs of
Childhood Obesity. Pediatrics, 133(5), 854-862. doi:10.1542/peds.2014-0063
Fox, M., & Condon, E. (2012). Summary of Findings. In School Nutrition Dietary Assessment
Study IV. Alexandria, VA: U.S. Department of Agriculture, Food and Nutrition Service,
Office of Research and Analysis.
"Front Matter." School Meals: Building Blocks for Healthy Children. Washington, DC: The
Gunderson, G. W. (2003). The national school lunch program: background and development /
by Gordon W. Gunderson. New York : Nova Science Publishers, 2003. Accessed online
at http://www.fns.usda.gov/nslp/history_5 on July 19, 2015.
Gordon, A., Crepinsek, M., Nogales, R., & Condon, E. (2007). School Food Service, School
Food Environment, and Meals Offered and Served. In School Nutrition Dietary
Assessment Study III (Vol. 1). Alexandria, VA: U.S. Department of Agriculture, Food
and Nutrition Service, Office of Research, Nutrition and Analysis.
Kann, L., Telljohann, S., & Wooley, S. (2007). Health education: results from the School Health
Policies and Programs Study 2006. Journal Of School Health, 77(8), 408-434.
doi:10.1111/j.1746-1561.2007.00228.x
Krisberg, K. (2004). Institute of Medicine plan takes on childhood obesity. Nation's Health,
34(9), 1-10.
Koplan, J., Liverman, C., & Kraak, V. (2005). Preventing childhood obesity: health in the
balance. Washington, D.C.; National Academies Press.
Kyle, T., Brener, N., Kann, L., Ross, J., Roberts, A., Iachan, R., & McManus, T. (2007).
Methods: School Health Policies and Programs Study 2006. Journal Of School Health,
77(8), 398-407. doi:10.1111/j.1746-1561.2007.00227.x
Lee, S., Burgeson, C., Fulton, J., & Spain, C. (2007). Physical education and physical activity:
results from the School Health Policies and Programs Study 2006. Journal Of School
Health, 77(8), 435-463. doi:10.1111/j.1746-1561.2007.00229.x
Let's Move. (n.d.). Retrieved July 17, 2015.
National School Lunch Program (NSLP). (2013, December 26). Retrieved July 9, 2015, from
National School Lunch Program (NSLP). (2014, June 17). Retrieved July 17, 2015, from
http://www.fns.usda.gov/nslp/history_6
Nutrition and the Health of Young People. (2014, October 6). Retrieved July 14, 2015, from
http://www.cdc.gov/healthyyouth/nutrition/facts.htm
Nutrition standards in the National School Lunch and School Breakfast Programs. Final rule.
(2012). Federal Register, 77(17), 4088-4167. Retrieved July 17, 2015, from
http://www.fns.usda.gov/sites/default/files/01-26-12_CND.pdf
Ogden, C. L., Carroll, M. D., Kit, B. K., & Flegal, K. M. (2014). Prevalence of Childhood and
Adult Obesity in the United States, 2011-2012. JAMA: Journal Of The American
Medical Association, 311(8), 806-814. doi:10.1001/jama.2014.732
O'Toole, T., Anderson, S., Miller, C., & Guthrie, J. (2007). Nutrition services and foods and
beverages available at school: results from the School Health Policies and Programs
Study 2006. Journal Of School Health, 77(8), 500-521.
doi:10.1111/j.1746-1561.2007.00232.x
Rehm, C. D., Drewnowski, A., & Monsivais, P. (2015). Potential Population-Level Nutritional
Impact of Replacing Whole and Reduced-Fat Milk With Low-Fat and Skim Milk Among
US Children Aged 2--1 9 Years. Journal Of Nutrition Education & Behavior, 47(1),
61-68.
Smith, L., & Chezem, J. (2011). National School Lunch Program - Comparison of Nutrients in
Served Meals with Institute of Medicine Recommendations. Journal Of The American
Dietetic Association, 111(9), A102. doi:10.1016/j.jada.2011.06.381
School Health Guidelines to Promote Healthy Eating and Physical Activity. (2011). MMWR