www.hydrol-earth-syst-sci.net/15/1243/2011/ doi:10.5194/hess-15-1243-2011
© Author(s) 2011. CC Attribution 3.0 License.
Earth System
Sciences
Raising the Dead without a Red Sea-Dead Sea project?
Hydro-economics and governance
D. E. Rosenberg
Department of Civil and Environmental Engineering and Utah Water Research Laboratory, Utah State University, Logan, Utah, USA
Received: 30 November 2010 – Published in Hydrol. Earth Syst. Sci. Discuss.: 21 December 2010 Revised: 11 April 2011 – Accepted: 14 April 2011 – Published: 20 April 2011
Abstract. Seven decades of extractions have dramatically reduced Jordan River flows, lowered the Dead Sea level, opened sink holes, and caused other environmental prob-lems. The fix Jordan, Israel, and the Palestinians propose would build an expensive multipurpose conveyance project from the Red Sea to the Dead Sea that would also gen-erate hydropower and desalinate water. This paper com-pares the Red-Dead project to alternatives that may also raise the Dead Sea level. Hydro-economic model results for the Jordan-Israel-Palestinian inter-tied water systems show two restoration alternatives are more economically viable than the proposed Red-Dead project. Many decentralized new supply, wastewater reuse, conveyance, conservation, and leak reduction projects and programs in each country can together increase economic benefits and reliably deliver up to 900 MCM yr−1 to the Dead Sea. Similarly, a smaller Red-Dead project that only generates hydropower can deliver large flows to the Dead Sea when the sale price of generated electricity is sufficiently high. However, for all restoration options, net benefits fall and water scarcity rises as flows to the Dead Sea increase. This finding suggests (i) each country has no individual incentive to return water to the Dead Sea, and (ii) outside institutions that seek to raise the Dead must also offer countries direct incentives to deliver water to the Sea besides building the countries new infrastructure.
1 Introduction
The Jordan River basin states have long faced water scarcity with plans, proposed allocations, diversions, reservoirs, and treaties to address scarcity dating back a century and longer (Beaumont, 1997; Lowi, 1993; Wolf, 1995). As a result
Correspondence to: D. E. Rosenberg
(david.rosenberg@usu.edu)
just 100 million cubic meters per year (MCM yr−1) of the 1000 + MCM yr−1that historically flowed in the lower Jor-dan River now reach the river’s outlet at the Dead Sea (Beau-mont, 1997; Raz, 2009; Yechieli et al., 1998). The Dead Sea level has fallen – 30 m since 1960 and 1.2 m in 2009 alone – with declines causing land subsidence, sink holes, groundwa-ter contamination, reduced mineral extraction and tourism, plus other problems (Asmar and Ergenzinger, 2002;Glau-siusz, 2010; Lensky et al., 2005; Yechieli et al., 1998; Salameh and El-Naser, 2008).
In response, Jordan, Israel, and the Palestinians seek to build a 180 km conveyance project from the Red Sea at Aqaba north to the Dead Sea (Glausiusz, 2010; Hussein, 2007). This Red-Dead project would use a 400 m elevation drop to generate hydropower, desalinate some conveyed wa-ter, dump brine waste into the Dead Sea to restore the lake level, and pump desalinated water 1000 m up to major urban areas in Jordan and possibly Palestine and Israel.
Although estimates exist of Israeli, Jordanian, and Pales-tinian willingness-to-pay to restore the Dead Sea (Becker and Katz, 2009), system-wide benefits and impacts of the Red-Dead project and alternatives have not been quanti-fied (Arbitbol, 2006). Further, the project requires at least $US 5 billion in donor funds (Glausiusz, 2010; Hussein, 2007) and the World Bank is now assessing the project for environmental, social, and economic feasibility (2010). The Bank’s assessment will focus on different Red-Dead project alignments (2010) rather than alternative infrastructure, oper-ations, or governance to “raise the Dead” Sea level. Potential alternatives could include:
– release more freshwater from the Sea of Galilee (Lake Kinneret, Tiberias), dams on the Yarmouk, and other tributaries,
– release more freshwater from the Galilee and substitute foregone water with water desalinated on the Mediter-ranean seacoast, or
– build decentralized new water supply, wastewater treat-ment and reuse projects plus impletreat-ment targeted water conservation and leak reduction programs to allow each country to forgo or substitute use of Jordan River water. Here, I (i) identify hydrologic and economic impacts of the Red-Dead project and alternatives, (ii) quantify impacts among countries and as a function of the flow delivered to the Dead Sea, and (iii) suggest governance for viable ap-proaches. To do this I extend the hydro-economic Water Allocation System (WAS) model for Israel, Palestine, and Jordan (Fisher et al., 2005; Rosenberg et al., 2008) to include and allow return flows from agriculture, brine waste from de-salination, multiple water quality types to meet a minimum in-stream flow requirement, and fixed-increment infrastruc-ture capacity expansions. These extensions represent impor-tant components of the flow balance for the Dead Sea, flow requirements to restore the Dead Sea level, and limits to build large infrastructure such as the Red-Dead project. They are needed to quantify impacts both of restoration alternatives and as a function of flow delivered to the Dead Sea. Sec-tions 2 and 3 overview the hydro-economic modelling ap-proach and describe model extensions. Subsequent sections present updated model data for the three countries, model re-sults, and implications for governance. Section 7 concludes.
2 Hydro-economic modelling approach
Hydro-economic models have seen wide use by academics for over 4 decades (Howe and Linaweaver, 1967; Milliman, 1963; Harou et al., 2009) and are suited to assess local and regional water management activities because they can mathematically integrate into a single coherent framework the spatially distributed and disaggregated hydrologic, engi-neering, economic, environmental, operations, and policy as-pects of complex water systems (Harou et al., 2009). Hydro-logic water balance components such as river flows, evapora-tion, natural groundwater recharge and discharge, and return flows combine with relevant engineered diversions, reser-voirs, pipelines, canals, well fields, desalination, wastewater treatment plants, and other components to form a node-link network. Costs are specified for flows along links or other water provision, treatment, and disposal activities at nodes. Economic demands such as urban, industrial, and agricul-tural uses are located at nodes and described by demand func-tions that express the value or benefits derived from the water volume delivered.
A central hydro-economic model concept is that water de-mands are not fixed delivery requirements but rather func-tions where volumes of water use at different times and places have varying total and marginal economic values (Harou et al., 2009). The model identifies water allocations to nodes and through links that maximize system-wide net benefits with net benefits quantified as the area between the demand and cost curves. Allocations are subject to physical, hydrologic, engineering, operational, and policy constraints and limits.
Models include environmental water uses – such as flow to the Dead Sea – in two ways. Where possible, models quantify environmental demand curves using revealed prefer-ence, travel cost, hedonic pricings, stated preferprefer-ence, or other econometric estimation methods (Young, 2005). Then, they locate demand curves at model nodes like other economic demands. This first approach is often only partial and con-troversial (Becker and Katz, 2009; Young, 2005). A second approach, adopted here, instead specifies environmental wa-ter use as a constraint on flow at a model node or along a link. Then (i) change the constraint level through sensitivity anal-ysis, or (ii) examine the shadow value associated with the constraint to identify the opportunity cost of environmental water(Harou et al., 2009). Shadow values (Lagrange mul-tipliers; dual variables) are model outputs and specify how system-wide net benefits change where the constraint was re-laxed by one unit (such as 1 m3).
This second approach to environmental water use parallels other constraint-based methods to represent operating rules, policies, or proscribe delivery requirements to certain nodes or demand sectors. Thus, the hydro-economic model does not make water policy nor recommend environmental water use levels; rather, it identifies water allocations that perfectly obey imposed policies and environmental uses and reports resulting hydrologic, economic, and other impacts.
3 WAS model and extensions
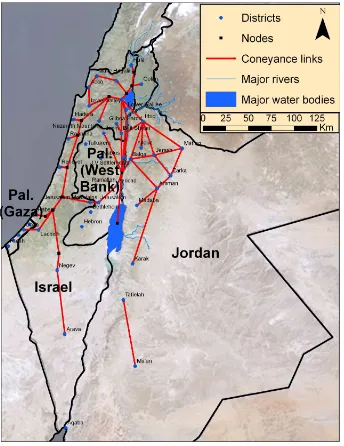
Fig. 1. Schematic of the existing inter-tied water systems for Israel, Palestine, and Jordan used in the extended Water Allocation System model. Urban, industrial, and agricultural water demands are located at districts while nodes represent intermediary points to transfer freshwater, recycled water, or agricultural return flows that are naturally or artificially conveyed along links.
availability event weighted by the event probability (likeli-hood). Expected net benefits include expected benefits from all agricultural, municipal, and industrial water uses mi-nus expected withdrawal, treatment, conveyance, wastewater treatment, and other operational costs and minus one-time capital costs for infrastructure expansions and conservation program developments.
The work here extends the single-year and stochastic versions to include and allow return flows from agricul-ture, brine waste from desalination, multiple water quality types to meet a minimum in-stream flow requirement, and fixed-increment infrastructure capacity expansions. These
extensions represent important components of flow balance for the Dead Sea, flow requirements to restore the Dead Sea level, and limits to build large infrastructure such as the Red-Dead projects. These extensions help assess Dead Sea restoration alternatives, are implemented as one or more new optimization program constraint(s), and are discussed further below.
3.1 Return flows from agriculture
to have no economic value, and is not considered or quan-tified. However, agriculture wastewater is currently a large component of lower Jordan River flows and Dead Sea in-flows. When increasing flow to the Dead Sea in a water scarce region or reallocating water away from agriculture, return flows do have a use and economic value. Thus, it is important to quantify and account for them.
The extended model adds a third water quality type, re-turn flow, to the fresh and recycled water qualities already included. This addition generates a new mass balance con-straint in each district i for the new water quality type qreturn flow:
Water Usei,q =
Local Sourcesi,q +Importsi,q
−Exportsi,q+Reused Wastewateri,q
(1)
· 1−Loss Ratei,q
,∀i,q ∈ return flow. We can then enter data to (i) restrict sectors from using return flows to satisfy economic demands, and (ii) indicate there is no leakage or local sources of this quality type. These conditions reduce Eq. (1) to:
0 =Importsi,q −Exportsi,q +Reused Wastewateri,q
,(2)
∀i,q ∈ return flow.
Here, imports, exports, and reused wastewater are the only active terms in the return flow accounting. The former two terms are included by specifying conveyance links for return flows among districts and nodes; in this case, the districts near or that can deliver return flows to the Jordan Valley and Dead Sea. The latter term is defined by only allowing the agriculture sector to contribute wastewater and specifying a non-consumptive fraction of the original use that becomes available as the return flow. This definition mimics an ex-isting constraint that allows the agricultural sector to reuse treated wastewater from the urban and industrial sectors (for return flows, there is no physical wastewater treatment in-frastructure). I use a non-consumptive fraction of 33% – as suggested by the literature – and test this assumption by comparing computed return flows to the lower Jordan River to observed flows under the existing management regime. Together, the additional constraint, data entry, and parame-ter specification allow us to include and model returns flows from agriculture.
3.2 Brine waste from desalination
Brine waste from desalination is also not included in the single-year and stochastic versions of WAS because the waste is assumed to have no use nor economic value. How-ever, brine waste from the Red-Dead project could be de-livered to Dead Sea and used in lieu of fresh, recycled, or agricultural return flows to raise the Dead Sea level. In this situation, which allowing mixing brine waste with other wa-ter quality types and Dead Sea wawa-ter, brine waste does have
economic value; it is important to include and quantify these effects.
We can further modify constraint Eq. (1) to include the volume of brine waste of water quality type q available at districti:
Water Usei,q =
Local Sources
i,q+Importsi,q+Brine Wastei,q −Exportsi,q+Reused Wastewateri,q
(3)
· 1 −Loss Rateiq,∀i,q,
and define this available volume with a new constraint that ties the brine waste volume to a user-specified fractional amount of the desalinated water produced:
Brine Wastei,q ≤ X
q2∈DQ(q)
Brine Fractioni,q2 · (4)
Desalinated Water Producedi,q2∀i,q. Here, the desalinated water produced is one of several terms embedded in the Local Sources term in Eqs. (1) and (3). The brine fraction is a unitless ratio that represents the volume of brine generated for each 1 m3of desalinated water produced.
DQ(q) is a user-specified set of source water quality types
(q2) that, when desalinated, generate brine quality q. For simplicity, we can lump brine waste and agricultural return flows into one water quality type, return flows. Here, use of brine waste is considered strictly on an additive volume basis and ignores water quality considerations and concerns that may arise when mixing Red Sea desalinated brine waste with Dead Sea water.
Current proposals suggest the Red-Dead project will gen-erate 1 m3of brine waste for each 1 m3of desalinated water produced. I use this brine fraction value and also test the effects of this assumption through sensitivity analysis. 3.3 Multiple water qualities can meet an in-stream flow
requirement
A third extension allows multiple water quality types to, on average, meet a minimum in-stream flow-requirement. The single-year WAS model hard-coded a flow requirement to ensure Israel supplied Gaza with freshwater; Rosenberg et al. (2008) made the requirement general to allow the user to specify a minimum required flow for any qualityqalong any conveyance link from districtito districtj in each stochastic water availability evente:
Conveyance Flowq,i,j,e ≥ minimum required flowq,i,j, (5)
∀q,i,j,e.
X
q∈Q(i,j )
Conveyance Flowq,i,j,e ≥ minimum (6)
required flowi,j,∀i,j,e,
and further, the expected flow to satisfy the minimum flow requirement rather than in each and every event:
X
e
probabilitye · X
q∈Q(i,j )
Conveyance Flowq,i,j,e
(7)
≥ minimum required flowi,j,∀i,j.
In Eqs. (6) and (7), probabilityeis the likelihood that evente will occur andQ(i,j )is a user-specified set of water quality types whose flows can count towards the expected minimum required flow along the link fromitoj. For required deliv-eries to the Dead Sea,Q(i,j )includes all water quality types (fresh, recycled, and return flows).
Equation (6) represents an absolute requirement that must be satisfied in every event while Eq. (7) represents a more re-laxed requirement that need only be satisfied on average. The model user has the choice of which requirement type to ap-ply on each conveyance link. And, as mentioned previously in Sect. 3.2, this addition of multiple water quality types to meet the absolute or expected flow requirement ignores wa-ter quality considerations and concerns that may arise from mixing Red Sea desalinated brine waste with Dead Sea wa-ter.
3.4 Fixed-increment infrastructure expansions
A fourth and final extension adds additional constraints and integer decision variables to limit infrastructure capacity ex-pansion decisions to fixed increments. Prior work allowed continuous expansions of desalination, local source, con-veyance, and wastewater treatment infrastructure up to a maximum capacity (Rosenberg et al., 2008). That approach works when proposed expansions are small and/or capital costs for expansions scale linearly with the expansion size. However, those assumptions do not hold for large capacity expansions such as coastal desalination plants or the Red-Dead project that can only be built in phases, to full capacity, or not at all.
Here, we can use integer decision variables and constraints to limit expansions to fixed increments. For expansion of local sources or desalination facilities, these limits are: Local Source Expansioni,q = Capacity Intervali,q (8)
·LEVELi,q,∀i,q,
where Local Source Expansion is the expansion size (MCM yr−1) for districtiand water quality typeqused else-where in the model, Capacity Interval is the fixed capac-ity expansion interval associated with each expansion level
(MCM yr−1/level), and LEVEL is an integer variable that represents the number of expansions implemented and takes values [0, 1, 2, ...] up to the maximum allowed expan-sion levels. Equation (8) forces Local Source Expanexpan-sion to take step capacities 0, 1×Capacity Interval, 2×Capacity Interval, ..., Maximum Expansion Level×Capacity Inter-val. And when a particular capacity expansion project can only be built to maximum capacity or not built (such as for the Red-Dead project), LEVEL becomes a binary vari-able that takes the values [0, 1]. Including these constraints and decision variables turns the model into a mixed-integer, non linear program (MINLP) that can be formulated and solved in the General Algebraic Modeling System (GAMS) with first CONOPT and then DICOPT (Brooke et al., 1998; Grossmann et al., 2002). This cascade of solvers starts with CONOPT for the relaxed mixed-integer, non linear problem (where interger variables can vary continuously) to ensure the solution is feasible. Subsequently, DICOPT identifies the MINLP solution. While DICOPT can not guarantee a global optimal solution to the MINLP, the cascade of solvers assures the relaxed and MINLP solutions are similar. Notation for the full optimization program, including the objective func-tion, constraints, and decision variables, is available online as Supplemental Material.
4 Model data
The extended WAS model uses supply, conveyance, demand, wastewater treatment, and policy data for Israel, Jordan, and Palestine collected between 1995 and 2003 (Fisher et al., 2005) and updated for Jordan in 2006 (Rosenberg et al., 2008). This section presents updated data for each country, costs for the Red-Dead project, and describes how the three countries’ inter-tied water systems are represented.
4.1 Israel
Since 2003, Israel has embarked on an ambitious program to build seawater desalination plants along its Mediterranean coast (Dreizin, 2006; Dreizin et al., 2008). Currently, 3 plants in Ashkelon, Palmachim, and Hadera are opera-tional with a total capacity of 268 MCM yr−1. New plants at Ashdod and Soreq are under construction and should open in 2012 with additional capacity of 250 MCM yr−1. These plants are modeled with these existing capacities and opera-tional costs ranging from $0.54 to 0.75 m−3. Project tender amounts serve as the upper bound on capital costs to further expand these plant capacities towards Israel’s desalination target of 750 MCM yr−1. Capital costs for these expansion options are included in a scenario that examines new decen-tralized infrastructure expansions and conservation program developments.
surface water sources (to the districts of Golan, Hula, and the Sea of Galilee) are variable with variability characterized by sorting into increasing order the 60-year record of water availability to the Sea of Galilee between 1950 and 2010 (Gi-vati and Rosenfeld, 2007) (availability = stream flow + spring flows + direct rainfall−evaporation; excludes upstream con-sumptive use). I partition the distribution of water availabil-ity into a discrete set of 6 availabilavailabil-ity events whose mass probabilities correspond to the mass probabilities used pre-viously for Jordan (Rosenberg et al., 2008). For each event, I pull the representative availability value from the sorted dis-tribution and divide by the mean observed availability over the 60-year record (443 MCM yr−1). This division gives an event-specific availability factor and allows use of a single-set of water availability events for diverse locations in Jor-dan and Israel that have different probability distributions of water availability. Finally, we multiply source availabilities by event- and source-specific availability factors to estimate source availability in each event.
A constant groundwater availability precludes modeling storage or groundwater banking decisions (that may allow managers to shift water from one water availability event to another) (Rosenberg et al., 2008). However, the limit forces use within groundwater safe yield, ensures a long-term sustainable use of groundwater resources, and counter-acts the practice of groundwater mining (withdrawing above the aquifer safe yield), which is common throughout the re-gion.
4.2 Jordan
Since 2006, Jordan has completed several projects that were previously under study. The Zara-Ma’een project to desali-nate brackish-water now delivers 47.5 MCM yr−1 to Am-man. The Zai pumping plant capacity was doubled and can now convey up to 90 MCM yr−1from Balqa to Amman. An upgraded Al-Samra waste-water treatment plant can now ac-commodate up to 97.5 MCM yr−1of municipal and indus-trial sewage from Amman. This infrastructure is all modeled with these specified existing capacities.
In late 2006, Jordan also completed the Unity Dam on the Yarmouk River. The dam has a total storage capac-ity of 110 MCM and could increase Jordan’s abilcapac-ity to di-vert Yarmouk water from 128 to 208 MCM yr−1. How-ever, the dam has yet to fill and has stored only a paltry 7 to 30 MCM yr−1 (Namrouqa, 2009, 2010). Low storage is likely due to significant upstream abstractions and con-sumptive use by Syria (Rosenberg, 2006) and has prompted Jordan to ask Syria to release water to fill the dam (Nam-rouqa, 2010). Given the dam’s low storage levels and yield to date, the extended model only allows up to 146 MCM yr−1 abstraction from the Yarmouk River as a local supply to Ir-bid.
Finally, the model keeps water efficiency improvements for urban users, leak reduction programs, Disi aquifer and conveyance to Amman and Aqaba, wastewater treatment for Aqaba and Zarqa, and local source developments for Aqaba as potential water conservation programs and infrastructure capacity expansions (Rosenberg et al., 2008). These pro-grams are examined in a scenario that represents new, decen-tralized infrastructure expansions and conservation program developments.
4.3 Palestine
Despite difficult political circumstances, there have been no-table water resources developments in the West Bank and Gaza since 2003 (Fisher et al., 2005). Two small seawa-ter desalination plants with capacities of 1.8 MCM yr−1 op-erate in North Gaza and Dier Al-Balah. Wastewater treat-ment plants operate in the West Bank and Gaza with ca-pacities that range from, respectively, 0.44 to 8.9 and 15 to 40 MCM yr−1. Recent studies by the Palestinian Water Au-thority (PWA) and others call to expand conveyance, desali-nation, and wastewater treatment and reuse in Gaza at capi-tal costs of, respectively, $0.3, $2.7, and $1.2 million/MCM. Although the Palestinian water distribution system has many leaks, the current analysis assumes PWA will reduce physical leakage to 20%.
4.4 Red-Dead project
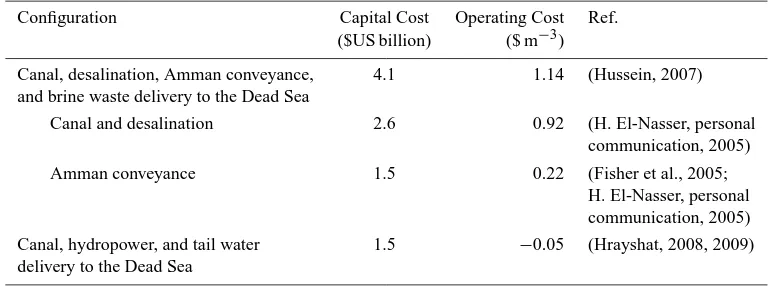
This study locates the Red-Dead project and its conveyance, desalination, and hydropower generation facilities entirely in Jordan. It considers two project configurations and optimisti-cally estimates capital and operating costs from recent news-paper reports and official Jordanian statements (Table 1). Ac-tual costs are likely larger so optimistic estimates provide a lower-bound basis to determine project feasibility. The first Red-Dead project configuration includes the canal, desalina-tion at Balqa (near the Dead Sea), delivery of brine waste to the Dead Sea, conveyance from Balqa to Amman, and rep-resents the current proposal by Jordan, Israel, and the Pales-tinians. A second configuration includes only the canal and hydropower generation at Balqa with tail water delivered to the Dead Sea. Here, operational costs are negative and rep-resents profits of approximately $0.05 per kW-h generated (Hrayshat, 2008, 2009). We test the effect of hydropower operational cost through sensitivity analysis.
4.5 Inter-tied water system
Table 1. Capital and Operating Costs Used to Model Red-Dead Project Configurations.
Configuration Capital Cost Operating Cost Ref. ($US billion) ($ m−3)
Canal, desalination, Amman conveyance, 4.1 1.14 (Hussein, 2007) and brine waste delivery to the Dead Sea
Canal and desalination 2.6 0.92 (H. El-Nasser, personal communication, 2005)
Amman conveyance 1.5 0.22 (Fisher et al., 2005;
H. El-Nasser, personal communication, 2005) Canal, hydropower, and tail water 1.5 −0.05 (Hrayshat, 2008, 2009) delivery to the Dead Sea
Palestine) to the lower Jordan River node, and (d) the Jordan River to the Dead Sea. Third, additional links for return flows at no operational cost were also added from West (Israel) to East Jerusalem (Palestine) and from East Jerusalem (Pales-tine) to Jericho (Pales(Pales-tine). These links all represent con-veyance by gravity flow through existing wadis and channels to the Jordan River and Dead Sea. The new expected min-imum flow requirement presented in Sect. 3.3 was specified along the last link from the Jordan River to the Dead Sea and used to make the hydro-economic analysis.
5 Hydro-economic model results
I ran the extended model for a base case representing ex-isting infrastructure, demands forecast in 2020, fresh and recycled water use, and a Dead Sea flow requirement of 100 MCM yr−1(A1 in Fig. 2). Scenario analysis shows im-pacts when considering agricultural return flows (A2 and A3), return flows with two Red-Dead project configurations (B and C) and with new decentralized water infrastructure plus conservation programs (Figs. 2 to 5 and Table 2). Sen-sitivity analysis shows how scenario net benefits and alloca-tions change when increasing the expected required flow to the Dead Sea – the environmental water use constraint at-tached to the lower Jordan River conveyance link.
System-wide expected net benefits fall and expected costs rise as the required flow to the Dead Sea increases (Fig. 2). Rising expected costs reflect increasing water scarcity and reduced benefits as water is reallocated from agricultural, ur-ban, and industrial water users to the lower Jordan River and Dead Sea. When the existing system (A1, using only fresh and recycled waters) returns approximately 900 MCM yr−1 to the Dead Sea, cost increases surpass a $US 726 mil-lion yr−1 benchmark that represent the non-market bene-fits from restoration measured by prior estimates of Is-raeli, Palestinian, and Jordanian willingness-to-pay (WTP) to restore the Dead Sea (Becker and Katz, 2009). These
non-market WTP benefits include gross profits from Dead Sea mineral extractions, contigent value stated, and travel cost revealed preferences. These WTP benefits are not in-cluded in the extended model, but represent a benchmark against which to compare expected decreases in net bene-fits when a 900 MCM yr−1 threshold flow is achieved that hydrologists and limnologists advise is needed to stabilize the Dead Sea level at−435 m (Yechieli et al., 1998). Model results suggest the existing system (A1) can flexibly reallo-cate and deliver additional water to the Dead Sea but cannot economically meet the 900 MCM yr−1flow threshold.
Agricultural return flows (A2 and A3 in Fig. 2) serve an important economic role to reach downstream environmen-tal objectives. Namely, decreasing the water consumptively used by agricultural and returning larger flows to the lower Jordan River reduces overall expected costs. Still, these cost reductions are not sufficiently large to make achieving the 900 MCM yr−1Dead Sea flow threshold economical.
Expected costs associated with the Red-Dead project (B, configured to desalinate new supply and deliver brine waste to the Dead Sea as currently proposed by Jordan, Israel, and the Palestinians) are lower than the reallocation alter-natives and the WTP benchmark. Interestingly, the pro-gram only finds benefit to build and operate the Red-Dead project when the Jordan River flow requirement is at or above 800 MCM yr−1. However, expected costs are lower still for a smaller Red-Dead project configuration (C) that only gen-erates hydropower and delivers tail water to the Dead Sea or alternative (D) that builds new, decentralized local infras-tructure and conservation programs across the three countries (Fig. 2). These alternatives are more economically viable than the Red-Dead project currently proposed by the three countries.
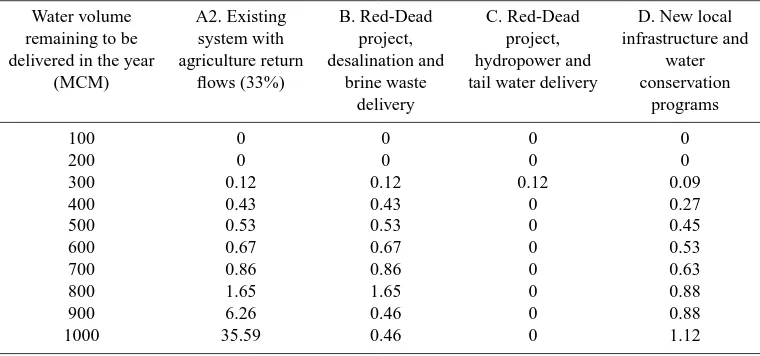
Table 2. Price schedule for Dead Sea water purchases under different infrastructure and program alternatives using WAS model shadow value results ($US per m3).
Water volume A2. Existing B. Red-Dead C. Red-Dead D. New local remaining to be system with project, project, infrastructure and delivered in the year agriculture return desalination and hydropower and water
(MCM) flows (33%) brine waste tail water delivery conservation
delivery programs
100 0 0 0 0
200 0 0 0 0
300 0.12 0.12 0.12 0.09
400 0.43 0.43 0 0.27
500 0.53 0.53 0 0.45
600 0.67 0.67 0 0.53
700 0.86 0.86 0 0.63
800 1.65 1.65 0 0.88
900 6.26 0.46 0 0.88
[image:8.595.48.283.275.473.2]1000 35.59 0.46 0 1.12
Fig. 2. Economic impacts for six restoration alternatives when in-creasing required flow to the Dead Sea. Change on the y-axis is quantified as expected net benefits observed for the base case alter-native A1 that allows reallocations, uses only fresh + recycled wa-ter, and delivers just 100 MCM yr−1flow to the Dead Sea minus expected net benefits for the specified alternative at the specified Dead Sea flow requirement.
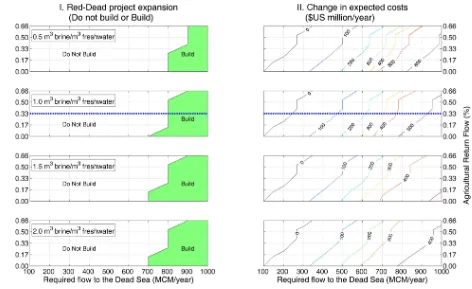
Dead Sea flow requirements with lower expected costs. In contrast, larger brine fractions that produce more brine vol-ume for each 1 m3of desalinated freshwater provide an in-centive to build the project earlier at smaller required flows to the Dead Sea. This result occurs because larger brine frac-tions provide more brine water to meet the Dead Sea flow requirement. Expected costs are the same up until the points where the project is built; at larger required flows to the Dead Sea where the project is built, larger brine fractions lower overall expected costs to meet the required flow. These sen-sitivity results highlight needs to consider agricultural return
flows, brine generation, and other environmental water in-puts when determining new infrastructure and operations to meet downstream environmental flow requirements.
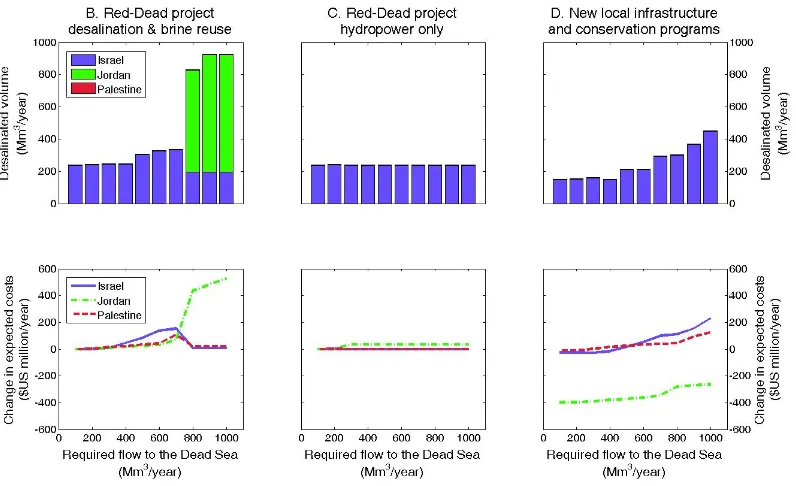
The three viable restoration alternatives identified in Fig. 2 distribute benefits and desalination responsibilities differ-ently among the three countries (Fig. 4). Jordan principally bears costs to operate the Red-Dead project and satisfy larger Dead Sea flow requirements whiles Israel cuts back some Mediterranean coastal desalination (B). With a smaller Red-Dead project that just generates hydropower (C), Jordan still exclusively bears the project costs. Costs, benefits, and de-salination responsibilities switch with a decentralized mix of new local infrastructure and conservation programs (D). Initially, Israel cuts back coastal desalination while expected benefits accrue mostly to Jordan. However, as required flows to the Dead Sea increase, Israel increases coastal desalina-tion and faces increased expected costs. When considering an estimated split in WTP benefits from Dead Sea restoration among Israel, Jordan, and Palestine of $363, $339, and $23 million yr−1, respectively (Becker and Katz, 2009), only the smaller Red-Dead project that just generates hydropower (C) will produce sufficient individual benefits for each country.
6 Implications for governance
Fig. 3. Sensitivity analysis shows how the decision to build the Red-Dead project (I. left panels) and change in expected costs (II. right panels) are influenced by agricultural return flows (y-axes), the brine generation ratio (panel rows), and required flows to the Dead Sea (x-axes). Changes in expected costs (II. right panels) are defined as in Fig. 2. The brine generation ratio is the m3of brine waste generated for each 1 m3of desalinated freshwater produced. Dashed blue lines indicate default agricultural return flow and brine generation parameter values used elsewhere to evaluate Red-Dead project options B and C.
continue should new infrastructure like a Red-Dead project be built.
New infrastructure alone will not raise the Dead Sea level. Third parties and institutions outside the basin – such as the World Bank or environmental groups – that seek to raise the Dead Sea level must also create incentives for coun-tries to deliver water to the Dead Sea. First, outside in-stitutions could offer countries financial incentives such as pay the full capital cost of the Red-Dead project (annualized at $US 330 million yr−1, 5% interest, continuous compound-ing, 20-year project life) to encourage the countries to agree on the water volumes each will deliver to the Dead Sea. Yet even with this incentive, a decentralized mix of new local infrastructure and conservation programs is still a more eco-nomically viable alternative to raise the Dead Sea level. 6.1 Pay countries to deliver water to the Dead Sea
Alternatively, outside institutions could pay countries to de-liver water to the Dead Sea. Model results show that the scarcity value of water is large (Table 2). This scaricty value is the shadow value (Lagrange multiplier) associated with the minimum in-stream flow constraint and describes the
decrease in overall net benefits were the flow requirement raised one unit. Shadow values have units of $/m3 and de-scribe the minimum price a country would require to forgo use of the water and allow the water to flow to the Jordan river. Generally, shadow values rise as the Jordan River flow requirement increases and water becomes more scarce (Ta-ble 2). Exceptions occur (Ta(Ta-ble 2, columns B and C) when increased flow requirements trigger new large infrastructure projects that have substantial capital costs but are not imme-diately operated at full capacity. After the projects are built and as the flow requirement further increases, the shadow value reflects the operational cost to bring online unused ca-pacity. However, in all cases, shadow values are positive and large so countries will prefer to beneficially use the water rather than deliver it to the Jordan River and Dead Sea.
Fig. 4. Country-specific impacts for three more-promising restoration alternatives (B, C, and D). Desalination volumes (top panels) are desalination operations during the most extreme water availability event when surface water flows in Jordan and the Upper Jordan River are, respectively, 48% and 44% of their historical averages. Changes in expected costs (bottom panels) are defined as in Fig. 2.
to purchase water for environmental purposes (Murphy et al., 2009). First, the most effective market will involve a grand coalition of all countries (although one or more coun-tries may only nominally participate) (Fisher and Huber-Lee, 2009). Second, no countries may choose to sell. Although, at some (possibly large) price, a country will find the pay-ment sufficient compensation for the scarcity costs it incurs and sell water. Third, countries could collude to raise prices. While possible, collusion will likely be temporary. As offer prices rise, a country will have a strong incentive to defect and sell. Fourth, the sale price need not stay constant and can vary with environmental, hydrological, and other condi-tions such as the water volume already purchased.
Setting appropriate sale prices is key to establish a success-ful market for environmental purchases. And WAS model shadow values for water to meet the Dead Sea flow constraint (Table 2) can help guide price setting (Fisher and Huber-Lee, 2009; Fisher et al., 2005). These shadow values represent the scarcity value of water and minimum price an outside institution must offer to successfully purchase water from a country. A regressive schedule based on shadow value model results (Table 2) could set prices at or above the shadow value associated with the delivery volume still remaining to meet the annual target.
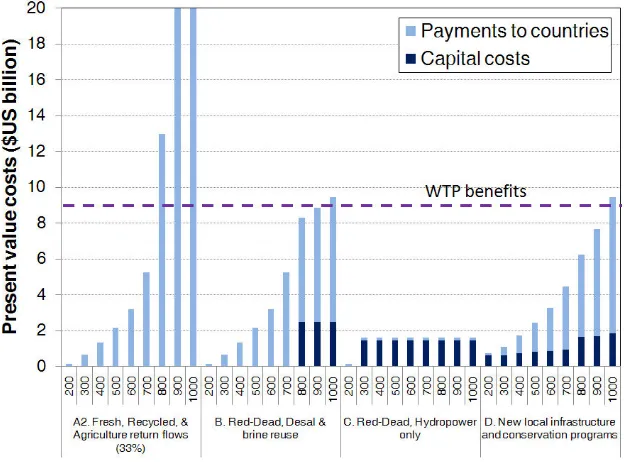
The present values of annual payments to countries to deliver water to the Dead Sea are large and typically ex-ceed capital costs for new infrastructure (Fig. 5). Payments and capital costs under the existing system (A2) exceed the estimated $US 8.9 billion present value of the annual WTP
benchmark that represents benefits to restore the Dead Sea (20 year life, 5% interest, continuous compounding). Lower payments and capital costs for the Red-Dead project pro-posed by the three countries (B) and decentralized mix of new local infrastructure and conservation programs (D) are at or slightly below the WTP benchmark. Costs are lowest for the smaller Red-Dead project configured to only gener-ate hydropower (C) and are principally to build new infras-tructure (canal, turbines, and generators). Here, payments are needed only to purchase flows up to 300 MCM yr−1 be-fore the project is built. Above this level, Jordan builds and profitably generates hydropower at full capacity, the Dead Sea flow constraint does not bind, and the associated shadow value is zero. Although payments to countries significantly raise costs to return flows to the Dead Sea, WTP benefits from restoration often surpass the payments and capital costs. 6.2 Hydropower operating cost sensitivity analysis
Fig. 5. Present value costs for each alternative including capital costs for new infrastructure and programs and payments to countries to deliver the specified flow to the Dead Sea. Payments to countries are based on the shadow value price schedule in Table 2. Payments are compared to the present value of an annual WTP benchmark estimated by Becker and Katz (2009) that represents benefits to restore the Dead Sea.
build the Red-Dead project, but operate the project at less than capacity and only to meet the Dead Sea flow require-ment. There would be a shadow value associated with de-livering water to the Dead Sea and Jordan would likely seek annual payments to deliver the water to the Dead Sea. The present value of these payments would comprise several bil-lion dollars and approach payments associated with other Dead Sea restoration alternatives. These results suggest the economic viability of a smaller Red-Dead project that only generates hydropower is sensitive to the sale price of gen-erated electricity, operations and maintenance costs; these project aspects require further study.
6.3 Limitations
The hydro-economic model is a steady-state model that rep-resents a long-run, future equilibrium. Results focus on the end state but do not describe the dynamic transition from the current to future state (such as when new infrastructure should be built or payments started). Additionally, recom-mended solutions, on average, deliver water to the lower Jor-dan River to meet an expected-value in-stream flow condi-tion, but do so by both surpassing and not reaching the annual target in years with, respectively, high and low (surface) wa-ter availability. Still, deliveries in low availability years far surpass the current paltry 100 MCM yr−1Jordan River flow to the Dead Sea. Such flow variations above and below the required flow are acceptable for resilient environmental sys-tems – such as the lower Jordan River and Dead Sea – where
restoration objectives are largely hydrologic and/or systems do not face (or have already surpassed) ecological thresholds. For threatened systems that face thresholds beyond which re-covery is not possible, absolute minimum flow criteria should instead be implemented. In the Jordan River basin, were an absolute flow criteria instead used, model results (not shown) indicate a much larger need for desalination, higher shadow values, and larger payments to countries to deliver water to the Jordan River.
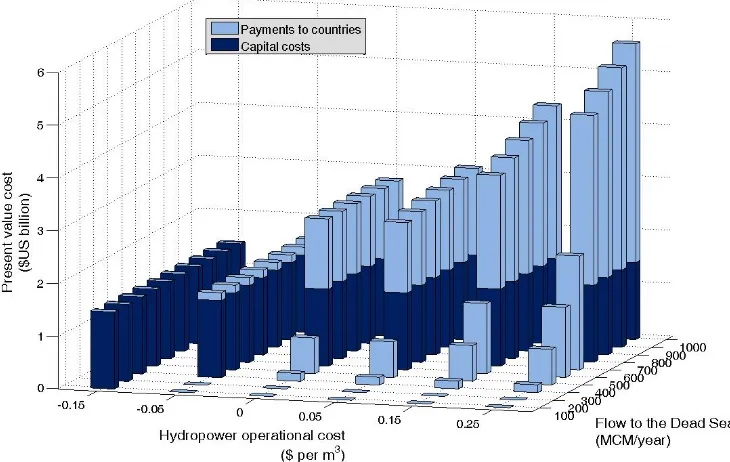
Fig. 6. Present value costs as a function of both the flow delivered to the Dead Sea and the hydropower operational cost for the Red-Dead project configuration that considers only the canal, hydropower generation, and tailwater delivery to the Dead Sea. Hydropower operation costs less than zero represent operational benefits.
7 Conclusions
A declining Dead Sea level and the associated land subsi-dence, sink holes, groundwater contamination, reduced min-eral extraction and tourism, plus other problems, in part, have prompted Israel, Jordan, and the Palestinians to propose the Red-Dead project to raise the Dead Sea level. The project would build a large, expensive canal from the Red Sea to the Dead Sea and also generate hydropower and desalinated wa-ter.
Hydro-economic model results for the three countries’ inter-tied water systems show two Dead Sea restoration al-ternatives – a (i) mix of decentralized new infrastructure and conservation programs in each country, or (ii) smaller Red-Dead project that only generates hydropower – are more eco-nomically viable than the larger Red-Dead project proposed by the three countries. These assessments consider important components of flow balance for the Dead Sea, flow require-ments to restore the Dead Sea level, and limits to build large infrastructure such as the Red-Dead project. Flow balance components such as agricultural return flows and brine waste generation influence the conditions in which new infrastruc-ture (such as the Red-Dead project) should be built and over-all expected costs to meet downstream environmental flow requirements.
Results for all restoration alternatives show rising deliv-eries to the Dead Sea trigger increasing water scarcity and suggest each country has little individual incentive to allow water to flow to the Dead Sea. Beyond new infrastructure,
outside institutions that seek to raise the Dead must also de-velop new governance that provides countries incentives to deliver water to the Dead Sea. One incentive – pay coun-tries to deliver water – ties environmental water purchases to model shadow value results and the scarcity value of water. Payments will substantially raise actual Dead Sea restoration costs above the current estimated $US 5 billion capital costs for the Red-Dead project. Payments for water and new in-frastructure will also change the distribution of water, bene-fits, and costs among the three countries. Although payments are large, restoration benefits measured by willingness-to-pay estimates are larger still and identify several viable ap-proaches to raise the Dead beyond the Red-Dead project pro-posed by the three countries.
Supplementary material related to this article is available online at:
http://www.hydrol-earth-syst-sci.net/15/1243/2011/ hess-15-1243-2011-supplement.pdf.
Acknowledgements. In April 2010, CEE 6490 students used the stochastic version of the WAS model to identify economic impacts from returning an additional 200 MCM yr−1to the Dead Sea. Charles Sims, Mac McKee, Gideon Oron, Richard Peralta, Samer Talozi, and Loay Hidmi gave feedback on earlier drafts.
References
Arbitbol, E.: Giving the Dead Sea a New Life: Have All Options Been Responsibly Considered?, J. Peacebuil. Devel., 3, 94–99, 2006.
Asmar, B. N. and Ergenzinger, P.: Long-term prediction of the wa-ter level and salinity in the Dead Sea, Hydrol. Process., 16, 2819– 2831, doi:10.1002/hyp.1073, 2002.
Beaumont, P.: Dividing the waters of the River Jordan: An analysis of the 1994 Israel-Jordan Peace Treaty, Water Res. Devel., 13, 415–424, 1997.
Becker, N. and Katz, D. L.: An Economic Assessment of Dead Sea Preservation and Restoration, in: The Jordan River and Dead Sea: cooperation amid conflict, edited by: Lipchin, C., San-dler, D., and Cushman, E., Springer, Dordretch, The Netherlands, 275–296, 2009.
Brooke, A., Kendrick, D., Meeraus, A., and Raman, R.: GAMS, a user’s guide, GAMS Development Corporation, Washington, DC, 1998.
Dreizin, Y.: Ashkelon seawater desalination project – off-taker’s self costs, supplied water costs, total costs and benefits, Desali-nation, 190, 104–116, 2006.
Dreizin, Y., Tenne, A., and Hoffman, D.: Integrating large scale seawater desalination plants within Israel’s water supply system, Desalination, 220, 132–149, 2008.
Fisher, F. M. and Huber-Lee, A.: WAS-guided cooperation in water: the grand coalition and sub-coalitions, Environ. Dev. Econ., 14, 89–115, doi:10.1017/s1355770x08004695, 2009.
Fisher, F. M., Huber-Lee, A., Amir, I., Arlosoroff, S., Eckstein, Z., Haddadin, M. J., Hamati, S. G., Jarrar, A. M., Jayyousi, A. F., Shamir, U., and Wesseling, H.: Liquid Assets: An economic ap-proach for water management and conflict resolution in the Mid-dle East and beyond, Resources for the Future, Washington, DC, 242 pp., 2005.
Givati, A. and Rosenfeld, D.: Possible impacts of anthro-pogenic aerosols on water resources of the Jordan River and the Sea of Galilee, Water Resour. Res., 43, W10419, doi:10.1029/2006wr005771, 2007.
Glausiusz, J.: New life for the Dead Sea?, Nature, 464, 1119–1120, 2010.
Grossmann, I. E., Viswanathan, J., Vecchietti, A., Raman, R., and Kalvelagen, E.: DICOPT: A Discrete Continuous Optimization Package, GAMS Development Corporation, Washington, DC, 2002.
Harou, J., Pulido-Velazquez, M., Rosenberg, D. E., Medellin-Azuara, J., Lund, J. R., and Howitt, R. E.: Hydro-economic Models: Concepts, Design, Applications, and Future Prospects, J. Hydrol., 375, 627–643, doi:10.1016/j.jhydrol.2009.06.037, 2009.
Howe, C. W. and Linaweaver, F. P.: Impact of Price on Residen-tial Water Demand and Its Relation to System Design and Price Structure, Water Resour. Res., 3, 13–32, 1967.
Hrayshat, E. S.: Analysis of renewable energy situation in Jordan, Energy Sources Part B-Economics Planning and Policy, 3, 89– 102, doi:10.1080/15567240600815000, 2008.
Hrayshat, E. S.: Prospects of Hydropower Utilization for Electricity Generation in Jordan, Energy Source. Part B, 4, 77–83, 2009. Hussein, M. B.: World Bank invites bids for Red-Dead feasibility
study, Jordan Times, Amman, Jordan, 5 April, 2007.
Lensky, N. G., Dvorkin, Y., Lyakhovsky, V., Gertman, I., and Gavrieli, I.: Water, salt, and energy balances of the Dead Sea, Water Resour. Res., 41, W12418, doi:10.1029/2005wr004084, 2005.
Lowi, M. R.: Water and Power: The politics of a scarce resource in the Jordan River Basin, Cambridge University Press, Cambridge, 291 pp., 1993.
Milliman, J. W.: Policy Horizons for Future Urban Water Supply, Land Econ., 39, 109–132, 1963.
Murphy, J. J., Dinar, A., Howitt, R. E., Rassenti, S. J., Smith, V. L., and Weinberg, M.: The design of water markets when in-stream flows have value, J. Environ. Manage., 90, 1089–1096, doi:10.1016/j.jenvman.2008.04.001, 2009.
Namrouqa, H.: Major dams one-third full after early rains, Jordan Times, Amman, Jordan, 26 November, 2009.
Namrouqa, H.: Jordan does not owe Israel a drop of water, Jordan Times, Amman, Jordan, 2010.
Raz, E.: The Future of the Dead Sea: is the Red Sea-Dead Sea conduit the right solution?, in: The Jordan River and Dead Sea: cooperation amid conflict, edited by: Lipchin, C., Sandler, D., and Cushman, E., Springer, Dordretch, The Netherlands, 189– 212, 2009.
Red Sea-Dead Sea Water Conveyance Study Environmental and So-cial Assessment: Initial Assessment Report, World Bank, 2010. Richards, A. and Singh, N.: No easy exit: Property rights, markets,
and negotiations over water, Int. J. Water Resour. D., 17, 409– 425, 2001.
Rosenberg, D. E.: The Yarmouk River Agreements: Jordan-Syrian transboundary water management, 1953–2004, Arab World Ge-ographer, 9, 23–39, 2006.
Rosenberg, D. E., Howitt, R. E., and Lund, J. R.: Water Manage-ment with Water Conservation, Infrastructure Expansions, and Source Variability in Jordan, Water Resour. Res., 44, W11402, doi:10.1029/2007WR006519, 2008.
Salameh, E. and El-Naser, H.: Restoring the shrinking Dead Sea – the environmental imperative, in: Climatic Changes and Wa-ter Resources in the Middle East and North Africa, edited by: Zereini, F. and H¨otzl, H., Springer, Berlin, Germany, 453–468, 2008.
Wolf, A. T.: Hydropolitics along the Jordan River, United Nations University Press, New York, NY, 1995.
Yechieli, Y., Gavrieli, I., Berkowitz, B., and Ronen, D.: Will the Dead Sea die?, Geology, 26, 755–758, 1998.