Georgia State University
ScholarWorks @ Georgia State University
Public Health Theses School of Public Health
Spring 5-2010
An Examination of the Relationship between
Levels of Drinking Water Quality and the
Occurrence of Self-Reported Diarrheal Disease: A
Prospective Cohort Study in the Dominican
Republic, 2005-2006.
Shannon M. KraftGeorgia State University
Follow this and additional works at:https://scholarworks.gsu.edu/iph_theses
Part of thePublic Health Commons
This Thesis is brought to you for free and open access by the School of Public Health at ScholarWorks @ Georgia State University. It has been accepted for inclusion in Public Health Theses by an authorized administrator of ScholarWorks @ Georgia State University. For more information, please contact
Recommended Citation
Kraft, Shannon M., "An Examination of the Relationship between Levels of Drinking Water Quality and the Occurrence of Self-Reported Diarrheal Disease: A Prospective Cohort Study in the Dominican Republic, 2005-2006.." Thesis, Georgia State University, 2010.
i
Abstract
Shannon M. Kraft
An Examination of the Relationship between Levels of Drinking Water Quality and the
Occurrence of Self-Reported Diarrheal Disease: A Prospective Cohort Study in the Dominican Republic, 2005-2006.
(Under the direction of Christine Stauber, Faculty Member)
Background: 884 million people do not have access to clean water, which is a potential contributor to diarrhea (JMP, 2010). The purpose of this study was to examine the potential
associations between the occurrence of diarrhea and the levels of turbidity, total coliforms, and
Escherichia coli (E. coli), in 185 households in Bonao, Dominican Republic in 2005-2006.
Methods: A biweekly water quality dataset and a weekly diarrhea occurrence dataset were merged using three different methods. T-tests and odds ratios were calculated for all three
different datasets. Multivariate logistic regression was also conducted.
Results: There were 430 cases of diarrhea out of 14,245 observations. In the age-adjusted multivariate logistic regression, turbidity (OR = 1.36; p-value = .012) and total coliforms (OR =
.842; p-value = .006) were found to be significant for an association with the occurrence of
diarrhea. E. coli was not found to be significant for an association.
Conclusions: This study strengthens the evidence supporting a positive association between turbidity and the occurrence of diarrhea. This study also showed a negative association between
total coliforms and diarrhea. Future studies are needed to clarify these associations.
ii
AN EXAMINATION OF THE RELATIONSHIP BETWEEN LEVELS
OF DRINKING WATER QUALITY INDICATORS AND THE
OCCURRENCE OF SELF-REPORTED DIARRHEAL DISEASE: A
PROSPECTIVE COHORT STUDY IN THE DOMINICAN
REPUBLIC, 2005-2006.
By SHANNON M. KRAFT
B.S., BERRY COLLEGE
A Thesis Submitted to the Graduate Faculty of Georgia State University in Partial Fulfillment of the Requirements for the Degree
Master of Public Health
iii
AN EXAMINATION OF THE RELATIONSHIP BETWEEN LEVELS OF DRINKING WATER QUALITY AND THE OCCURRENCE OF SELF-REPORTED DIARRHEAL DISEASE: A PROSPECTIVE COHORT STUDY IN THE DOMINICAN REPUBLIC,
2005-2006.
By
SHANNON M. KRAFT
Approved:
Committee Chair
Committee Member
Committee Member
iv
Acknowledgements
I would like to thank Dr. Christine Stauber for the use of her dataset, her help with the entire thesis process, and for serving as my thesis chair. I would also like to thank Dr. Frances McCarty for serving on my thesis committee.
Thank you to my parents and my friends for their unwavering support throughout this entire process.
Finally, I would like to thank Jessica Mastrodomenico and Nancy Pope for being a wonderful “thesis support group”. Their support made this entire process bearable and a little more fun.
v
Authors’ Statement
In presenting this thesis as a partial fulfillment of the requirements for an advanced degree from Georgia State University, I agree that the Library of the University shall make it available for inspection and circulation in accordance with its regulations governing materials of this type. I agree that permission to quote from, to copy from, or to publish this thesis may be granted by the author or, in her absence, by the professor under whose direction it was written, or in his
absence, by the Associate Dean, College of Health and Human Sciences. Such quoting, copying, or publishing must be solely for scholarly purposes and will not involve any potential financial gain. It is understood that any copying from or publication of this dissertation which involves potential financial gain will not be allowed without written permission of the author.
vi
Notice to Borrowers
All theses deposited in the Georgia State University Library must be used in accordance with the stipulations described by the author in the preceding statement.
The author of this thesis is:
SHANNON M. KRAFT
2228 Heritage Trace View
Marietta, GA 30062
The Chair of the committee for this thesis is:
Christine E. Stauber, Ph.D, M.S.
Users of this thesis who not regularly enrolled as student as Georgia State University are required to attest acceptance of the preceding stipulation by signing below. Libraries borrowing this thesis for the use of their patrons are required to see that each user records here the
information requested.
NAME OF USER ADDRESS DATE TYPE OF USE
vii
Curriculum Vitae
Shannon Melissa Kraft
2228 Heritage Trace View
Marietta, Georgia 30062
Education
Georgia State University, Atlanta, GA
Master’s of Public Health, Prevention Sciences, May 2010
Berry College – Mt. Berry, Georgia
Bachelor of Science, Biochemistry, May 2007
Professional Experience
Georgia State University, Institute of Public Health, Atlanta, GA August 2008-Present
Graduate Research Assistant
Atlanta Regional Health Forum, Atlanta, GA December 2009-Present
Student Intern
DeKalb County Board of Health, Atlanta, GA May 2009-August 2009
Environmental Health Intern
CSI:Genetics Laboratory, Alpharetta, GA June 2007-December 2008
F.I.S.H technician
Skills
Microsoft Office
EpiInfo
Stata
Awards
viii
TABLE OF CONTENTS
ACKNOWLEDGEMENTS ... iv
LIST OF TABLES ... ix
LIST OF FIGURES ...x
INTRODUCTION ...2
1.1 Background ...2
1.2 Purpose of Study ...3
1.3 Research Questions ...3
REVIEW OF THE LITERATURE ...4
2.1 The Dominican Republic ...4
2.2 The Global Burden of Diarrheal Disease Due to Lack of Access to Clean Water & Sanitation...9
2.3 The Efficacy of Bacterial Indicators ...10
2.4 Potential Associations between Water Quality and Diarrheal Disease ...13
METHODS ...17
3.1 Data Sources ...17
3.2 Study Population ...19
3.3 Study Measures ...19
3.4 Analysis ...19
RESULTS ...21
4.1 Water Quality Dataset ...21
4.2 Diarrheal Disease Dataset ...22
4.3 Associations between Water Quality Variables and Diarrheal Disease ...24
4.4 Summary of the Results ...26
DISCUSSION AND CONCLUSION...37
5.1 Discussion ...37
5.2 Study Limitations ...39
5.3 Recommendations ...40
5.4 CONCLUSION ...41
ix
LIST OF TABLES
Table 1: Types of Water Treatment Used ...18
Table 2: Descriptive Statistics of Diarrhea among the Study Population……… Table 3: Descriptive Statistics of Diarrhea by Age Group among the Sample Unit……… Table 4: T-Test of Water Quality Variables and Diarrhea Status in the Directly-Linked
Dataset………
Table 5: Binary Logistic Regression of Individual Water Quality Variables and Diarrhea in the Directly-Linked Dataset………
Table 6: T-Test of Water Quality Variables and Diarrhea Status in the One-Week Lag
Dataset………
Table 7: Binary Logistic Regression of Individual Water Quality Variables and Diarrhea in the One-Week Lag Dataset...
Table 8: T-test of Water Quality Variables and Diarrhea Status in the Monthly Average Dataset...
Table 9: Binary Logistic Regression of Individual Water Quality Variables and Diarrhea in the Monthly Average Dataset………
Table 10: Age-Adjusted Multivariate Logistic Regression of Water Quality Variables and Diarrhea in the Monthly Average Dataset (N = 14912)...
Table 11: Compilation of Results from T-tests, Age-Adjusted Univariate Logistic Regression, & Age-Adjusted Multivariate Regression of Individual Independent Variables versus
x
LIST OF FIGURES
Figure 1: The Collection Times of the Two Datasets ...11
Figure 2: Diagram of the First and Second Data Merges……….12 Figure 3: Diagram of the Third Data Merge……….13 Figure 4: The Number and Type of Water Source………
Figure 5: Histogram of the Log-Transformed Turbidity (log10 NTU) Levels……….
Figure 6: Histogram of Log-Transformed Total Coliforms (log10 MPN/100 mL) Levels……….
Figure 7: Histogram of Log-Transformed E. coli (log10 MPN/100 mL) Levels………
Figure 8: Log-Transformed Turbidity (log10 NTU) Levels During the Study Period………
1
CHAPTER I INTRODUCTION
1.1Background
Based on the 2010 Joint Monitoring Programme Report, 884 million people lack access
to clean water, and 2.6 billion do not have adequate sanitation (JMP, 2010). It is estimated that
about 94% of all diarrheal disease is caused by a “reasonably modifiable environment”, which
implies that improving this environment through increased access to clean water and sanitation
could decrease the occurrence of diarrheal disease (Pruss-Ustun et al. 2007). In fact, it has been
shown that there is a correlation between improving access to clean water and improved
sanitation and a reduction in the occurrence of diarrheal disease (WHO, 2000). Since the 1980s,
the number of deaths due to diarrheal disease has fallen from 4.6 million in 1982 to 2.5 million
as of 2003. However, morbidity from diarrheal diseases has not decreased (Kosek, 2003).
According to the World Health Organization (WHO), 95% of the population of the
Dominican Republic has access to improved water and 78% have access to improved sanitation
(WHO, 2009). Despite the improvements in access to water and sanitation in the Dominican
Republic, improved access does not always mean that the water is safe to drink.
1.2Purpose of Study
The purpose of this study was to determine if there are any relationships between
increased levels of E. coli, total coliforms, or turbidity in household drinking water and the
frequency of self-reported diarrheal disease for participants in households in Bonao, Dominican
2
1.2 Research Questions
The purpose of this study was to determine if there is an association between water
quality and the frequency of self-reported diarrheal disease among individuals in Bonao,
Dominican Republic. Potential associations were determined by answering the following
questions:
1) Is there an association between increased levels of E. coli in household drinking water
and self-reported frequency of diarrhea?
2) Is there an association between increased levels of total coliforms in household drinking
water and self-reported frequency of diarrhea?
3) Is there an association between increased turbidity in household drinking water and
3
CHAPTER II
REVIEW OF THE LITERATURE
The purpose of this study was to look at the global burden of diarrheal disease on
developing countries, particularly the Dominican Republic, to analyze the efficacy of current
bacterial indicators, and to review previous studies on potential associations between diarrheal
disease and water quality.
2.1 The Dominican Republic
The Dominican Republic is located on the western half of the island of Hispaniola, which
is located in the Caribbean Sea (PAHO, 2010). It has a land area of 48,670 sq. km. (CIA, 2009).
The Dominican Republic borders the country of Haiti (PAHO, 2010). It has a tropical climate
with an average annual temperature of 26 ºC (78 ºF) (CIA, 2009; UN, 2010).
The Dominican Republic has a population of 9,650,054 as of July 2009. The birth rate is
22.39 births/1000 with an infant mortality rate of 25.96/1000 live births. The average life
expectancy is 73.7 years at birth (CIA, 2009). According to the World Health Organization
(WHO), 20% of the population lives below the poverty line (WHO).
The World Bank categorizes countries based on their gross national income (GNI) per
capita. Based on GNI, a country will be classified as low-income, middle-income, and
high-income. Low and middle-income countries are arbitrarily classified as developing countries.
According to the World Bank, the Dominican Republic was classified as an upper
middle-income country with a GNI per capita of $4,390 in 2008. Ergo, for the purposes of this study, the
Dominican Republic can be arbitrarily considered a developing country (World Bank, 2009).
Although the Dominican Republic is classified as a developing country, it is more
4
compared to its neighbor, Haiti, the differences between the two countries are startling. Haiti
occupies the eastern half of Hispaniola. Haiti has a population of 9,446,000 with a live birth rate
of 29.1/1000 live births (WHO, 2008; CIA, 2009). The average life expectancy is 73.7.
Additionally, 80% of the population lives below the poverty line (CIA, 2009).
2.2 The Global Burden of Diarrheal Disease Due to Lack of Access to Clean Water and Sanitation
Since the end of the 20th century, the burden of diarrheal disease related to poor water and
poor access to sanitation has been recognized (Rheingans et al., 2006). Currently, the World
Health Organization estimates that around 2.2 million people die annually from gastrointestinal
disease including diarrhea (WHO, 2010). The majority of these deaths occur in children under
the age of five with 1.5 million children dying from diarrheal disease annually (UNICEF, 2009).
During the end of the 20th century, several different initiatives were started to address this
problem. First, the United Nations (UN) made a push towards improving these conditions by
naming the 1980s, the International Decade for Clean Drinking Water. The main goal of the
International Decade for Clean Drinking Water was to provide safe drinking water universally.
Unfortunately, this goal was not met (Rheingans et al., 2006).
Thus, in 2000, the UN developed the Millennium Development Goals (MDGs) with Goal
7 focusing on decreasing by half the number of people without access to clean water and good
sanitation by 2015. As further incentive to improve global access to water, 2005-2015 has been
designated as the International Decade for Action-Water for Life (Rheingans et al., 2006). Based
on the most recent Joint Monitoring Programme report (2010), the world is expected to exceed
5
However despite this achievement, based on the predicted population growth, an
estimated 34-76 million people will still die from diarrheal disease between 2000 and 2020 even
with the MDG being met (Gleick et al., 2002). One major contributor to the ongoing occurrence
of diarrheal disease and death from diarrheal disease is the lack of access to clean water and
good sanitation in many countries (Rheingans et al., 2006). In fact, about 94% of all diarrheal
disease is caused by a “reasonably modifiable environment”, which implies that improving this
environment by increasing access to clean water and sanitation could decrease the occurrence of
diarrheal disease (Pruss-Ustun et al., 2007). Clean water access is defined as regular access to at
least 20 liters of water from an improved source per person daily (Rheingans et al., 2006).
Studies have been done that have highlighted the importance of access to clean water and
good sanitation (Ako Ako et al., 2009; Gundry et al., 2004). One such study was conducted by
Ako Ako et al. (2009) in Cameroon. In this particular study, the researchers were interested in
the water quality and sanitation and types of waterborne disease in Bonaberi, Cameroon.
Ako Ako et al. found that none of the collected samples met the WHO recommendations
for bacteriological water quality or turbidity. Additionally, it was found that diarrhea was the
most common waterborne disease among children under the age of one year old. Amongst this
age group, typhoid fever was the most uncommon. Among children ages 1-4 years old, all four
waterborne diseases occurred. In individuals older than 15 years old, typhoid fever was the most
common disease (Ako Ako et al. 2009).
A meta-analysis conducted by Gundry et al. (2004) looked at the impact of interventions
that looked at the water storage and water treatment practices and their effects on health (Gundry
et al. 2004). The authors found that point-of-use interventions were more successful in reducing
6
(Gundry et al., 2004). A point-of-use intervention is some form of water treatment that is
performed on water at the point of use, such as filtration (Luby et al., 2008). Gundry et al.
speculated that this could be because the use of adequate sanitation practices resulted in a
diminishing of fecal matter that could be transmitted (Gundry et al., 2004).
Unfortunately, many developing countries do not have universal access to either clean
water or sanitation. Globally, 884 million people lack access to clean water, and 2.6 billion do
not have adequate sanitation (JMP, 2010). The majority of these people are located in
Sub-Saharan Africa and Southeast Asia. However, in many middle-low-income countries, only
around 79% of the population has clean water and 49% have adequate sanitation (Rheingans et
al., 2006). In contrast to other developing nations, 95% of the population of the Dominican
Republic has access to improved water sources, and 78% have adequate sanitation (WHO, 2009).
Even with the MDG being met, 672 million people will still not have access to clean water in
2015 (JMP, 2010).
2.3 The Efficacy of Bacterial Indicators
Since the 19th century, coliforms have been used as indicators of water quality (Rompre
et al., 2002). Coliforms are traditionally the bacteria that are found in the intestines of humans
and other animals, which are excreted in their feces (Rompre et al., 2002). For instance, one
common coliform is Escherichia coli (E. coli), which makes up about 1% of the total bacterial
population within the human large intestine. E. coli is also the predominant bacteria (94%) in the
7
Originally, the coliform group consisted of only Klebsiella pneumoniae, Klebsiella
rhinoscleromatis, E. coli, Enterobacter aerogenes, Enterobacter cloacae, and Citrobacter
freundii (Leclerc et al., 2001). However, the current technical definition of a coliform is either
“all aerobic and facultative anaerobic, Gram-negative, non-spore-forming, rod-shaped bacteria
that ferment lactose with gas and acid formation within 48 hours at 35º C” or “all aerobic and
many facultative anaerobic, Gram-negative, non-spore-forming, rod-shaped bacteria that develop
a red colony with a metallic sheen within 24 hours at 35º C on an Endo-type medium containing
lactose” (Rompre et al., 2002).
The WHO currently classifies coliforms as part of the group of fecal indicators that can
infer the potential presence of pathogens (WHO, 2001). WHO uses E. coli to only infer the
presence of pathogens because some research (Solo-Gabriele et al., 2000; Anderson et al., 2005)
has shown that E. coli can be present in subtropical and tropical waters and sediments without
there being corresponding fecal contamination. Solo-Gabriele et al. (2000) found that E. coli
levels could multiply in dry soil in a tidally-influenced area in a subtropical climate, which they
speculated could influence the accuracy of fecal indicators (Solo-Gabriele et al., 2000). The
study conducted by Anderson et al. (2005) showed that fecal indicators had slower decay rates in
freshwater and sediments, which could also impact the use of fecal indicators as measures of
water quality (Anderson et al., 2005).
Another measure commonly used to evaluate water quality is turbidity. Turbidity is
defined as a measure of the clarity of water caused by the presence or absence of suspended
matter in the water. While increased turbidity could be caused by an increase of bacterial growth,
such as total coliforms or E. coli, it can also be caused by any other particle in the water (EPA,
8
Mann et al. (2007) conducted a systematic review of several studies (Schwartz et al.,
1997; Morris et al., 1998; Schwartz et al., 2000; Aramini et al., 2000; Lim et al., 2002; Gilbert et
al., 2006) to determine if there was any association between drinking water quality and turbidity
levels. The results among the six different studies varied depending on the study’s setting. Two
of the studies (Lim et al., 2002; Morris et al., 1998) found no association, while the other four
studies (Schwartz et al., 1997; Schwartz et al., 2000; Aramini et al., 2000; Gilbert et al., 2006)
did.
2.4 Potential Associations between Water Quality and Diarrheal Disease
In the past two decades, several studies have been undertaken in different developing
locales to study the potential association between water quality and the occurrence of diarrheal
disease (Moe et al. 1991; Gundry et al. 2004; Jensen et al. 2004; Brown et al. 2008). The results
of these studies have been mixed. No study has been able to show a very definitive association
between water quality and diarrheal disease.
One of the earlier studies was a one-year study in Cebu, Philippines in 1991 that was
conducted by Moe et. al (1991). This study looked at the efficacy of the four main bacterial
indicators of water quality, fecal coliforms, E. coli, enterococci, and fecal streptococci. This
study only showed a significant difference in the amount of diarrheal disease when the water
quality was bad. They speculated that diarrheal disease among children drinking good to
moderate water may be the result of other transmission routes. It appeared that only when the
water was severely contaminated did water become the major source of transmission of diarrheal
9
Gundry et. al (2004) conducted a meta-analysis on studies between 1994 and 2001 that
looked at the potential relationship between microbiological water quality indicators at
point-of-use to health outcomes. It was found that there was not any significant association between the
levels of indicator bacteria and diarrheal disease. This lack of association was true regardless of
the severity of the diarrheal disease in any of the studies, which contrasted Moe’s results
(Gundry et al. 2004; Moe et al. 1991).
Jensen et. al (2004) conducted a one –year study in southern Punjab, Pakistan. Similar to
the studies from Gundry’s meta-analysis (Gundry et al. 2004), Jensen’s study did not find any
association between the amount of E. coli contamination and the incidence of diarrhea among
young children, which remained even as the levels of E. coli increased. They concluded that their
study supported the theory that water contamination was not as significant of a risk factor for
childhood diarrhea in comparison to other risk factors, such as access to water (Jensen et al.
2004).
Brown et. al conducted a 22-week study in Kandal Province, Cambodia to examine the
association between E. coli levels in household drinking water and diarrheal disease and
dysentery (2008). This study found that there were small, nonlinear, yet significant increases in
the occurrence of diarrheal disease in the groups with exposure levels of 11-100 E. coli cfu/100
mL, 101-1000 E. coli cfu/100 mL and 1001 + E. coli cfu/100 mL. These results were found in
the entire group and also in a child only group (Brown et al. 2008).
10
Chapter III METHODOLOGY
3.1 Data Sources
The data used in this study was secondary data obtained from Dr. Christine Stauber. The
dataset was created using data from two different files of data from a prospective cohort study
that was conducted between September 2005 and January 2006. The protocol was approved by
Georgia State University’s Institutional Review Board (protocol H10061).
3.2 Study Population
During September 2005 to January 2006, 185 households in Bonao, Dominican Republic
were selected to participate in a prospective cohort study as part of a randomized controlled trial
of the concrete biosand filter, a household water treatment device. For five months prior to the
randomized controlled trial study, households were asked to answer questions regarding
diarrheal disease as well as provide drinking water samples to provide a baseline on the
occurrence of diarrheal disease and the water quality. The baseline data are the subject of the
study here.
During this time period, the households were surveyed weekly regarding the occurrence
of diarrheal disease in their households. Additionally, water samples from all household drinking
11
3.3 Study Measures
The outcome assessed in this study was the occurrence of diarrheal disease at the
individual-level among the studied households. The three main exposures examined were the
total coliforms, E. coli, and turbidity levels of the household drinking water samples. All three
variables were log-transformed to obtain more normal distributions.
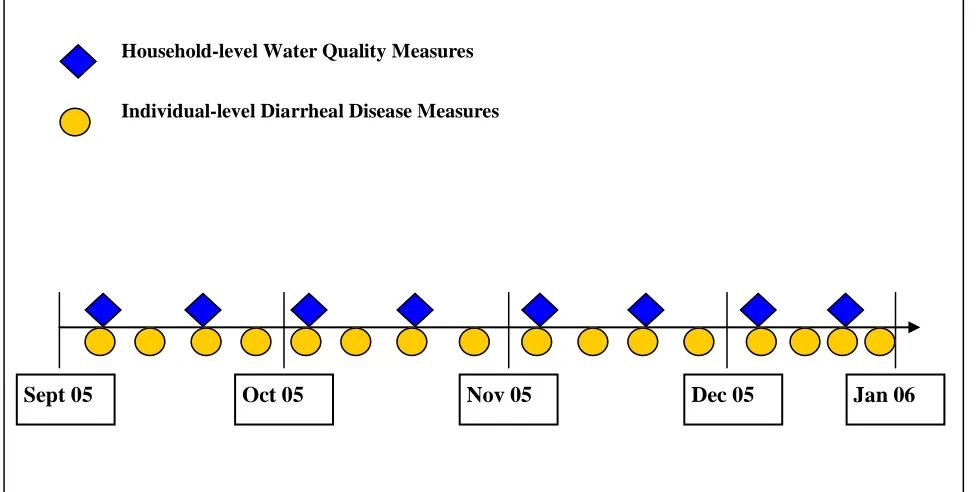
The dataset was created from two different datasets. The first dataset contained the
weekly individual-level diarrheal disease data. This data included information on the nature of
the diarrheal episode, including duration, stool type, treatment, and hospitalization. The second
dataset consisted of the results of the biweekly water quality analysis, which included
information on total coliform, E. coli, and turbidity levels of the household drinking water
[image:22.612.51.539.413.659.2]samples. As shown in Figure 1, data were collected at different frequencies and time points.
Figure 1: The Collection Times of the Two Datasets Household-level Cross-sectional Demographic Survey
Sept 05 Oct 05 Nov 05 Dec 05 Jan 06
Household-level Water Quality Measures
12
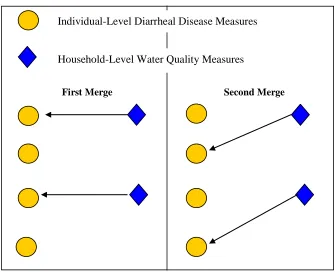
In order to account for the difference between the weekly diarrheal disease measurements
and the biweekly water quality measurements, the diarrheal disease data and the water quality
data were initially merged together in two ways:
1) All diarrheal disease data were directly linked with water quality
measurements from the same week of observation. This assumed that any
development of diarrheal disease was a direct result of the water quality during
the same week.
2) A one week lag was incorporated into the water quality data. This resulted in
the water quality data being linked with the diarrheal disease data one week after
the water quality sample was taken. This accounted for the possible incubation
time of diarrheal disease after exposure to potentially contaminated water
[image:23.612.148.483.398.670.2]occurred (Figure 2).
Figure 2: Diagram of the First and Second Data Merges
Individual-Level Diarrheal Disease Measures
Household-Level Water Quality Measures
13
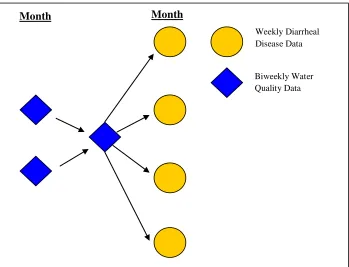
In either of the above analyses, since water quality was only measured at two week
intervals and diarrheal disease was measured at weekly intervals, the merged data were limited to
approximately half of the total observations. Therefore, to be able to incorporate water quality
and all of the diarrheal disease measurements, a third approach was taken to link the two:
3) Water quality data were averaged for each household for each month and then
assigned to the corresponding diarrheal disease data for that month. This enabled
[image:24.612.72.421.297.564.2]all of the diarrheal disease observation to be incorporated into further analyses
(Figure 3).
Figure 3: Diagram of Third Data Merge
Month Month
Weekly Diarrheal Disease Data
14
3.4 Analysis
All data was analyzed in StataSE 10. Descriptive statistics were run on the water quality
dataset to determine the designated users of the water sources, the types of water treatment used,.
turbidity levels, total coliforms levels, E. coli levels, occurrence of diarrhea, type of stool,
hospitalization, and interference with daily activities.
T-tests were performed on data from all three merges to determine if there were any
significant differences between the levels of turbidity, total coliforms, and E. coli among people
with diarrhea compared to people without diarrhea. Univariate logistic regressions were run to
determine the extent of any possible associations between the outcome of diarrheal disease and
any of the different measurement variables of total coliforms, E. coli, and turbidity. Finally,
15
Chapter IV RESULTS
The research questions are answered in detail in section IV.
4.1 Water Quality Dataset
The water quality dataset was a biweekly dataset that collected information about a
household’s water treatment practices. Additionally, information about the turbidity, total
coliform levels, and E. coli levels were also measured biweekly for each household. There were
185 households that participated, which resulted in 1634 observations.
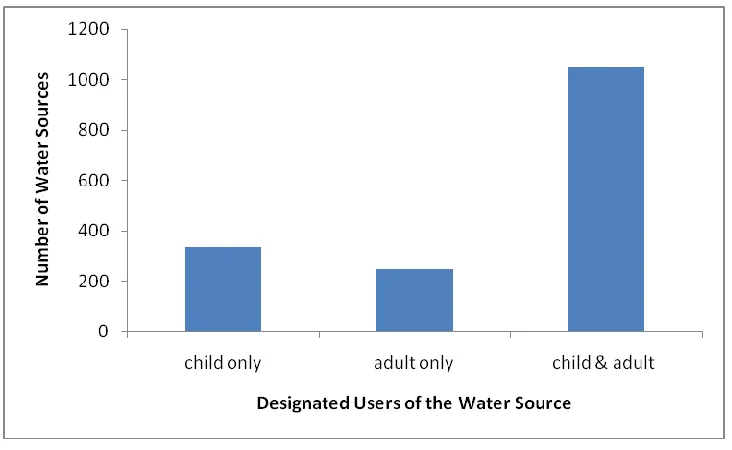
During the data collection, every household was asked to provide a sample of all sources
of household drinking water. It was possible for a household to have more than one water sample
associated with it at any given week. Normally, this situation occurred when a household used
one water source for adults and older children and another source for the younger children.
Additionally, the number of samples associated with a household could vary from week to week.
After providing a water sample from all water sources being used during that particular
week, the households were asked to identify whether the source was for adult use, child use, or
both. The majority of the water sources were used by both children and adults (N = 1050;
16
Figure 4: The Number and Type of Water Source
The continuous turbidity levels were log10-transformed. After the log-transformation, the
histogram of turbidity showed a very normal distribution. Around 10% of the observations
17
0
2
4
6
8
10
P
e
rce
n
t
-1 0 1 2
[image:28.612.76.475.75.362.2]Log-Transformed Turbidity (log10 NTU)
Figure 5: Histogram of the Log-Transformed Turbidity (log10 NTU) Levels
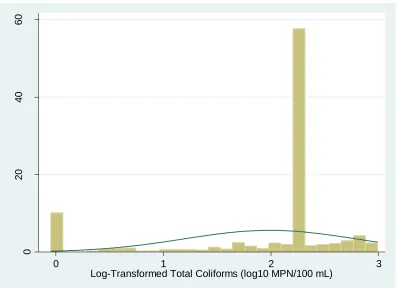
The total coliform levels were also log10-transformed. After the transformation, the
histogram of total coliforms was mainly flat with one very significant peak around 2.5 log10
18
0
20
40
60
P
e
rce
n
t
0 1 2 3
[image:29.612.77.475.73.361.2]Log-Transformed Total Coliforms (log10 MPN/100 mL)
Figure 6: Histogram of Log-Transformed Total Coliforms (log10 MPN/100 mL) Levels
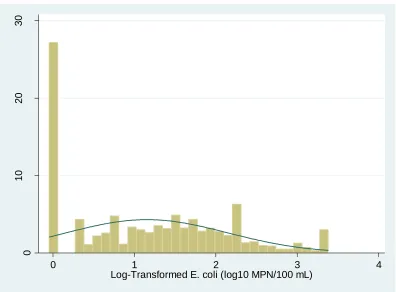
Finally, the E. coli levels were also log10-transformed. After the transformation, the
histogram of E. coli appeared somewhat normally distributed. However, it has less kurtosis than
the histogram of turbidity. The most noteworthy aspect of the E. coli histogram was that around
19
0
10
20
30
P
e
rce
n
t
0 1 2 3 4
[image:30.612.77.473.72.364.2]Log-Transformed E. coli (log10 MPN/100 mL)
Figure 7: Histogram of Log-Transformed E. coli (log10 MPN/100 mL) Levels
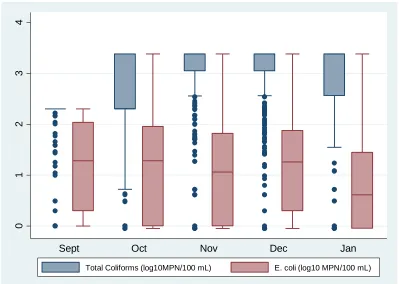
After all three exposures were log10-transformed, box plots of turbidity, total coliforms,
and E. coli levels during the five-month study period were created (Figure 8; Figure 9).
Turbidity levels were relatively constant during September through November. A slight
peak in the levels occurred in December, which was followed by a marked decrease in January.
20 -1 0 1 2 L o g -T ra n s fo rm e d T u rb id it y (l o g 1 0 N T U )
[image:31.612.77.473.77.360.2]Sept Oct Nov Dec Jan
Figure 8: Log-Transformed Turbidity (log10 NTU) Levels during the Study Period
During the study period, E. coli levels remained relatively constant with two slight
decreases in November and January. There were also no outliers occurring. In contrast, the
majority of the total coliform measurements were outliers. However, based on the means, the
21
0
1
2
3
4
Sept Oct Nov Dec Jan
[image:32.612.75.474.74.358.2]Total Coliforms (log10MPN/100 mL) E. coli (log10 MPN/100 mL)
Figure 9: Log-Transformed Total Coliforms (log10 MPN/100 mL) and E. coli (log10 MPN/100 mL) Levels during the Study Period
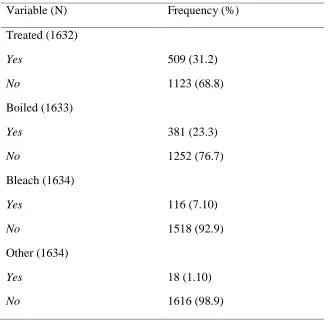
Every household was also asked if they treated their drinking water. The biweekly water
quality surveys found that the majority of the provided water samples were not treated (68.8%).
However, among the treated water samples, the most commonly used water treatment was
22
Table 1: Types of Water Treatment Used
Variable (N) Frequency (%)
Treated (1632)
Yes 509 (31.2)
No 1123 (68.8)
Boiled (1633)
Yes 381 (23.3)
No 1252 (76.7)
Bleach (1634)
Yes 116 (7.10)
No 1518 (92.9)
Other (1634)
Yes 18 (1.10)
No 1616 (98.9)
Categories are not mutually exclusive
4.2 Diarrheal Disease Dataset
There were 14,297 observations in the diarrheal disease dataset. An observation was any
incidence of reported diarrhea for any member of a study household. Thus, a household could
have numerous observations associated with it in a study week. In this study, diarrheal disease
was classified based on the WHO standard, which defines three or more loose stools or any
bloody stools within 24 hours (Stauber et al. 2009). Fifty-two of those observations were
classified as “I don’t know” in regards to the occurrence of diarrheal disease. Therefore, those 52
observations were not included in any of the analyses performed. Out of the remaining 14,245
23
which is 3.02% of the observations. This is a relatively low frequency of diarrhea, which could
affect the analysis.
There were 290 reported cases of watery diarrhea (69.05%) making it the most common
type of diarrhea experienced. The majority of the reported diarrheal disease cases (152) did not
interfere with the individual’s daily activities (62.83%). Nine cases of diarrhea resulted in
[image:34.612.71.387.285.713.2]hospitalization (2.16%). (Table 2).
Table 2: Descriptive Statistics of Diarrhea among the Study Population
Variable (N) Frequency (%)
Diarrhea (14,245)
Yes 430 (3.02)
No 13,815 (96.98)
Type of Stool (420)
Watery 290 (69.05)
Bloody 12 (2.86)
Mucous 96 (22.86)
Other 22 (5.24)
Interference with Daily Activities (417)
Yes 152 (36.45)
No 262 (62.83)
I don’t know 3 (0.72)
Hospitalized (416)
Yes 9 (2.16)
24
Out of 14,297 observations, the age group with the greatest percentage of diarrheal
disease among the same population was the <2 year olds with 176 cases of diarrhea (12.9%). In
the next age group, 2-4 years old, the percentage of diarrheal disease decreased by roughly half
from the <2 years old group. Overall, as age increased, the frequency of diarrhea decreased as
[image:35.612.66.555.242.365.2]well (Table 3).
Table 3: Descriptive Statistics of Diarrhea by Age Group among the Sample Unit
Age (N) Diarrhea (%) No Diarrhea (%)
< 2 years old (1362) 176 (12.9) 1186 (87.1)
2-4 years old (2423) 149 (6.15) 2274 (93.9)
5-14 years old (3350) 51 (1.52) 3299 (98.5)
>14 years old (7110) 54 (0.76) 7056 (99.2)
4.3 Associations between the Independent Variables and Diarrheal Disease
The Directly-Linked Dataset
The directly-linked dataset was created by merging the water quality and diarrheal
disease datasets by linking the diarrheal disease data with the water quality data from the same
observation week. Thus, any occurrences of diarrheal disease were assumed to be associated
with the water quality during the same week (Figure 2). After the merge, 103 observations did
not merge because they did not fit into the criteria for the merge variable. Thus, they were not
included in the analysis.
T-tests were performed on all three independent variables, turbidity, total coliforms, and
25
Turbidity was the only independent variable that had a statistically significant difference between
the two groups (p = 0.005) (Table 4).
All three variables were log-transformed to obtain a more normal distribution. Then,
t-tests were performed on the log-transformed variables to see if the significance of any of the
variables changed. However, turbidity was still the only variable that resulted in a significant
difference between groups with diarrhea (Mean = 0.191) versus groups without diarrhea (Mean =
0.098; p = 0.01). Neither total coliforms nor E. coli levels were found to be significantly different
26
Table 4: T-test of Water Quality Variables and Diarrhea Status in the Directly-Linked Dataset Non-Log-Transformed Values Log10-Transformed Values
Variable Diarrhea No Diarrhea Diarrhea No Diarrhea
Turbidity a
Mean 3.10 2.19 0.191 .098
p-value 0.005 0.01
Total Coliformsb
Mean 1260 1272 2.74 2.72
p-value 0.894 0.716
E. coli b
Mean 178 153 1.30 1.25
p-value 0.484 0.538
a
(NTU) b
(MPN/100 mL) c
(log10NTU)
d
(log10MPN/100 mL)
Binary logistic regressions were performed for all three log-transformed variables.
Turbidity was the only variable that was significant for an association with diarrheal disease with
an OR of 1.60 (p = 0.010) (Table 5). The odds of the occurrence of diarrheal disease were
increased by a factor of 1.60 with a one unit increase in log turbidity. A one unit increase in log
turbidity is the equivalent of a tenfold increase. Similar to the analyses of means, total coliforms
and E. coli were found to not be associated with the occurrence of diarrheal disease.
All three log-transformed variables were then adjusted for age. After adjusting for age,
none of the variables were found to be significant for an association with the occurrence of
27
Table 5: Binary Logistic Regression of Individual Water Quality Variables and Diarrhea in the Directly-Linked Dataset
Unadjusted Values Age-Adjusted Values
Variable N OR p-value CI
(95%)
N OR p-value CI
(95%)
Turbidity a 6509 1.60 0.010 1.12-2.30
6509 1.43 0.053 .995-2.05
E. coli b 6514 1.05 0.538 0.893-1.24
6514 1.14 0.130 .963-1.34
Total coliforms b
6514 1.04 0.716 0.853-1.26
6514 1.03 0.774 .846-1.25
a
(log10NTU)
b
(log10MPN/100 mL)
The One-Week Lag Dataset
The one-week lag dataset was created by merging the water quality and diarrheal disease
datasets by linking the water quality data with the diarrheal disease measurements taken one
week after the collection of the water sample. Thus, this merge took into account the potential of
an incubation time between exposure to the water sample and the occurrence of diarrheal disease
(Figure 2). After the merge, 103 observations did not merge due to not meeting the determined
merge criteria, so they were not included in the analysis.
T-tests were performed on all three independent variables, turbidity, total coliforms, and
E. coli, to see if there was any difference between the means of groups with or without diarrhea.
Turbidity was the only independent variable that had a statistically significant difference between
28
All three variables were log-transformed to obtain a more normal distribution. Then,
t-tests were performed on the log-transformed variables to see if the significance of any of the
variables changed. However, turbidity was still the only variable that resulted in a significant
difference between groups with diarrhea (Mean = 0.205) versus groups without diarrhea (Mean =
0.094; p = 0.005). Neither total coliforms nor E. coli levels were found to be significantly
[image:39.612.69.479.314.606.2]different between the two groups (p = 0.295; p = 0.624, respectively) (Table 6).
Table 6: T-test of Water Quality Variables and Diarrhea Status in the One-Week Lag Dataset Non-Log-Transformed Values Log10-Transformed Values
Variable Diarrhea No Diarrhea Diarrhea No Diarrhea
Turbidity a
Mean 2.87 2.16 0.205 0.094
p-value 0.042 0.005
Total Coliformsb
Mean 1216 1271 2.63 2.71
p-value 0.570 0.295
E. coli b
Mean 151 154 1.20 1.24
p-value 0.951 0.624
a (NTU)
b
(MPN/100 mL) c
(log10NTU)
d
29
Binary logistic regressions were performed for all three log-transformed variables.
Turbidity was the only variable that was significant with an OR of 1.77 (p = 0.005; 1.19-2.62)
(Table 7). As log turbidity increases by one unit, the odds of occurrence of diarrheal disease
increases by a factor of 1.77. This suggests a positive association between diarrheal disease and
turbidity. Similarly to the results of the T-tests, there was no association between the occurrence
of diarrheal disease and either total coliforms and E. coli.
The three water quality variables were then adjusted for age. After adjustment, turbidity
alone remained significant with an OR of 1.56. However, based on turbidity’s p-value of 0.026,
there was a slight decrease in significance compared to the unadjusted values (Table 7). The lack
[image:40.612.66.516.408.669.2]of significance for both total coliforms and E. coli remained unchanged by the age-adjustment.
Table 7: Binary Logistic Regression of Individual Water Quality Variables and Diarrhea in the One-Week Lag Dataset
Unadjusted Values Age-Adjusted Values
Variable N OR p-value CI
(95%)
N OR p-value CI
(95%)
Turbiditya 6243 1.77 0.005
1.19-2.62
6243 1.56 0.026
1.05-2.32
E. coli b 6248 0.956 0.624
0.798-1.15
6248 1.04 .669
.868-1.25
Total
coliformsb
6248 0.904 0.296
0.748-1.09
6248 .899 0.277
.742-1.09
a
(log10NTU)
b
30
The Monthly Average Dataset
The monthly average dataset was created by averaging all of the water quality
measurements for each household for each month. These averaged water quality measurements
were then linked with the corresponding diarrheal disease measurements for that month (Figure
3).
T-tests were performed on all three variables, turbidity, total coliforms, and E. coli, to see
if there was any difference between the means of groups with or without diarrhea. Turbidity was
the only variable that had a statistically significant difference between the two groups (p < 0.001)
(Table 8).
All three variables were log-transformed to obtain a more normal distribution. Then,
t-tests were performed on the log-transformed variables to see if the significance of any of the
variables changed. However, turbidity was still the only variable that resulted in a significant
difference between groups with diarrhea (Mean = 0.188) versus groups without diarrhea (Mean =
0.0946; p < 0.001). Neither total coliforms nor E. coli levels were found to be significantly
31
Table 8: T-test of Water Quality Variables and Diarrhea Status in the Monthly Average Dataset Non-Log-Transformed Values Log10-Transformed
Values
Variable Diarrhea No Diarrhea Diarrhea No Diarrhea
Turbidity a
Mean 2.99 2.19 0.188 0.0946
p-value <0.001 < 0.001
Total coliformsb
Mean 1332.98 1402.32 2.71 2.76
p-value 0.139 0.1405
E. coli b
Mean 185.05 168.16 1.26 1.23
p-value 0.376 0.387
a (NTU) b
(MPN/100 mL) c
(log10NTU)
d
(log10MPN/100 mL)
Binary logistic regressions were performed between each of the three independent
variables and diarrhea. Turbidity was the only variable that was significant with an OR of 1.73 (p
< 0.001) (Table 9). Thus, the odds of the occurrence of diarrheal disease were increased by 1.73
as log turbidity increased by one unit. Neither total coliforms nor E. coli were found to be
significant.
Adjustment for age was performed, which resulted in only turbidity being significant.
Turbidity remained significant with a p-value of 0.001, and based on the OR, the odds of the
occurrence of diarrheal disease increased by 1.45 as log turbidity increased by one unit. This
32
Once again, neither total coliforms nor E. coli were found to be significant in this analysis (Table
[image:43.612.67.521.194.456.2]9).
Table 9: Binary Logistic Regression of Individual Water Quality Variables and Diarrhea in the Monthly Average Dataset
Unadjusted Values Age-Adjusted Values
Variable N OR p-value CI
(95%)
N OR p-value CI
(95%)
Turbidity a 14912 1.73 < 0.001
1.38-2.16
14912 1.45 0.001
1.15-1.81
E. coli b 14931 1.05 0.387
0.945-1.16
14931 1.10 0.067
.994-1.21
Total
coliformsb
14931 0.922 0.141
0.828-1.03
14931 .901 0.065
.807-1.01
a
(log10NTU)
b
(log10MPN/100 mL)
A multivariate logistic regression with all three water quality variables was conducted,
adjusting for age. After running the analysis, both turbidity and total coliforms were found to be
significant. For turbidity, the odds of diarrheal disease occurrence were 1.36 for every one unit
increase of log turbidity (p-value = 0.012). This resulted in a positive association between
turbidity and the occurrence of diarrheal disease (Table 10).
In contrast, there was a negative association between total coliforms and the occurrence
33
diarrheal disease increased by 0.842 (p-value = 0.006). There was still not any significant
[image:44.612.66.326.193.379.2]association between the occurrence of diarrheal disease and E. coli levels (Table 10).
Table 10: Age-Adjusted Multivariate Logistic Regression of Water Quality Variables and Diarrhea in the Monthly Average Dataset (N = 14912)
Variable OR p-value CI (95%)
Turbidity a 1.36 0.012 1.07-1.74
E. coli b 1.11 0.088 .984-1.25
Total
coliforms b
0.842 0.006 .745-.953
a
(log10NTU)
b
(log10MPN/100 mL)
4.4 Summary of the Results
In this study, the water quality measurements and the diarrheal disease measurements
were linked together in three different ways. For all of the t-test analyses, turbidity was the only
water quality variable that showed a significant difference between groups with diarrhea and
groups without diarrhea. Turbidity was found to have the greatest significance when the t-test
was conducted on the monthly averages dataset (p-value < 0.001). However, this is most likely
due to the larger sample size found in the monthly averages dataset (Table 11).
In the one-week lag dataset and the monthly averages dataset, age-adjusted univariate
34
diarrheal disease occurrence (Table 11). However, age-adjusted univariate logistic regression
analysis performed on the directly-linked dataset did not find any significant associations
between the occurrence of diarrheal disease and any of the water quality variables (Table 11).
This lack of associations may be because this method of merging did not take the potential
incubation time of diarrheal disease into account.
In contrast, the one-week lag dataset took potential incubation time into account by
lagging the diarrheal disease dataset by one week. Thus, the one-week lag dataset did find a
significant association between turbidity and diarrheal disease occurrence using age-adjusted
univariate analysis. An OR of 1.56 was found for turbidity (p-value = 0.026) (Table 11).
Both the directly-linked and the one-week lag datasets only dealt with roughly half of the
observations, which negatively impacts significance. In contrast, the monthly average dataset
was comprised of all of the observations. When age-adjusted univariate logistic regression
analysis was performed on this dataset, turbidity was still the only significant association with an
OR of 1.45 (p-value = 0.001 (Table 11).
Due to the increased sample size and increased significance of the results of the
univariate logistic regression analyses, a multivariate logistic regression analysis was only
performed on the monthly averages dataset. The analysis was adjusted for age. After conducting
this analysis, significant associations for both turbidity and total coliforms with the occurrence of
diarrheal disease were found. For turbidity, a positive association was found (OR = 1.36; p-value
= 0.012). However, total coliforms had a negative association with diarrheal disease occurrence
(OR = 0.842; p-value = 0.006) (Table 11).
Based on these results, in this study population, turbidity was the only factor that
35
[image:46.612.67.548.212.511.2]coliforms, there is evidence of a protective effect when controlling for turbidity, E. coli, and age
(Table 11).
Table 11: Compilation of Results from T-tests, Age-Adjusted Univariate Logistic Regression, & Age-Adjusted Multivariate Regression of Individual Independent Variables versus Diarrhea
T-Test; Mean Univariate Logistic Regression Multivariate Logistic Regression*
Variable Diarrhea (p-value) No Diarrhea OR CI (95%) p-value OR CI (95%) p-value
Directly-Linked
Turbidity a 0.191 (0.01) 0.098 1.43 .995-2.05 .053
Total Coliforms b 2.74 (0.716) 2.72 1.03 .846-1.25 .774
E. coli b 1.30 (0.538) 1.25 1.14 .963-1.34 .130
One-Week Lag
Turbidity a 0.205 (0.005) 0.094 1.56 1.05-2.32 .026
Total Coliforms b 2.63 (0.295) 2.71 .899 .742-1.09 .277
E. coli b 1.20 (0.624) 1.24 1.04 .868-1.25 .669
Monthly Averages
Turbidity a 0.188 (<0.001) 0.0946 1.45 1.15-1.81 .001 1.36 1.07-1.74 .012
Total Coliforms b 2.71 (0.1405) 2.76 .901 .807-1.01 .065 .842 .745-.953 .006
E.coli b 1.26 (0.387) 1.23 1.10 .994-1.21 .067 1.11 .984-1.25 .088
a
(log10NTU) b
(log10MPN/10 mL)
*
36
Chapter V
DISCUSSION AND CONCLUSION
5.1 Discussion
The issue of water quality and its potential role in the occurrence of diarrheal disease has
been a major public health issue since the beginning of the 20th century. While this issue has
already been addressed in many developed countries through the creation of sophisticated water
treatment measures, developing countries are still working towards reducing the impact of water
quality on the health of their populations by improving access to clean water (Rheingans et al.,
2006). According to the most recent estimates, 884 million people still lack access to clean
water, and 2.6 billion do not have adequate sanitation (JMP, 2010).
However, while it is accepted that water quality contributes to diarrheal disease, there is
still not a lot of evidence available to corroborate this association between the levels of indicator
pathogens and water quality. Previous studies have found different results depending on the
population or the setting being studied (Moe et al., 1991; Gundry et al., 2004; Jensen et al.,
2004; Brown et al., 2008). Thus, this study aimed to strengthen the evidence base for
associations between water quality and diarrheal disease in a developing country.
Water Quality Dataset
Out of the study population, 31% of drinking water samples were reported to be treated
prior to consumption. The most common treatment used was boiling. Thus, this means that the
37
Additionally, the total coliform and E. coli levels did not meet the WHO’s water quality
standards. WHO states that there should be no detectable E. coli or total coliforms in any 100 mL
water sample (Havelaar et al., 2001). After taking the inverse log, the majority of the E. coli
levels were around 1 MPN/100 mL of water (Figure 7). While the E. coli levels are only slightly
above the acceptable value, the total coliform levels vastly exceeded acceptable levels. The
majority of the total coliform observations were clustered around 200 MPN/ 100 mL of water
(Figure 6), which is not acceptable according to the WHO guidelines (Havelaar et al., 2001).
However, the majority of the turbidity levels were below the acceptable level. According
to the WHO, turbidity levels should be below 5 NTU (WHO, 2010). In this study, the levels
ranged from 0.1 to 10 NTU with the majority of the observations being around 1 NTU after the
inverse log was taken (Figure 5). Thus, it is surprising that turbidity was found to be significantly
associated with diarrheal disease in the majority of analyses conducted on the merged datasets.
Additionally, during the 5-month study period, the turbidity levels and E. coli levels
remained fairly constant throughout the entire time period with only very slight increases and
decreases. In contrast, the total coliform levels peaked in November and December. All three
indicators began to decline in January (Figure 8; Figure 9). It is not known if this is indicative of
seasonality in the levels of the indicators because the study was not long enough to be able to
determine this.
However, it is possible that there is some seasonality among the different indicators. In
the study conducted by Ako Ako et.al, they noticed a seasonal pattern to the occurrence of
diarrheal disease in Cameroon due to rainfall (Ako Ako et al., 2009). Although the Ako Ako et
al. (2009) study looked at diarrheal disease occurrence, it is possible that the amount of rainfall
38
the levels of diarrheal disease. Further studies with longer time periods are needed to determine
if seasonality is a factor in the levels of indicators in the Dominican Republic.
Diarrheal Disease Dataset
During the course of the five-month study period, there were 430 reported incidences of
diarrheal disease (3.02%) (Table 2). After adding together the categories of under 2 years old and
2-4 years old, it was shown that the majority of the cases (325) occurred in children under 4
years old. As the population increased in age, the frequency of diarrhea among the population
decreased (Table 3).
The results of this study are similar to what has been shown before in that children under
five years old are disproportionately affected by diarrheal disease. UNICEF estimates that
around 2.5 billion cases of diarrhea occur annually among children under five years old, which
results in 1.5 million deaths occurring among this population. Additionally, the incidence of
diarrheal disease is the highest among children 2 years old and younger (UNICEF, 2009).
Unfortunately, the morbidity from diarrheal disease among young children has remained
relatively constant since the 1980s despite large-scale efforts to improve health (O’Ryan et al.,
2005; UNICEF, 2009).
Associations Between the Water Quality Variables and Diarrheal Disease
For two out of the three data configurations analyzed in this study, turbidity was the only
39
between increasing turbidity levels and the increasing occurrence of diarrheal disease. This was
somewhat surprising given that the majority of the turbidity levels of the water samples (Figure
5) were below the WHO’s standards (Havelaar et al., 2001). However, these results do support
previous findings. In the systematic literature review conducted by Mann et al. (2007), the
occurrence of an association between turbidity and gastrointestinal disease was dependent on the
population and setting being studied (Mann et al., 2007). Additionally, Tinker et al. (2010)
conducted a study in Atlanta that found a slight association between an increased number of
emergency room visits for gastrointestinal illness and raw water turbidity (Tinker et al., 2010).
Both of these studies (Mann et al., 2007; Tinker et al., 2010) found only slight
associations or inconsistent associations among developed countries. However, these two studies
dealt with populations in developed countries with improved water sources. Thus, while these
studies may have found only small associations or inconsistent associations in developed
countries, it is logical to assume that in a developing country with decreased access to improved
water supplies, greater associations may be found. This supposition was supported by the finding
of a significant association between turbidity and occurrence of diarrheal disease in this study.
This association remained even after controlling for E. coli,total coliforms and age (Table 14).
Total coliforms were only found to be significant after controlling for turbidity, E. coli,
and, age. Interestingly, this study found that total coliforms had a protective effect. Thus,
according to these results, increased levels of total coliforms result in decreased occurrence of
diarrheal disease. However, there are not a lot of previous findings that support a protective
effect for total coliforms. In 1987, a study conducted by Zmirou et al. found that fecal coliforms
were protective in small villages of fewer than 400 people. In communities with more than 400
40
(Zmirou et al.1987). However, this study included communities in the Dominican Republic that
were larger than 400 people, so the findings are not supported by previous literature.
It is also possible that the total coliform levels were limited by the detection limits of the
assay as well as the non-Gaussian distribution of the samples. Thus, this limitation could result in
the appearance of a protective effect when no such effect exists. In order to confirm or refute the
existence of a protective effect, future studies need to use categorical total coliform levels in the
analyses.
E. coli was not significant in any of the merges. This finding does support previous
findings that showed that the levels of E. coli in drinking water are not indicative of the
occurrence of diarrheal disease (Jensen et al., 2004; Gundry et.al., 2004).However, a large
number of the E. coli observations were clustered around 0 log10MPN/100 mL, which is around
1 MPN/100 mL (Figure 7). In the studies conducted by Moe et al. (1991) and Brown et al.
(2008), E. coli levels were only significant at higher concentrations of E. coli (Moe et al., 1991;
Brown et al., 2008).
5.2Study Limitations
One of the potential limitations to this study is the use of two different datasets to create
one comprehensive dataset. Ultimately, three different data merges were conducted because of
the differences in the timeframes of each study. The first two merges merged the biweekly water
quality dataset with the weekly diarrheal disease dataset. Because of the nature of the merges,
both of the resultant merged datasets contained only half of the observations. Although the loss
of half of the data was expected, it still could have a negative impact on the level of significance
41
Additionally, during the first two merges, some data from the water quality dataset did
not merge with the diarrheal disease dataset for unknown reasons. This resulted in the loss of 103
observations due to the merge criteria used. Future studies would need to create more
comprehensive merge criteria.
The final merge combined the biweekly water quality measures with the weekly diarrheal
disease dataset. In order to include all of the observations, all of the water quality measurements
from each month were averaged together resulting in one monthly water quality measurement.
This monthly averaged value was then assigned to all of the household observations from that
month.
Although averaging the water quality data was necessary to be able to combine both
datasets in their entirety, it also creates another potential limitation. By averaging the values, the
resultant value can potentially be skewed by outliers. Thus, it is difficult to ascertain if there
were any extremely high or low levels of any of the variables that might correspond with
incidences of diarrheal disease. Additionally, the differences between a water source that was
only used by children versus one that was only used for adults cannot be measured. It is possible
that the differences between the types of treatment used for the different sources may impact the
levels of indicators.
Another possible source of limitations was in the collection of the data. All of the
diarrheal disease data was dependent on one member of the household answering questions
about the entire family’s diarrheal disease history for the past week. Thus, the respondent’s recall
of diarrheal disease occurrence for their entire family may not be completely accurate.
Additionally, the use of family units created clustering in the study. Due to repeated observations
42
the responses of other family members, clustering was a factor in this study. Future studies need
to take clustering into account during the conducting of the statistical analyses.
Finally, this study looked at the odds ratios for all of the indicator levels. Thus, the data is
only able to suggest an association or lack of an association. It is not possible to establish
causality. Therefore, it is always possible that the diarrheal disease was caused by factors outside
of the scope of this study.
5.3 Recommendations
Future studies of these datasets need to be conducted to look at some of the unanswered
questions and to further clarify the results presented in this study.The E. coli and total coliform
levels need to be stratified into different categories and then look at the possible associations
between them and diarrheal disease. It has been seen in two different studies (Moe et al., 1991;
Brown et al., 2008) that E. coli only becomes significantly associated with diarrheal disease
occurrence at higher levels of E. coli. Thus, this possibility needs to be done in future studies.
The association between turbidity levels and diarrheal disease occurrence needs to be
further explored. Finally, the possibility of total coliforms causing a protective effect needs to be
further studied using categorized total coliform levels.
5.4 Conclusion
Overall, this study further strengthened the evidence that young children suffer the most
43
population of the Dominican Republic have access to improved water sources (WHO, 2010), the
levels of total coliforms and E. coli in some areas’ drinking water are not considered potable by
WHO’s standards (Havelaar et al., 2001). Additionally, the results of this study showed that
among this population the turbidity levels are potentially a significant factor in the occurrence of
diarrheal disease, despite the acceptable turbidity levels in the drinking water. Finally, this study
44
REFERENCES
Ako Ako, A., Nkeng, G.E., & Takem, G.E.E. (2009). Water Quality and Occurrence of
Water-Borne Diseases in the Douala 4th District, Cameroon. Water Science & Technology,
59(12), 2321-2329.
Anderson, K.L., Whitlock, J.E., & Harwood, V.J. (2005). Persistence and Differential Survival
of Fecal Indicator Bacteria in Subtropical Waters and Sediments. Applied and
Environmental Microbiology, 71(6), 3041-3048.
Brown, J.M., Proum, S., & Sobsey, M.D. (2008). Escherichia coli in Household Drinking Water
and Diarrheal Disease Risk: Evidence from Cambodia. Water Science & Technology,
58(4), 757-763.
CIA. (2009). “The Dominican Republic”. The World Factbook. www.cia.gov
EPA. (1999). “Importance of Turbidity.” EPA Guidance Manual Turbidity Provisions. 1-10.
Gleick, P.H. (2002). Dirty Water: Estimated Deaths from Water-Related Diseases 2000-2020.
Retrieved from www.pacinst.org.
Gundry, S., Wright, J. & Conroy, R. (2004). A Systematic Review of the Health Outcomes
Related to Household Water Quality in Developing Countries. Journal of Water and
Health, 2(1), 1-13.
Havelaar, A., Blumenthal, U.J., Strauss, M., et al. (2001). Guidelines: The Current Position.
45
Jensen, P.K., Jayasinghe, G., van der Hoek, W., et al.(2004). Is there an Association between
Bacteriological Drinking Water Quality and Childhood Diarrhoea in Developing
Countries? Tropical Medicine and International Health, 9(11), 1210-1215.
Joint Monitoring Programme. (2010). Progress on Drinking Water and Sanitation, 2010 Update.
WHO.
Kosek, M. Bern, C. & Guerrant, R.L. (2003). The Global Burden of Diarrhoeal Disease, as
Estimated from Studies Published between 1992 and 2000. Bulletin of the World Health
Organization, 81(3), 197-204.
Leclerc, H., Mossel, D.A.A., Edberg, S.C., Struijk, C.B. (2001). Advances in the Bacteriology of
the Coliform Group: Their Suitability as Markers of Microbial Water Safety. Annu. Rev.
Microbiol., 55, 201-234.
Luby, S.P., Mendoza, C., Keswick, B.H., Chiller, T.M., Hoekstra, R.M. (2008). Difficulties in
Bringing Point-of-Use Water Treatment to Scale in Rural Guatemala. Am. J. Trop. Med.
Hyg., 78(3), 382-387.
Mann, A.G., Tam, C.C., Higgins, C.D., Rodrigues, L.C. (2007). The Association between
Drinking Water Turbidity and Gastrointestinal Illness: A Systematic Review. BMC
Public Health, 7(256), 1-7.
Moe, C.L., Sobsey, M.D., Samsa, G.P., Mesolo, V. (1991). Bacterial Indicators of Risk of
Diarrhoeal Disease from Drinking-Water in the Philippines. Bulletin of the World Health