Biology Theses Department of Biology
8-11-2015
Browning of white adipose tissue by melatonin
Eleen Zarebidaki
Follow this and additional works at:https://scholarworks.gsu.edu/biology_theses
This Thesis is brought to you for free and open access by the Department of Biology at ScholarWorks @ Georgia State University. It has been accepted for inclusion in Biology Theses by an authorized administrator of ScholarWorks @ Georgia State University. For more information, please contact
scholarworks@gsu.edu.
Recommended Citation
BROWNING OF WHITE ADIPOSE TISSUE BY MELATONIN
by
ELEEN ZAREBIDAKI
Under the Direction of Timothy Bartness, PhD
ABSTRACT
There are two distinct types of adipose tissue which have different functions within the
body, white (WAT) and brown (BAT). Browning of WAT occurs with increases in the WAT
sympathetic nervous system (SNS) drive. In this regard we previously reported that melatonin
(MEL) stimulation of MEL receptor 1A (MEL1a) within the SNS outflow to the WAT might be
implicated in a naturally-occurring reversal of obesity (by ~30% of total body fat). Therefore, in
this study we tested the hypothesis that MEL causes browning of WAT through the stimulation
of SNS drive to WAT. This was done by comparing specific browning and lipolytic markers in
WAT following 10 weeks of MEL treatment, short day housing (SD), and long day housing with
saline injections (LD+VEH). Browning effects of a 5 day treatment of a β3-adrenergeric
(β3-AR), CL 316, 243, were also measured. We found that CL 316, 243, MEL treatment, and SD
housing had increased expressions of browning markers within WAT and lipolytic activity in
MEL treated animals was increased in specific WAT.
BROWNING OF WHITE ADIPOSE TISSUE BY MELATONIN
by
ELEEN ZAREBIDAKI
A Thesis Submitted in Partial Fulfillment of the Requirements for the Degree of
Master of Science
in the College of Arts and Sciences
Georgia State University
Copyright by Eleen Zarebidaki
BROWNING OF WHITE ADIPOSE TISSUE BY MELATONIN
by
ELEEN ZAREBIDAKI
Committee chair: Timothy Bartness
Committee: Bingzhong Xue
Aaron Roseberry
Electronic Version Approved:
Office of Graduate Studies
College of Arts and Sciences
Georgia State University
ACKNOWLEDGEMENTS
I would like to extend my greatest gratitude to Dr. Timothy Bartness for giving me the
opportunity to be a part of his lab. His guidance and support throughout the years have been
invaluable in completing my research and in shaping my enthusiasm of science. My special
thanks to Dr. Vitaly Ryu for his incredible amount of patience and help for without his valuable
advice and insight, this project would not have been possible.
I would also like to thank my lab peers for creating a wonderful environment filled with
fun, support, and friendship. Without their individual contributions, it would have been a lonely
and difficult journey. I would also like to express my gratitude to Dr. Aaron Roseberry and Dr.
Bringxhong Xue for being a part of my committee and for their advice on this project.
Finally, I wish to thank my hard working and caring parents, Hossein and Elaheh, my
thoughtful brother, Eleeyus, as well as my feline friends, Zara and Persia. Without their
TABLE OF CONTENTS
ACKNOWLEDGEMENTS ... IV
LIST OF FIGURES ... VI
1 INTRODUCTION... 1
1.1 Seasonal changes within Siberian hamsters and MEL ... 1
1.2 Fat depots and their innervations ... 2
1.3 Browning of white adipose tissue ... 3
1.4 Experimental Aim ... 5
2 MATERIALS & METHODS... 6
2.1 Animal Model ... 6
2.2 Experiment 1 -CL316, 243 injections ... 6
2.3 Experiment 2 -MEL injections ... 6
2.4 Western blot analysis ... 7
3 RESULTS ... 9
3.1 CL 316,243 injections ... 9
3.2 MEL injections ... 9
4 DISCUSSION ... 23
LIST OF FIGURES
Figure 1: Schematic representation of MEL experimental design. ... 8
Figure 2: A) Body mass of animals during 5 day CL316, 243 and saline injections. B)
Paired fat pad masses and testes mass. ... 11
Figure 3: Western blot analysis of IBAT UCP1 (A) and PGC-1α (B) in CL and saline
Injected for duration of 5 days. *p<0.05 vs. saline. ... 12
Figure 4: Western blot analysis of IWAT UCP1 (A) and PGC-1α (B) in CL and saline
Injected for duration of 5 days. *p<0.05 vs. saline. ... 13
Figure 5: Western blot analysis of RWAT UCP1 (A) and PGC-1α (B) in CL and saline
Injected for duration of 5 days. *p<0.05 vs. saline. ... 14
Figure 6: A) Food Intake over 10 week period in animals given MEL or VEH injections.B)
Body mass change.C) Paired fat pad masses and testes mass. *p<0.05 vs. SD;
#p<0.05 vs. LD+MEL. ... 15
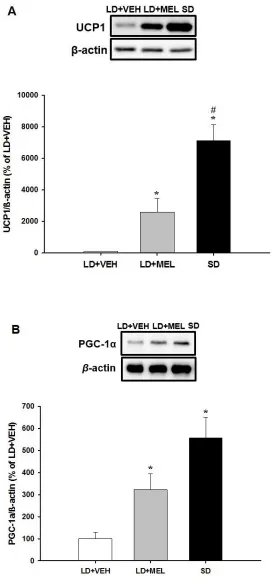
Figure 7: Western Blot Analysis of UCP1 and PGC-1α in IBAT. A) Expression on UCP1 B)
Expression of PGC-1α. *p<0.05 vs. LD+VEH ... 17
Figure 8 : Western Blot analysis of UCP1 and PGC-1α in IWAT A) Percent UCP1
expression. B) Percent PGC-1α expression. Percent calculated as ratio of protein
tested to β-actin control. *p<0.05 vs. LD+VEH. ... 18
Figure 9: Western Blot analysis of UCP1 and PGC-1α in RWAT A) Percent UCP1
expression.B) Percent PGC-1α expression. Percent calculated as ratio of protein
tested to β-actin control. *p<0.05 vs. LD+VEH #p<0.05 vs. LD+MEL*p<0.05 vs.
LD+VEH ... 19
Figure 10: Western Blot analysis of UCP1 and PGC-1α in EWAT. A) Expression on UCP1
B) Expression of PGC-1α.*p<0.05 vs. LD+VEH #p<0.05 vs. SD ... 20
Figure 11: Western blot analysis of HSL and pHSL. IWAT (A), RWAT (B), EWAT (C),
and BAT (D) western blot with ratio of HSL/pHSL taken as percent of LD+VEH. *P
1 INTRODUCTION
1.1 Seasonal changes within Siberian hamsters and MEL
Obesity has shown to be one of the leading causes of death in the United States, being a
primary risk factor for diseases such as diabetes, cardiovascular disease, and hypertension1,2.
These health complications account for at least 85% of the obesity-related economic burden3,
therefore, a lot of research has been going into finding a methods for its reversal. An ideal animal
model for obesity reversal research is the Siberian hamster (Phodopus sungorus) due to its innate
ability to express an obese phenotype with only a change in photoperiod. No genetic or dietary
changes are needed for this phenomenon to occur. When exposed to short-day (SD) “winter-like”
photoperiods (8hr light:16hr dark) Siberian hamsters express lean body mass (~20 % body fat)
however, if the light cycle is altered to a long day (LD) photoperiod (16hr light:8hr dark)
resembling “summer-like” conditions, their physiology is transformed to express an obese
phenotype (~50 % body fat)4-7.
The mechanism behind this seasonal change is controlled by melatonin (MEL); a
neuropeptide hormone released from the pineal gland whose principal function is to maintain a
natural circadian rhythm within the body. Studies have shown that MEL causes a decrease in
obesity, without affecting food intake and is hypothesized to be a thermogenic regulator8-10.
When retinal ganglionic cells of the eyes detect darkness, a signal is sent to the suprachiasmatic
nucleus (SCN) of the brain, which in turn, through a series of pathways, triggers the pinealocytes
to release MEL into the bloodstream. The amount of MEL released over time is directly
proportional to the duration of darkness11,12. Obstruction of the signal from the retinal ganglion
or pineal gland disrupts this seasonal change13. When the pineal gland is removed, it has been
changes within Siberian hamsters4,11,12. This intrinsic system is vital for the determination of
seasonal changes, which triggers physiological transformations necessary for survival and
reproduction.
It was previously thought that seasonal changes in circulating hormones such as gonadal
steroids, prolactin, thyroid hormones, glucocorticoids, and epinephrine cause the seasonal
lipolytic changes however, that was proven to not be the case and the changes are possibly
neuronal rather than hormonal14. The lipolytic activity of MEL can easily be measured by
analyzing the ratio of hormone-sensitive lipase (HSL) and phosphorylated hormone-sensitive
lipase (pHSL). HSL is the rate limiting step in the breakdown of triglycerides to free fatty acids
(FFA) within adipose tissue which in turn allow for the thermogenic effects to occur. When HSL
hydrolyzes triglycerides, it becomes phosphorylated, therefore, by taking the ratio of
unphosphorylated to phosphorylated HSL we can determine the degree to which lipolysis is
occurring within the given fat pad15,16.
1.2 Fat depots and their innervations
Fat cells are not distributed equally throughout the body; they are accumulated in clumps
known as fat depots. Siberian hamsters have many fat pads situated subcutaneously [inguinal
white adipose tissue (IWAT) and interscapular brown adipose tissue (IBAT)], as well as more
internally located [retroperitoneal white adipose tissue (RWAT), epididymal white adipose tissue
(EWAT), and mesenteric white adipose tissue (MWAT)]. There are two different types of
adipose tissue, brown and white, which play significantly different roles within the body.
Brown adipose tissue (BAT) is unique in that it is responsible for quick access to energy
in the form of heat through non-shivering thermogenesis, signaled by uncoupling protein-1
energy in the form of triglycerides which when activated by the SNS, undergoes lipolysis. BAT,
which contains a higher concentration of mitochondria compared with WAT, is activated in
times of physiological thermogenic challenge such as exposure to cold, food deprivation, and
exercise.
It has previously been shown that the SNS release of norepinephrine (NE) triggers
lipolysis in vitro17. Neuroanatomical evidence for the link between MEL the SNS increase in
lipolysis was shown through the injection of a retrograde transneuronal tract tracer, Pseudorabies
virus (PRV), into WAT which labels the SNS pathway from the brain to fat pad. Regions of the
brain that were connected to the fat pad showed infection of the PRV virus in areas hypothesized
to contain MEL receptors, such as the SCN, optic chiasm, dorsomedial hypothalamic nucleus,
periventricular hypothalamic nucleus (PVH), as well as several other nuclei. These areas infected
with PRV were later tested for co-localization of MEL1a. Major areas such as the SCN, pars
tuberalis, PVH, and nucleus reuniens, showed double labeling of SNS innervation and MEL1a
receptor. These findings imply the importance of MEL in SNS innervation of fat pads and in the
effects of seasonal changes within them, such as browning of white adipose tissue7.
1.3 Browning of white adipose tissue
Approximately three decades ago the idea of browning of white adipose tissue (WAT)
was introduced, but it was not until recently that it has become an area of increasing interest. It
has been shown that WAT can contain traces of brown adipocytes under conditions of
thermogenic hardships, among many others, not only in rodents, but also in humans18. Brown
adipocytes within WAT, referred to as brite cells19, exhibit the same thermogenic characteristics
In order to differentiate at a molecular level WAT from BAT, markers specific to BAT
must be identified. UCP1 is a protein found in the mitochondria of brown adipocytes that allows
for the heat generating property of BAT by altering the permeability of the inner mitochondrial
membrane. In the unstimulated state UCP1, also found in WAT, does not generate heat, as UCP1
containing mitochondria do not exhibit a natural leaky membrane to protons necessary for heat
production20. However, we believe that when sympathetically challenged, conversion of white
adipocytes into ‘brite,’ as assessed by increases in UCP1 mRNA and protein synthesis, occurs.
Thus, UCP1 serves as an excellent browning marker.
In addition to UCP1, Peroxisome proliferator-activated receptor gamma (PPARγ)
coactivator-1-α (PGC-1α) regulates the production of mitochondria within a fat pad. PGC-1α is a
major transcriptional cofactor in charge of regulating many of the PPAR proteins responsible for
metabolic changes; most importantly, PPARγ, which plays a key role in adipocyte formation,
differentiation, and mitochondrial biogenesis21,22. Due to its regulation of UCP1, BAT
thermogenesis, and involvement in the production of mitochondria, PGC-1α is found more
abundantly in BAT as compared with WAT and can be used as an accurate marker for brown
adipocyte presence23. These above receptor proteins are factors whose change in expression can
shed light onto the mystery that is the browning of white adipose tissue and therefore are being
measured for this experiment.
Increases in the SNS drive to WAT leads to release of NE from WAT-associated SNS
postganglionic nerve terminals thereby stimulating brown adipocyte conversion via β3-AR17 that
ultimately activate UCP1. This NE effect is mimicked by CL316, 243, a highly selective β3-AR
agonist both in vivo24,25and in vitro26. CL 316,243 has proven to induce browning in mice and
changes in adiposity may be mediated via increases in the SNS drive to WAT and with the
measurement of these markers, we can test the extent to which browning is occurring.
The SCN, however, is not the only area mainly responsible for these seasonal changes.
The Dorsal medial Hypothalamus (DMH) has been shown to also be highly involved in seasonal
physiological changes that occur within Syrian and Siberian hamsters28,29. The DMH was found
to cause browning in an experiment where the NPY neurons within the DMH were knocked
down. Animals with this knockdown had an increase in browning of their WAT which also
increased the rate of thermogenesis30.
MEL has been directly linked to the browning of WAT in laboratory rats and Siberian
hamsters, perhaps by increasing the SNS drive through MEL in the brain and, specifically, the
SCN and DMH31,32. This suggests that MEL could be playing a major role in the regulation of
brown adipocytes. Unlocking the process in which browning occurs can be a key to obesity
reversal research; however, the question still stands; how are these traditionally white adipocytes
redirected into becoming brown adipocytes with very different functions?
1.4 Experimental Aim
Experiment 1: In order to mimic SNS activation, CL316, 243 will be exploited for its potential
browning effect in Siberian hamsters. We hypothesize that CL316, 243 administration will
increase the SNS drive to WAT, causing an increases in brown adipocyte markers. Based on our
previous study browning will most likely occur within the retroperitoneal WAT (RWAT),
inguinal WAT (IWAT), and, perhaps, epididymal WAT (EWAT) as well as causing an increase
in mitochondriogenesis within IBAT14.
Experiment 2: In this experiment we aim to test the effects of prolonged (10-week) MEL
The presence of ‘brite” adipocytes in WAT will be revealed by identifying BAT-specific
markers such as UCP1 and PGC-1α. We hypothesize that daily MEL injections to animals stored
in LD photoperiod will trigger the occurrence of physiological changes normally seen in animals
stored in SD photoperiods, specifically the production of multilocular brite adipocytes within
WAT in relation with increases in the SNS efferent drive to WAT.
2 MATERIALS & METHODS
2.1 Animal Model
Adult male Siberian hamsters used for this study were obtained from the lab breeding
colony and were single housed at room temperature (22 + 2 °C) with exposure to a LD
photoperiod with free access to water and regular chow. They were allowed to acclimate for one
week and then transferred to their appropriate light cycle room depending on the experimental
grouping. Animal care was in accordance with humane standards and all animal procedures were
conducted under the regulation of Georgia State University.
2.2 Experiment 1 -CL316, 243 injections
Three month old Siberians hamsters were divided into two separate groups (n = 5/group)
and housed in LD light cycle. One group received daily intraperitoneal (i.p.) injections of CL316,
243 at a dose of 1 mg/kg for five days while the control group received saline (SAL) injections.
Animals were then terminated with sodium pentobarbital (Sleep Away: 300 mg/kg), fat pads
(BAT, IWAT, RWAT) excised, weighed, and snapped frozen in liquid nitrogen.
2.3 Experiment 2 -MEL injections
After a one week acclimation period in a LD photoperiod light cycle, two month old
with 16 hours dark and 8 hours light (n = 15) and LD photoperiod with 16 hours light and 8
hours dark (n = 22) with free access to water and regular chow. In the LD room, half of the
animals (n = 11) received subcutaneous (s.c.) MEL injections (0.4 mg/kg) daily 3 hours prior to
lights off for a total period of 10 weeks while the other half received s.c. (SAL) and served as a
control group. Therefore, overall, there were a total of 3 experimental groups: LD + SAL, LD +
MEL and SD (Fig.1). Weekly food intake and body mass were monitored. After 10 weeks, the
animals were sacrificed as mentioned above and fat pads (BAT, RWAT, IWAT, EWAT)
excised, weighed, and snap frozen in liquid nitrogen and later stored in -80 °C freezer for later
Western Blot analysis. Testes were also excised and weighed for confirmation of regression. All
SD animals that did not respond to the SD photoperiod, as seen by the absence of testicular
regression, were considered no-responders and therefore excluded from the study.
2.4 Western blot analysis
Fat tissue were homogenized using ~120 g of sterile Zirconium beads and a 1:2 ratio of
homogenization buffer, and 415 µl of protease and phosphatase inhibitor cocktail (Halt). Tissues
were then added to their individual tubes and were mechanically homogenized using a bullet
blender 2 times for one minutes. Tubes were then centrifuged for 10 minutes at 13,000 x g.
Protein extracts (supernatant) were then aliquoted into 3 tubes and stored in -80 °C. Protein
concentration for each sample was determined using known concentrations of bovine serum
albumin standards. Desired concentrations for each sample was calculated and made with 4x
Loading buffer and Millipore water. The appropriate concentration for each sample was loaded
onto a 10% acrylamide gel along with 10 µL of broad range protein ladder (Thermo) in the first
and last wells. Sample concentrations for experiment 1- CL were 10 µg/µl for IWAT and IBAT
Following the SDS-page gel run, gels were transferred to a PVDF membrane, washed 2x for 10
mins in TBS, and blocked for 2 hours in blocking solution (4 % nonfat dry milk in TBS).
Membranes were then incubated for ~48 hours in a [1:1000] of the appropriate primary antibody,
UCP1, PGC-1α, HSL, and pHSL. Following the completion of the primary antibody incubation,
the membranes were washed 3x for 5 minutes with TBS, then incubated in goat anti rabbit
secondary antibody [1:1000] for 2 hours. Finally, they were washed 3x for 10mins with TTBS
and incubated in chemiluminescent kit for 5 min followed by gel imaging.
Data were analyzed by the Student’s t-test and one-way analysis of variance (ANOVA)
followed by the post-hoc Bonferroni’s and Holm-Sidak’s tests using NCSS (version 2007,
Kaysville, UT). Significance was set at P<0.05. For simplicity and clarity, values
with P<0.05, P<0.01 and P<0.001 were all indicated with a single asterisk. All values are
[image:16.612.77.547.434.657.2]presented as mean ± standard error of the mean.
3 RESULTS
3.1 CL 316,243 injections
CL 316,243, tended to decrease BM over course of the 5 day injections, however without
statistical significance (Fig. 2A). The fat pad mass individually as well as testes showed no
significant difference between the groups (Fig. 2B). CL316, 243 treatment significantly
increased protein levels for browning markers UCP1 and PGC-1α (Ps<0.05) both in RWAT and
IWAT as compared with the saline control (Fig. 3,4,5). IBAT however, only had an increase in
UCP1 expression for CL 316, 243 animals with IBAT PGC-1α protein unchanged between the
groups.
3.2 MEL injections
Although it was previously seen that MEL does not affect food intake for up to 5
weeks28,33, in this study, SD and s.c injections of MEL daily for 10 weeks markedly decreased
food intake starting from week 5 until the end of the experimental period compared with
LD+VEH animals (Ps <0.05; Fig. 6A). Body mass was also lower for LD+MEL animals once
again resembling the SD animals (Ps<0.05; Fig. 6B). One of the most obvious physiological
changes that occurs during the photoperiod triggered seasonal changes is testes regression4,6.
Indeed SD and MEL treatment resulted in a profound testicular regression. Occasionally, SD and
chronic MEL caused a complete testicular regression. As hypothesized, the testes mass for
LD+MEL animals was regressed to a size similar to the SD group confirming MEL’s effect on
the reproduction. Focusing more closely, individual fat depot masses were measured which
showed significant decreases in IWAT, RWAT, and EWAT masses (p<0.05), but not IBAT, for
As for the occurrence of browning UCP1 protein levels in RWAT, IWAT, and IBAT
were lowest in the LD+VEH group while UCP1 protein expression in SD hamsters seemed to be
higher than that of the LD+MEL hamsters, however, without statistical significance (Fig.
7A,8A,9A). When looking at EWAT UCP1 expression, the trend was reversed, with LD+MEL
animals having the highest expression and SD animals having an expression similar to LD+VEH
animals (Fig. 10).
PGC1-α was also expressed at higher levels in IWAT and RWAT of LD+MEL and SD
animals (Fig.8B, 9B). RWAT and IWAT showed a stepwise increase for PGC1-α (P < 0.05)
while EWAT PGC1-α was the opposite of this with LD+VEH showing the highest amount of
expression (Fig, 8B, 9B, 10B). Lastly, IBAT had no significant difference in PGC1-α within all
groups (Fig 7B).
Lipolytic activity, measured by the ratio of pHSL/HSL, was increased stepwise within
IWAT (p < 0.05), while showing no significant amounts in RWAT and BAT. EWAT, contrary to
our hypothesis, showed a decrease in lipolysis in the SD group as compared with the LD+ MEL.
The LD+MEL and SD group however did show higer lipolytic activity then the control
Figure 6: A) Food Intake over 10 week period in animals given MEL or VEH injections.B) Body mass
Figure 7: Western Blot Analysis of UCP1 and PGC-1α in IBAT. A) Expression on UCP1 B) Expression of
Figure 8 : Western Blot analysis of UCP1 and PGC-1α in IWAT A) Percent UCP1 expression. B) Percent
Figure 9: Western Blot analysis of UCP1 and PGC-1α in RWAT A) Percent UCP1 expression.B) Percent
PGC-1α expression. Percent calculated as ratio of protein tested to β-actin control. *p<0.05 vs. LD+VEH
Figure 10: Western Blot analysis of UCP1 and PGC-1α in EWAT. A) Expression on UCP1 B) Expression of
4 DISCUSSION
In this study we effectively presented the browning and lipolytic effects of CL316, 243
and MEL within WAT of Siberian hamsters. In accordance with our hypothesis, overall
expression of browning markers were elevated in CL316, 243 and MEL treated animals as
compared with controls. MEL animals showed browning expression similar to SD animals,
confirming that chronic MEL injections in animals housed in LD light cycles is capable of
replicating SD physiology within Siberian hamsters. CL316, 243 confirmed its role in SNS
stimulation leading to browning of WAT.
CL316, 243 and MEL treatment caused a decrease in overall BM as predicted. Although
MEL injected rodents were reported as reducing BM independent of food intake34, our data in
Siberian hamsters show that food intake of MEL injected animals was lower compared to the
control. Although it is plausible that decreases in BM of our hamsters were the result of a
decreased food consumption, we do not exclude the possibility that this change in food intake
could be secondary to the decrease in BM after 5 weeks. Paired fat pad masses as well as testes
mass show significant differences between the MEL animals and saline treated ones (p < 0.05),
however not for the CL316, 243 injected group. This could have been due to the relatively short
duration of CL 316,243 injections. If the number of days were to be increased, it is possible that
a more dramatic change will be observed, specifically within individual fat pads. Testicular
regression of the LD+MEL animals decreased to a mass extremely close to SD animals. The
results of this study are in concordance with our previous findings where chronic MEL induced
similar testicular regression despite the different dose of MEL used in the study35. All fat pads
with the exception of BAT in LD+MEL animals show significant decreases in mass. This set of
Since browning has been confirmed of occur in mice and rats following CL 316, 243
injections24, we measured expression of UCP1 and PGC-1α in Siberian hamsters receiving the
same treatment. As expected, all pads tested showed an increase in UCP1 expression, and all
except for IBAT showed elevated PGC-1α expression. Since PGC-1α is a marker of
mitochondria biogenesis, it could be that IBAT has an abundance of mitochondria, and with an
increase in SNS signaling to IBAT, only UCP1 is further stimulated within the already present
mitochondria. MEL browning marker expression had a similar trend as CL316, 243 treated
animals for UCP1 and PGC-1α in IWAT, IBAT, and RWAT (Fig. 7-10), thus, further supporting
the idea that β3-AR stimulation of SNS to WAT plays a role in the browning phenomenon.
Although LD+MEL animals show a significant increase in browning, similar to that of
SD animals (p<0.05), it is possible that with longer exposure to s.c. MEL, the LD+MEL could
obtain a higher degree of browning that would match that of SD housed animals more closely.
UCP1 expression in BAT for CL316, 243, LD+MEL, and SD animals shows a significant
elevation in expression (p<0.05), however differences in PGC-1α expression between the groups
is not significant. An explanation for this could be that UCP1 and PGC-1α, although both
markers of browning, represent different parts of the pathways leading to browning. UCP1 is
responsible for altering the permeability of mitochondria while PGC-1α expression represents
mitochondrial biogenesis.
EWAT had the least predictable data out of all the pads, with UCP1 expression being
highest in LD+MEL and SD having an expression more closely resembling LD+VEH (Fig. 10).
This difference between browning marker trends in IBAT 1α and EWAT UCP1 and
PGC-1α could be due to the presence of more SNS innervation within RWAT and IWAT pads,
measured by the ratio of pHSL to HSL, we observed differential correlation between browning
marker expression and lipolysis for RWAT, IWAT, BAT, and EWAT. The reason for this could
be that there is an lipolysis does not occur at the same time period of all fat pads and at the 10
week time point, when fat depots were extracted for this study, IWAT and EWAT were at their
peak lipolytic activity, as compared with BAT and RWAT, therefore more epinephrine was
being released resulting in the elevation of lipolytic markers. In support of this notion, Demas
and colleagues previously demonstrated that mRNA for β3-adrenoceptor was significantly
increased after 5 weeks of daily MEL treatment indicating MEL-induced SNS outflow to adipose
tissues to trigger lipolytic responses.36. It could be possible that RWAT and BAT will show peak
lipolytic activity at a time point earlier than 10 weeks. Given this, our test animals most likely
had already depleted their stores and the markers could not be detected at 10 weeks.
In conclusion, we have validated the browning effects of chronic exogenous MEL on
WAT and from CL316, 243 data determined that this browning effect could possibly be through
increased SNS signaling to WAT. Markers of ‘brite’ adipocytes, UCP1 and PGC-1α, were
significantly increased in IBAT, RWAT, IWAT, and partially in EWAT following CL316, 243,
MEL, and SD treatments inferring MEL ability to trigger browning. Overall, we conclude that
MEL has shown to be a major contributor to the pathway causing the seasonal changes within
Siberian hamsters by altering SNS drive and through this, induce browning of WAT. With
REFERENCES
1 Pi-Sunyer, F. X. Health hazards of obesity. Annals of Internal Medicine119, 655-660 (1993). 2 Malnick SD, K. H. The medical complications of obesity. QJM.99, 565-579 (2006).
3 Raebel MA, M. D., Conner DA, Xu S, Porter JA, Lanty FA. Health services use and health care costs of obese and nonobese individuals. Archives of Internal Medicine164, 2135-2140 (2004). 4 Bartness, T. J. & Wade, G. N. Photoperiodic control of body weight and energy metabolism in
Syrian hamsters (Mesocricetus auratus): Role of pineal gland, melatonin, gonads, and diet.
Endocrinology114, 492-498 (1984).
5 Hoffmann, K. The influence of photoperiod and melatonin on testis size, body weight, and pelage colour in the Djungarian hamster (Phodopus sungorus). J.Comp.Physiol.85, 267-282 (1973).
6 Wade, G. N. & Bartness, T. J. Effects of photoperiod and gonadectomy on food intake, body weight and body composition in Siberian hamsters. Am.J.Physiol.246, R26-R30 (1984). 7 Song, C. K. & Bartness, T. J. CNS sympathetic outflow neurons to white fat that express
melatonin receptors may mediate seasonal adiposity. Am.J.Physiol.281, R666-R672 (2001). 8 Prunet-Marcassus, B. et al. Melatonin reduces body weight gain in Sprague-Dawley rats with
diet-induced obesity. Endocrinology (2003).
9 Ahmad Agil, M. N.-A., Rosario Ruiz, Sawsan Abuhamadah, Mohamad-Yehia El-Mir
andGumersindo Fernández Vázquez. Beneficial effects of melatonin on obesity and lipid profile in young Zucker diabetic fatty rats. Journal of Pineal Research50, 207-211 (2003).
10 Terrón MP, D.-A. J., Pariente JA, Barriga C, Paredes SD, Rodríguez AB. Melatonin reduces body weight gain and increases nocturnal activity in male Wistar rats. physiol Behav118, 8-13 (2013). 11 Bartness, T. J. & Goldman, B. D. Peak duration of serum melatonin and short day responses in
adult Siberian hamsters. Am.J.Physiol.255, R812-R822 (1988).
12 Bartness, T. J. & Goldman, B. D. Effects of melatonin on long day responses in short day-housed adult Siberian hamsters. Am.J.Physiol.255, R823-R830 (1988).
13 Moore, R. Y. Neural control of the pineal gland. Behavioral Brain Research73, 125-130 (1996). 14 Bartness, T. J., Demas, G. E. & Song, C. K. Seasonal changes in adiposity: the roles of the
photoperiod, melatonin and other hormones and the sympathetic nervous system.
Exp.Biol.Med.227, 363-376 (2002).
15 Egan, J. J. et al. Mechanism of hormone-stimulated lipolysis in adipocytes: translocation of hormone-sensitive lipase to the lipid storage droplet. Proc.Natl.Acad.Sci.U.S.A89, 8537-8541 (1992).
16 Shrestha, Y. B. et al. Central melanocortin stimulation increases phosphorylated perilipin A and hormone-sensitive lipase in adipose tissues. Am.J Physiol Regul.Integr.Comp Physiol299, R140-R149, doi:ajpregu.00535.2009 [pii];10.1152/ajpregu.00535.2009 [doi] (2010).
17 Zhao, J., Unelius, L., Bengtsson, T., Cannon, B. & Nedergaard, J. Coexisting beta-adrenoceptor subtypes: significance for thermogenic process in brown fat cells. Am.J.Physiol267, C969-C979 (1994).
18 Nedergaard, J., Bengtsson, T. & Cannon, B. Unexpected evidence for active brown adipose tissue in adult humans. Am.J.Physiol Endocrinol.Metab293, E444-E452, doi:00691.2006
[pii];10.1152/ajpendo.00691.2006 [doi] (2007).
19 Petrovic, N. et al. Chronic peroxisome proliferator-activated receptor gamma (PPARgamma) activation of epididymally derived white adipocyte cultures reveals a population of
20 Jastroch, M., Hirschberg, V. & Klingenspor, M. Functional characterization of UCP1 in mammalian HEK293 cells excludes mitochondrial uncoupling artefacts and reveals no contribution to basal proton leak. Biochim.Biophys.Acta1817, 1660-1670, doi:S0005-2728(12)00183-1 [pii];10.1016/j.bbabio.2012.05.014 [doi] (2012).
21 BB, L. PPARgamma: an essential regulator of adipogenesis and modulator of fat cell function.
Cell99 239-242 (1999).
22 Wu, Z. et al. Mechanisms controlling mitochondrial biogenesis and respiration through the thermogenic coactivator PGC-1. Cell98, 115-124 (1999).
23 Bostrom, P. et al. A PGC1-[agr]-dependent myokine that drives brown-fat-like development of white fat and thermogenesis. Natureadvance online publication, doi:10.1038/nature10777 (2012).
24 Himms-Hagen, J. et al. Effect of CL-316,243, a thermogenic beta-3 agonist, on energy balance and brown and white adipose tissues in rats. Am.J.Physiol.266, R1371-R1382 (1994).
25 Atgie, C., Faintrenie, G., Carpene, C., Bukowiecki, L. J. & Geloen, A. Effects of chronic treatment with noradrenaline or a specific beta3-adrenergic agonist, CL 316 243, on energy expenditure and epididymal adipocyte lipolytic activity in rat. Comp Biochem.Physiol A Mol.Integr.Physiol
119, 629-636 (1998).
26 Gabaldón AM, M. R., Horwitz BA. Effects of age, gender, and senescence on beta-adrenergic responses of isolated F344 rat brown adipocytes in vitro. Am.J Physiol274, 726-736 (1998). 27 Wu, J. et al. Beige adipocytes are a distinct type of thermogenic fat cell in mouse and human.
Cell150, 366-376, doi:S0092-8674(12)00595-8 [pii];10.1016/j.cell.2012.05.016 [doi] (2012). 28 Leitner, C. & Bartness, T. J. An intact dorsomedial hypothalamic nucleus, but not the subzona
incerta or reuniens nucleus, is necessary for short-day melatonin signal-induced responses in Siberian hamsters. Neuroendocrinology93, 29-39, doi:000320474 [pii];10.1159/000320474 [doi] (2011).
29 Maywood, E., Bittman, E. L. & Hastings, M. H. Lesions of the melatonin- and
androgen-responsive tissue of the dorsomedial nucleus of the hypothalamus block the gonadal response of male Syrian hamsters to programmed infusions of melatonin. Biology of Reproduction54, 470-477 (1996).
30 Bi, S. & Li, L. Browning of white adipose tissue: role of hypothalamic signaling. Ann.N.Y.Acad.Sci.
1302, 30-34, doi:10.1111/nyas.12258 [doi] (2013).
31 Song, C. K., Bartness, T. J., Petersen, S. L. & Bittman, E. L. Co-expression of melatonin (MEL1a) receptor and arginine vasopressin mRNAs in the Siberian hamster suprachiasmatic nucleus. J
Neuroendocrinol.12, 627-634 (2000).
32 Jiménez-Aranda A, F.-V. G., Campos D, Tassi M, Velasco-Perez L, Tan DX, Reiter RJ, Agil A. Melatonin induces browning of inguinal white adipose tissue in Zucker diabetic fatty rats.
journal of Pineal Research55, 416-423 (2013).
33 Leitner, C. & Bartness, T. J. Distributed forebrain sites mediated melatonin-induced short-day responses in Siberian hamsters. Endocrinology151, 3133-3140, doi:en.2010-0002
[pii];10.1210/en.2010-0002 [doi] (2010).
34 Wolden-Hanson, T. et al. Daily melatonin administration to middle-aged male rats suppresses body weight, intraabdominal adiposity, and plasma leptin and insulin independent of food intake and total body fat. Endocrinology141, 487-497 (2000).
35 Bartness, T. J. & Wade, G. N. Body weight, food intake and energy regulation in exercising and melatonin-treated Siberian hamsters (Phodopus sungorus sungorus). Physiology and Behavior
36 Demas, G. E., Bowers, R. R., Bartness, T. J. & Gettys, T. W. Photoperiodic regulation of gene expression in brown and white adipose tissue of Siberian hamsters (Phodopus sungorus).