https://doi.org/10.5194/hess-23-4955-2019 © Author(s) 2019. This work is distributed under the Creative Commons Attribution 4.0 License.
Assessing water security in the São Paulo metropolitan region under
projected climate change
Gabriela Chiquito Gesualdo1, Paulo Tarso Oliveira1, Dulce Buchala Bicca Rodrigues1, and Hoshin Vijai Gupta2 1Federal University of Mato Grosso do Sul, CxP 549, Campo Grande, MS, 79070-900, Brazil
2Department of Hydrology & Atmospheric Sciences, The University of Arizona, Tucson, AZ, USA Correspondence:Paulo Tarso Oliveira (paulotarsoms@gmail.com)
Received: 28 March 2019 – Discussion started: 15 April 2019
Revised: 31 August 2019 – Accepted: 5 November 2019 – Published: 4 December 2019
Abstract.Climate change affects the global water cycle and has the potential to alter water availability for food–energy– water production, and for ecosystems services, on regional and local scales. An understanding of these effects is cru-cial for assessing future water availability, and for the devel-opment of sustainable management plans. Here, we inves-tigate the influence of anticipated climate change on water security in the Jaguari Basin, which is the main source of freshwater for 9 million people in the São Paulo metropoli-tan region (SPMR). First, we calibrate and evaluate a hy-drological model using daily observed data, obtaining sat-isfactory coefficient of determination and Kling–Gupta effi-ciency values for both periods. To represent possible climate change scenarios up to 2095, we consider two International Panel on Climate Change (IPCC) Representative Concentra-tion Pathways (RCP4.5 and RCP8.5) and use an ensemble of future projections generated by 17 general circulation mod-els (GCMs). These data were used to drive the hydrological model to generate projected scenarios of streamflow. We then used indicators of water scarcity and vulnerability to carry out a quantitative analysis of provision probability. Our re-sults indicate that streamflow can be expected to exhibit in-creased interannual variability, significant increases in flow rate between January and March, and a 2-month extension of the hydrological dry season (currently June to September) until November. The latter includes a more than a 35 % re-duction in streamflow during September through November (with a > 50 % reduction in October). Our findings indicate an increased risk of floods and droughts accompanied by an expansion of the basin critical period, and our analysis of the water security indices identifies October and November as the most vulnerable months. Overall, our analysis exposes
the fragility of water security in the São Paulo metropolitan region, and provides valuable technical and scientific infor-mation that can be used to guide regional plans and strategies to cope with potential future water scarcity.
1 Introduction
Achieving a sustainable equilibrium between water avail-ability and demand is among the major socio-environmental challenges faced by the 21st century (Rockström et al., 2009; Vörösmarty et al., 2010). Demand for water is increasing due to population growth and the need for agricultural and energy production to keep pace (FAO, 2015; IEA, 2016; United Na-tions, 2015). It has been projected that 1.8 million people around the world will experience a state of absolute water scarcity by 2025 (WWDR, 2015). Meanwhile, the percent-age of water consumption for energy and food production is expected to increase dramatically (IEA, 2011). Further, it is estimated that by 2050 there will be a 100 % increase in demand for food production in developing countries (FAO, 2011).
and widespread in regions of the world that already face chal-lenges of drought and water scarcity, such as India (Sinha et al., 2016), Australia (van Dijk et al., 2013) and Catalo-nia (Martin-Ortega et al., 2012). In CaliforCatalo-nia, in the United States, signs of extreme drought observed at the beginning of 2014 (the driest and hottest of the 119 years on record) led the governor to proclaim a state of emergency (Shevah, 2015).
Southeastern Brazil has suffered two major droughts since 2000. The first, in the early 2000s, was responsible for a major energy crisis, leading to power rationing and black-outs, partly attributed to limited transmission and intercon-nection (Rosa and Lomardo, 2004). More recently, the 2013– 2014 drought compromised the water supply of approxi-mately 9 million people in the São Paulo metropolitan region (SPMR) (Marengo et al., 2015); this was the warmest and driest period since 1951 (Nobre et al., 2016). In particular, low rainfall amounts during the rainy season led to an abrupt decline in water supply capacity. In the state of São Paulo, the management council of the Piracicaba, Capivarí and Jun-diaí basins (PCJ) proposed that initiatives should be taken and reinforced to promote studies of climate change effects on water supply (CBH-PCJ, 2016).
The quantification of water availability and its vulnerabil-ity play a crucial role in the definition and implementation of sustainable water management in a changing environment (Veettil and Mishra, 2016). In this context, some methods for water security investigation have been developed (Dadson et al., 2017; Faramarzi et al., 2009; van Ginkel Kees et al., 2018; James and Shafiee-Jood, 2017; Scott et al., 2013; Srinivasan et al., 2017; Veettil and Mishra, 2016, 2018). Water security incorporates several concepts related to water, characterizing the interactions between hydro-climatic conditions, ecosys-tem functioning and societal needs (Scott et al., 2013). Like-wise, it is intrinsically associated with a society’s ability to adapt to extreme events, especially when anticipating peri-ods of scarcity (Taffarello et al., 2016).
To facilitate the assessment of water security, Rodrigues et al. (2014) developed a new framework, based on water scarcity and vulnerability, that takes a quantitative analysis of the probability of water provision into account. This ap-proach is conceptually useful for better understanding the effects of global and regional projections on water security, by considering scenarios of water demand and nonstationary and stationary climate. To date, however, the approach has not been applied in the context of scenarios of changing cli-mate. Despite an increasing understanding of the importance of water security and its impacts on hydrological and societal perspectives (Didovets et al., 2017; Gunda et al., 2019), few studies exist that integrate the impacts of changing climate on water security. While an assessment of water security in the context of climate change is a clear Brazilian public concern, and several studies have focused on understanding the rea-sons for drought, quantifying the economic losses involved and providing alerts regarding possible future drought events
in the southeastern region of Brazil (Coelho et al., 2016; Es-cobar, 2015; Getirana, 2015; Melo et al., 2016), none have explored the relationship between water security and climate change in the São Paulo metropolitan Region (SPMR).
In this study, we seek to fill this gap in the literature, by investigating the impacts of anticipated climate change on water security in the SPMR. We quantify the relationship be-tween climate and streamflow using the HYMOD lumped conceptual model run at a daily time step for the Jaguari River basin, the main contributor to the Cantareira water sup-ply system. Potential climate change scenarios are character-ized using data from an ensemble of 17 general circulation models (GCMs) forced by two Representative Concentra-tion Pathways (RCP): RCP4.5 and RCP8.5. Scenarios of pro-jected streamflow until 2095 were generated, and analyzed using the water security indices developed by Rodrigues et al. (2014). The results characterize the potential impacts of climate change on water security for the SPMR, and will be useful for guiding basin water security plans and strategies. In particular, the approach enables us to identify the likely most secure and insecure periods.
2 Material and methods 2.1 Study area
The Jaguari River basin, located in southeastern Brazil be-tween the states of São Paulo and Minas Gerais (drainage area of 970 km2, elevation 880 m a.m.s.l.), is the main basin supplying water to the Cantareira system. Located upstream of the Jaguari–Jacareí reservoir, within the Piracicaba River basin (Fig. 1), the climate is humid subtropical, according to the Köppen climate classification, characterized by hot and wet summers (October to March) and dry winters (June to September) (Alvares et al., 2013). The average annual rain-fall and temperature are 1592 mm and 25◦C, respectively (Rodríguez-Lado et al., 2007). Pasture used for livestock production (70 %) is predominant, and the remaining natu-ral vegetation accounts for 12 % and 8 % of the respective eucalyptus and pine of forest wood crops. Urban areas and agriculture regions represent 3 % and 2 %, respectively, while bare soil accounts for the final 5 %.
Figure 1.Location and land cover of study area for the reference year of 2010.
2.2 Study delineation
The water security analysis was carried out in three steps as shown in Fig. 2. First, we calibrated the HYMOD model to the Jaguari River basin and evaluated its performance using historical daily hydrometeorological data from 1990 to 2008. In the second step, streamflow scenario projections were generated for three future periods (2010–2040, 2041–2070 and 2071–2095) using an ensemble of 17 general circula-tion models (GCMs) forced by two emissions levels (RCP4.5 and RCP8.5). In the third step, the information generated was used to perform a water security evaluation for the fu-ture periods, using the water scarcity and water vulnerability indicators to contrast water use (abstraction and consump-tion) against probabilistic levels of water provision, which is based on the environmental flow requirement. These in-dicators are used to investigate potential scenarios of water demand and climate uncertainties. Therefore, our study aims to provide a water-security perspective to support planning in the SPMR area, which has been highly based on surface water resources.
2.3 Hydrological modeling
HYMOD is a lumped conceptual “rainfall excess” type of catchment system model, driven by precipitation (mm) and potential evapotranspiration (mm) time series data as inputs, and generating streamflow estimates as output (Boyle, 2000; Wagener et al., 2001). Soil water partitioning into precipita-tion excess, surface soil moisture storage and evapotranspira-tion is modeled using a nonlinear soil moisture tank, and two parallel flow paths (a cascade of quick flow tanks to route sur-face runoff, and a slow flow tank to represent baseflow gen-eration) are used to model the fast and slow components of streamflow response; more details about the HYMOD model are available in the Supplement (Fig. S1).
suit-Figure 2.Study delineation. RCP denotes Representative Concen-tration Pathway and GCM represents global circulation models; P1 refers to the immediate future (2010–2040), P2 refers to intermedi-ate future (2041–2070) and P3 refers to distant future (2071–2095).
able level of hydrological process representation (Gong et al., 2013).
Execution of the model requires the specification of six system parameters, including the maximum capacity of soil moisture accounting tank (Huz), the degree of spatial vari-ability of soil moisture capacity within the catchment (β), the coefficient that divides the flow into two parts of slow and quick runoff (α), the number of quick flow routing tanks (Nq) and two parameters for the routing system that describe the residence times of the reservoirs (Ks and Kq). To cali-brate these parameters, and to evaluate the calicali-brated model, we used observed daily hydrologic data (rainfall and stream-flow) from 1991 to 2008 available from the São Paulo State Basic Sanitation Company (SABESP), provided by a net-work of five rain gauge stations and one streamflow gaug-ing station. Meteorological data (relative humidity, temper-ature, wind speed and cloudiness fraction), available from the National Institute of Meteorology (INMET) database, were used to compute estimates of potential evapotranspi-ration (ETo) using the ETo calculator software provided by the Food and Agriculture Organization of the United Na-tions (FAO), based on the Penman–Monteith FAO-56
equa-tion (Allen et al., 1998; FAO, 2009; Gupta et al., 2009). The datasets of streamflow, rainfall and ETo are available in the Supplement (S2).
When simulating the hydrological response for the period from 1991 to 2008 (17 years), the year 1990 was used as a spin-up period to minimize the effect of uncertainties in the initial storage conditions. The period from September 1991 to August 2000 was used for model calibration, and the pe-riod from September 2000 to November 2008 was used for performance evaluation. Calibration (adjustment) of the pa-rameters was performed automatically using the downhill simplex method (Nelder and Mead, 1965) to optimize the value of the coefficient of determination (R2) performance metric. The daily timescale results were evaluated using sev-eral statistical measures, includingR2, the ratio of the root-mean-square error to the standard deviation of measured data (RSR), the percent bias statistic (PBIAS (%)), and the Kling– Gupta efficiency (KGE) (Gupta et al., 2009).
2.4 Climate change scenarios
To evaluate the impacts of projected climate variabil-ity and change on water securvariabil-ity (as measured using the indices discussed in Sect. 2.5), we used the HY-MOD model to generate streamflow projections for the period from 2010 to 2095. For analytical purposes, we focused on three 30-year time slices: immediate future, 2010–2040 (P1); intermediate future, 2041–2070 (P2); and distant future, 2071–2095 (P3). An ensemble of 17 stochastically downscaled GCM model outputs (BCC-CSM 1.1, BCC-(BCC-CSM 1.1 m, CSIRO-Mk3.6.0, FIO-ESM, GFDL-CM3, GFDL-ESM2G, GFDL-ESM2M, GISS-E2-H, GISS-E2-R, HadGEM2-ES, LR, IPSL-CM5A-MR, MIROC-ESM, MIROC-ESM-CHEM, MIROC5, MRI-CGCM3 and NorESM1-M) was used to generate future cli-mate projections for the entire period (datasets of the ensem-bles are available in the Supplement, S3). We chose to use an ensemble, instead of any single model projection, to re-flect the range of uncertainties inherent to the current suite of GCMs, and also because reports have indicated that the ensembles, as a whole, provide superior performance to that of any individual model (Dhakal et al., 2018; Gleckler et al., 2008).
[image:4.612.67.266.59.375.2]cor-responding to the basin outlet, with a spatial resolution of 30 arcmin. We also assessed the results in terms of monthly averages, these being more common in the evaluation of cli-mate change data.
The specific scenarios used here are based on the Fifth As-sessment Report (AR5) published by the Intergovernmental Panel on Climate Change (IPCC) (IPCC, 2014). Two emis-sions levels were considered, corresponding to the RCP4.5 and RCP8.5. Briefly, RCP4.5 is considered an “interme-diate” scenario based on achieving a global forcing radi-ation of 4.5 W m−2 and a CO2-stabilized concentration of 650 ppm by the end of the century. Conversely, RCP8.5 is a “pessimistic” scenario, characterized by solar radiation increasing to 8.5 W m−2 and CO2 concentrations reaching 1370 ppm by 2100.
2.5 Assessment of water security
To assess water security, we used the approach developed by Rodrigues et al. (2014), in which water use (abstraction and consumption) is contrasted with probabilistic levels of water provision (Eq. 1), based on the fulfillment of environmental demand represented by an environmental flow requirement (EFR). Specifically, we applied the “blue water” part of the methodology, referring to the water flowing through surface and groundwater pathways that can be directly used for hu-man consumption (Reilly and Kroll, 2003; Hoekstra et al., 2011).
Water security was assessed using the water scarcity and water vulnerability indicators (Rodrigues et al., 2014). The water scarcity indicator (Eq. 2) assesses the impacts of water use on median water availability for consumption, while the water vulnerability indicator (Eq. 3) expresses the suscepti-bility of water withdrawal for human activities under low-flow, or drought-like, conditions:
water provision(i,x,t )=Q(x,t )EFR(i,x,t ); (1) water scarcity(i,x,t )= water consumption(x,t )
median water provision(i,x,t ); (2) water vulnerability(i,x,t )= water abstraction(x,t )
low water provision(i,x,t ); (3) where Q(x,t ) is the daily streamflow in the river (L3T−1, where T is the temporal resolution), and EFR(i,x,t ) is the fraction of river discharge maintained to meet EFR (L3T−1). Water consumption(x,t ) is the consumptive wa-ter use for human activities at a local scale. Similarly, water abstraction(x,t ) is the corresponding sum of water permits for abstraction within the basin. Finally, the me-dian water provision(i,x,t ) takes the 50th percentile of water provision(i,x,t )into account, and low water provision(i,x,t )is the low-flow volume of water provision (the 30th percentile). The EFR values used here were prescribed by the Water Resources Law of the study basin (São Paulo State, 1994; Minas Gerais State, 1999). The EFR is established by the
statistical 7 d, 10 year, low flow (Q7,10), which is the average annual 7 d minimum flow that is expected to be exceeded on average in 9 out of every 10 years, and is equivalent to the 10th percentile of the distribution of the 7 d annual minimum streamflow (Reilly and Kroll, 2003). Information about the current active water use permits and demand (water abstrac-tion and consumpabstrac-tion) was taken from the basin’s committee plan (COBRAPE, 2008).
We developed seven demand scenarios for future periods, approached as “threshold levels”, defined based on nonsta-tionary demand as a hypothesis representative of the popula-tion growth in the São Paulo metropolitan region. Initially, we varied the percentage of total demand in four scenar-ios (−20 %,−10 %,+10 % and+20 %) for the first period (2010–2040), and then, for the other periods (2041–2095) three more scenarios were implemented (+25 %,+30 % and +40 %). Among the established scenarios, two of them rep-resent decreasing demand due to the imposition of demand restrictions.
3 Results and discussion 3.1 Model performance
Figure 3 shows model streamflow performance results for the calibration (1991–2000) and evaluation (2000–2008) pe-riods. Performance during both the calibration and evaluation periods can be considered quite good, withR2and KGE val-ues both exceeding 0.8, indicating a relatively high degree of correspondence between the model simulations and the ob-servations (Gupta et al., 2009).
3.2 Hydrological responses of expected climate change impacts
The projected future period monthly average streamflow shows a higher interannual variability under both scenarios (RCP4.5 and RCP8.5) compared with the historical period from 1991 to 2008 (Fig. 4). It is characterized by increased streamflow during the summer (December to March), and de-creases in winter (June to September) and early spring (Octo-ber and Novem(Octo-ber). During the historical period the highest streamflows occurred in February, whereas in the projected future periods the highest values shift to January, reinforc-ing the fact that projected climate change does not just affect the intensity and duration of events but also their distribu-tion and periodicity. Projected monthly streamflow, precipi-tation, ETo and temperature datasets are available in the Sup-plement (S3).
Figure 3. (a)Statistics for model performance with regards to daily streamflow,(b)scatterplot graph for the calibration and evaluation periods and(c)observed and simulated time series at daily timescales during the calibration and evaluation periods. NSE refers to the Nash–Sutcliffe efficiency coefficient,R2is the coefficient of determination, RSR refers to the RMSE-observations standard deviation ratio, PBIAS (%) refers to the percent bias statistic, MSE refers to the mean squared error and KGE is the Kling–Gupta efficiency.
[image:6.612.113.485.64.304.2] [image:6.612.127.471.374.671.2]Likewise, December increases range from 29 % to 75 % com-pared with the historical period. These results indicate a clear pattern of climate extremes which, in this case, are likely to cause intensification of floods and landslides during the sum-mer periods (December to March). These findings corrobo-rate with reports from Nobre et al. (2011) and Marengo et al. (2013), who foresee an increase in the impacts on human health and the occurrence of natural disasters.
We also note that the hydrological dry season is projected to get longer, extending until November, with the driest month shifting from September to October. This manifests as a negative relative difference between historical and pro-jected streamflows from May to November, with more than a 50 % decrease in October and 35 % decreases in Septem-ber and NovemSeptem-ber. This indicates an increasing hydrological drought risk and an extension of the basin critical period (see Fig. 4), in a region that is already considered to be critical and unsustainable (Taffarello et al., 2018).
Interestingly, our results do not indicate any major dif-ferences in monthly average streamflow between the two different radiative scenarios (RCP4.5 and RCP8.5) (Fig. 4). The relative differences between historical and the projected streamflow are quite similar for both scenarios, and the changes in seasonal streamflow dynamics are similar for all three periods (immediate future, intermediate future and dis-tant future). Despite using variables at a daily time step, we assessed the results in terms of monthly averages on three 30-year time slices (P1, P2 and P3); therefore, the long-term monthly averages reveal similar values of monthly stream-flow scenarios. However, scenario RCP8.5 for the immedi-ate future and intermediimmedi-ate futures (P1 and P2) presents the largest values of streamflow for every month, whereas for the distant future (P3) it indicates streamflow values that are lower than under RCP4.5. For the distant future (P3), RCP8.5 is associated with decreased streamflow in December and in-creased streamflow in March. This might indicate a change in the wet season by the end of the century, accompanied by a trend of extended hydrological drought periods.
3.3 Water Security under climate change
The impact of future water security components on median water resources is accounted for by the scarcity indicator, whereas the vulnerability indicator considers the probability of low availability of water resources. Figure 5 shows the wa-ter security indicators computed under scenarios RCP4.5 and RCP8.5 for the three projected future periods. Each layer rep-resents a demand scenario, with the central line correspond-ing to the current level of demand and the different layers corresponding to demand varying from−20 % to+40 % of the current level.
For all three future periods, the water scarcity and wa-ter vulnerability indicators show quite similar patwa-terns, with-out major differences in the demand scenarios. The indices remain close to zero or are very low between December
and July, suggesting relatively secure levels of water provi-sioning during this period. All of the projections agree that the relatively insecure period falls during the critical sea-son from August to November. Under scenario RCP4.5, with the highest level of demand (+40 %), we project scarcity to reach 100 % in November during the intermediate future pe-riod (P2) but to decrease to slightly lower (but still critical) scarcity levels during the distant future period (P3). In con-trast, under scenario RCP8.5, the scarcity indicator continu-ally increases with time, reaching 1.6 (range of 0–2) under the highest demand level (+40 %) by the end of the century. This indicates that more serious and frequent droughts could occur at the end of the winter (September) and early spring (October and November) in the intermediate and distant fu-ture periods (P2 and P3).
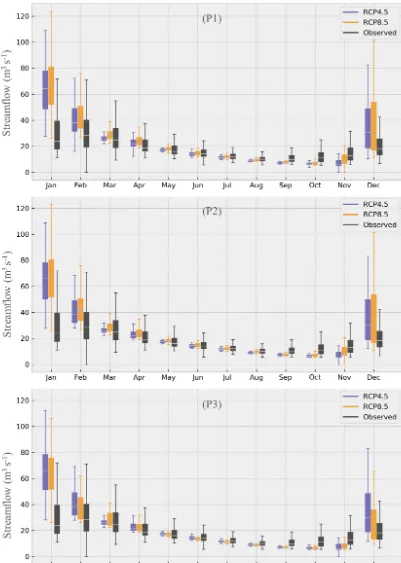
Of course, given these projections, high values of the vul-nerability indicator are to be expected, resulting from the dif-ference between the statistical measure of water provision for scarcity (50th percentile) and vulnerability (30th percentile) estimates. Therefore, scenario RCP4.5 results in maximum vulnerability for November in the intermediate and distant future periods (P2 and P3) under all of the demand levels, even though the lowest simulated monthly streamflow is no-ticed in October (see Fig. 4). This occurs because the pro-jected streamflow in early November is lower than October (see boxplots in Fig. 6), and thus does not meet the EFR in the first days of November, with consequent increasing monthly vulnerability and scarcity indices (dataset available in Supplement, S4). The same is noticed for RCP8.5 un-der the highest demand level (+40 %) in the distant future. Hence, even under the unlikely conditions that demand re-mains the same or decreases in the future, we can expect very high levels of water vulnerability.
These results project growing levels of insecurity towards the end of the century, with more pessimistic conditions un-der scenario RCP4.5 than unun-der RCP8.5, probably because RCP8.5 is expected to generate more intense rain. Thus, even though the monthly streamflow averages for both scenarios are very similar, the daily streamflow values associated with RCP8.5 are higher than in RCP4.5 for the immediate future and intermediate future (See Fig. 6). For the Cachoeira River basin, another reservoir in the Cantareira water supply sys-tem, Rodrigues et al. (2014) reported that the highest val-ues of scarcity and vulnerability for 1987–2009 were found to have occurred in September, whereas our results project the highest values occurring during October (RCP8.5) and November (RCP4.5), reinforcing the projected extension of hydrological dry season.
3.4 Planning for resilience
Figure 5.Water security indices:(a–c)the water scarcity indicator and(d–f)the water vulnerability indicator under consideration of two scenarios (RCP4.5 and RCP8.5) and three future periods (P1, P2 and P3).The thick line in the middle represents the current demand, and the layers represents the demand scenarios:−20 %,−10 %,+10 % and+20 % for P1; and 20 %,−10 %,+10 %,+20 %,+25 %,+30 % and +40 % for P2 and P3. P1 refers to the immediate future (2010–2040), P2 refers to the intermediate future (2041–2070) and P3 refers to the
occur again in the immediate future (Marengo et al., 2010; Milano et al., 2018). Note that Guzmám et al. (2017) high-lighted the highly complex nature of the SPMR drought risk, and the fragility of the local GDP given its heavy dependence on water for economic development.
Climate change has been considered to be responsible for 85 % of the dynamic involved in the increase of extreme rain-fall events (Dias et al., 2013). Furthermore, for the SPMR, Marengo et al. (2013) predict an increase in the frequency of intense rainfall, interspersed with dry periods that can last many months. Our results indicate a similar behavior for streamflow, with large amounts of streamflow during a wet-ter period (December, January and February) and a hydro-logical dry season extension (until November). In addition, we project the most water insecure months to be October and November.
Under the scenarios investigated here, we must anticipate the possibility of frequent water crises, and this must be taken into account if we are to achieve robust planning for wa-ter security and resilience. It is known that, without robust and efficient policy priorities in place, the consequences of a water crisis can be greatly extended (Batista Mattos et al., 2019). Historically, water crises periods have been charac-terized by speculation on water-related commerce, and have consequently resulted in significant increases in the prices of related goods (Batista Mattos et al., 2019). The 2015 SPMR water crisis serves as an alert that environmental negligence can trigger significant social, environmental and economic losses during times of climatic extremes (Dobrovolski and Rattis, 2015).
In other words, planning for water storage will be cru-cial. However, this can fail if the rivers that provide water for the production system do not themselves recover. Ehsani et al. (2017) recommends the implementation of holistic management strategies that consider the operation of dams and water use, and that environmental policies should be designed to meet the future needs of cities and metropoli-tan populations that need stable water supplies. This type of management is being implemented by the Brazilian Na-tional Water Security Plan, which projects an investment of USD 6.25 billion (average exchange rate of USD 1=BRL 4) in 114 public works (Ministry of Regional Development, 2019). The anticipated major challenge is to find new alter-natives to ensure water security in both quantity and quality. Our results corroborate this concern, and indicate that future surface water supplies may be insufficient to meet future de-mand; this has significant socioeconomic impacts given that access to safe and sufficient water is intrinsically linked to socioeconomic issues, including food security, health, eco-nomic growth and poverty alleviation (Sheva, 2015). There-fore, it is becoming increasingly urgent to think ahead about such situations and to find solutions to future water scarcity events. To date, most of the responses to water scarcity prob-lems have been to implement conventional approaches that focus on the supply side. It is increasingly evident that a more
integrated demand management approach will be needed to complement those.
SPMR planning in response to anticipated climatic changes must therefore consider adaptation strategies to deal with scarcity and vulnerability during the critical period of September to November. Possibilities include the diversifica-tion of water sources, including wastewater reuse, rainwater harvesting, and transfer of groundwater (from the Guarani Aquifer System). These will need to be accompanied by in-vestment in loss control, policies to reduce consumption and strategies for putting water into storage during times of rel-atively high availability (December to July). Such adapta-tions to promote water security will require a broad interdis-ciplinary approach that enhances watershed productivity and reservoir operation from water resource management while minimizing environmental and economic risks. Watershed plans considering soil and water conservation will need to be well designed and executed. In this context, payments for ecosystem services (PES) can be a suitable mid-to long-term solution to provide soil and water conservation, guarantee forest restoration and river flow rate regulation, and improve water quality (Pagiola et al., 2007; Rodríguez Osuna et al., 2014; Zolin et al., 2014). The use of soil and water con-servation approaches in watersheds have been shown to be valuable, in the context of water production, as reported by Pires (2004) and Sone et al. (2019).
From the mid- to long-term time perspective, it becomes clear that the conventional paradigm of treating water simply as a resource to harvest and redistribute to meet economic demand is proving to be strongly limited and inherently con-tradictory (Lobanova et al., 2017). The future will require not just a change in management practices, but above all also a change in the way that water resources and rivers are per-ceived. Given their nature, they should be treated as adaptive, fragile and complex systems, whose management requires strong public participation and knowledge integration. An integrated and participative approach to water resource man-agement can stimulate dialogue, promote improved practices and reframe the view of water as being a limited resource.
4 Conclusions
17 global climate models (GCMs) forced by two emissions levels (RCP4.5 and RCP8.5), to drive a streamflow model.
The results indicate that streamflow can be expected to be characterized by higher interannual variability under all climate change scenarios, with significant increases in Jan-uary to March. Further, the hydrological dry season (cur-rently June to September) can be expected to extend until November. Overall, this indicates an increasing risk of both flooding and drought, and a lengthening of the basin critical period.
Viewed through the lens of the water security indices, the perspective is one of increasing water insecurity, with more pessimistic conditions under scenario RCP4.5. October and November can be expected to be the most vulnerable months, with water scarcity reaching critical levels in the intermediate (2041–2070) and distant future (2071–2095) periods. In con-trast, the period from December to June is likely to remain relatively secure, with water scarcity and water vulnerability levels being close to zero. This annual pattern of variation from highly secure to highly insecure reveals the fragility of the basin, and indicates the conditions that adaptation strate-gies must be designed to address.
To conclude, there is an urgent need for SPMR water au-thorities to be aware of the future risks to water security, and to respond by implementing efficient mitigation and adap-tation policies that recognize the annual pattern of variation between insecure and secure periods. The results presented here can support the regional government in developing poli-cies to maximize water security. Future work will continue to apply the methodology reported to the other three basins of the Cantareira water supply system, with a view to devel-oping a more complete understanding of the entire system.
Data availability. The datasets underlying this research are avail-able in Supplement (S1, S2, S3 and S4) of this paper.
Supplement. The supplement related to this article is available on-line at: https://doi.org/10.5194/hess-23-4955-2019-supplement.
Author contributions. GCG was responsible for conceptualizing the study, data curation, formal analysis, and preparing and writing the original draft of the paper. PTO was responsible for conceptu-alizing the study, data curation, formal analysis, review and editing the paper, and the project administration. DBBR and HVG were responsible for the formal analysis, review and editing the paper, visualization and supervision.
Competing interests. The authors declare that they have no conflict of interest.
Acknowledgements. This study was supported by grants from the Ministry of Science, Technology, Innovation and Communication, MCTIC, and the National Council for Scientific and Technological Development, CNPq (grant nos. 441289/2017-7 and 306830/2017-5), as well as the Coordenação de Aperfeiçoamento de Pessoal de Nível Superior – Brazil – CAPES (finance code 001 CAPES PrInt program).
Financial support. This research has been supported by the Min-istry of Science, Technology, Innovation and Communication, MC-TIC, and the National Council for Scientific and Technological De-velopment, CNPq (grant nos. 441289/2017-7 and 306830/2017-5).
Review statement. This paper was edited by Anas Ghadouani and reviewed by Geoff Pegram and one anonymous referee.
References
Allen, R. G., Pereira, L. S., Raes, D., and Smith, M.: Crop evapo-transpiration: guidelines for computing crop water requirements, FAO Irrigation and drainag, Food and Agriculture Organization, Rome, 1998.
Alvares, C. A., Stape, J. L., Sentelhas, P. C., de Moraes Gonçalves, J. L., and Sparovek, G.: Köppen’s climate classification map for Brazil, Meteorol. Z., 22, 711–728, https://doi.org/10.1127/0941-2948/2013/0507, 2013.
Asadieh, B. and Krakauer, N. Y.: Global change in streamflow ex-tremes under climate change over the 21st century, Hydrol. Earth Syst. Sci., 21, 5863–5874, https://doi.org/10.5194/hess-21-5863-2017, 2017.
Bastola, S. and Misra, V.: Evaluation of dynamically downscaled reanalysis precipitation data for hydrological application, Hy-drol. Process., 28, 1989–2002, https://doi.org/10.1002/hyp.9734, 2014.
Batista Mattos, J., Brito Silva, K., da Silva, R. J., Mota Almeida, T. H., Sibilla Soares Póvoas, H., da Silva, P. V. R., de Araújo Góes, I. M., and da Silva Matos, I.: Natural factors or envi-ronmental neglect? Understanding the dilemma of a water cri-sis in a scenario of water plenty, Land Use Policy, 82, 509–517, https://doi.org/10.1016/j.landusepol.2018.12.027, 2019. Boyle, D. P.: Multicriteria calibration of hydrological models, Dep.
of Hydrology and Water Resources, Univ. of Arizona, Tucson, Arizona, 2000.
Chen, H., Yang, D., Hong, Y., Gourley, J. J., and Zhang, Y.: Hydro-logical data assimilation with the Ensemble Square-Root-Filter: Use of streamflow observations to update model states for real-time flash flood forecasting, Adv. Water Resour., 59, 209–220, https://doi.org/10.1016/j.advwatres.2013.06.010, 2013. COBRAPE: Plano das Bacias Hidrográficas dos Rios Piracicaba,
Capivari e Jundiaí 2010 a 2020, São Paulo, 2008.
Comitês das Bacias Hidrográficas dos Rios Piracicaba, Capivari e Jundiaí (CBH-PCJ): Relatório da Situação do Recursos Hídricos 2016, Ano base: 2015, São Paulo, 2016.
P. D., and Rehbein, A.: The 2014 southeast Brazil austral sum-mer drought: regional scale mechanisms and teleconnections, Clim. Dynam., 46, 3737–3752, https://doi.org/10.1007/s00382-015-2800-1, 2016.
Crosbie, R. S., McCallum, J. L., Walker, G. R., and Chiew, F. H. S.: Modelling climate-change impacts on groundwater recharge in the Murray-Darling Basin, Australia, Hydrogeol. J., 18, 1639– 1656, https://doi.org/10.1007/s10040-010-0625-x, 2010. Dadson, S., Hall, J. W., Garrick, D., Sadoff, C., Grey, D., and
Whit-tington, D.: Water security, risk, and economic growth: Insights from a dynamical systems model, Water Resour. Res., 53, 6425– 6438, https://doi.org/10.1002/2017WR020640, 2017.
Debortoli, N. S., Camarinha, P. I. M., Marengo, J. A., and Ro-drigues, R. R.: An index of Brazil’s vulnerability to expected increases in natural flash flooding and landslide disasters in the context of climate change, Nat. Hazards, 86, 557–582, https://doi.org/10.1007/s11069-016-2705-2, 2017.
Dhakal, K., Kakani, V. G., and Linde, E.: Climate Change Impact on Wheat Production in the Southern Great Plains of the US Using Downscaled Climate Data, Atmospheric and Climate Sciences, 08, 143, https://doi.org/10.4236/acs.2018.82011, 2018.
Dias, M. A. F. S., Dias, J., Carvalho, L. M. V., Freitas, E. D., and Silva Dias, P. L.: Changes in extreme daily rain-fall for São Paulo, Brazil, Climatic Change, 116, 705–722, https://doi.org/10.1007/s10584-012-0504-7, 2013.
Didovets, I., Lobanova, A., Bronstert, A., Snizhko, S., Maule, C. F., and Krysanova, V.: Assessment of Climate Change Im-pacts on Water Resources in Three Representative Ukrainian Catchments Using Eco-Hydrological Modelling, Water, 9, 204, https://doi.org/10.3390/w9030204, 2017.
Dobrovolski, R. and Rattis, L.: Water collapse in Brazil: the danger of relying on what you neglect, Natureza & Conservação, 13, 80–83, https://doi.org/10.1016/j.ncon.2015.03.006, 2015. Ehsani, N., Vörösmarty, C. J., Fekete, B. M., and Stakhiv, E.
Z.: Reservoir operations under climate change: Storage ca-pacity options to mitigate risk, J. Hydrol., 555, 435–446, https://doi.org/10.1016/j.jhydrol.2017.09.008, 2017.
Escobar, H.: Drought triggers alarms in Brazil’s biggest metropolis, Science, 347, 812–812, https://doi.org/10.1126/science.347.6224.812, 2015.
Faramarzi, M., Abbaspour, K. C., Schulin, R., and Yang, H.: Mod-elling blue and green water resources availability in Iran, Hydrol. Process., 23, 486–501, https://doi.org/10.1002/hyp.7160, 2009. Food and Agriculture Organization (FAO): ETo Calculator, Land
and Water Digital Media Series, no. 36, FAO, Rome, Italy, 2009. Food and Agriculture Organization (FAO): Energy Smart Food for
People and Agriculture, Rome, Italy, 2011.
Food and Agriculture Organization (FAO): The State of Food Inse-curity in the World 2015, Intl. Food for Agric. Dev. World Food Program, Rome, Italy, 2015.
Getirana, A.: Extreme Water Deficit in Brazil Detected from Space, J. Hydrometeor., 17, 591–599, https://doi.org/10.1175/JHM-D-15-0096.1, 2015.
Gleckler, P. J., Taylor, K. E., and Doutriaux, C.: Performance met-rics for climate models, J. Geophys. Res.-Atmos., 113, D06104, https://doi.org/10.1029/2007JD008972, 2008.
Gong, W., Gupta, H. V., Yang, D., Sricharan, K., and Hero, A. O.: Estimating epistemic and aleatory uncertainties during hydro-logic modeling: An information theoretic approach, Water
Re-sour. Res., 49, 2253–2273, https://doi.org/10.1002/wrcr.20161, 2013.
Gunda, T., Hess, D., Hornberger, G. M., and Worland, S.: Water se-curity in practice: The quantity-quality-society nexus, Water Se-curity, 6, 100022, https://doi.org/10.1016/j.wasec.2018.100022, 2019.
Gupta, H. V., Kling, H., Yilmaz, K. K., and Martinez, G. F.: Decom-position of the mean squared error and NSE performance criteria: Implications for improving hydrological modelling, J. Hydrol., 377, 80–91, https://doi.org/10.1016/j.jhydrol.2009.08.003, 2009. Guzmám, D. A., Mohor, G. S., Taffarello, D., and Mendiondo, E. M.: Economic impacts of drought risks for water utili-ties through Severity-Duration-Frequency framework under cli-mate change scenarios, Hydrol. Earth Syst. Sci. Discuss., https://doi.org/10.5194/hess-2017-615, 2017.
Haddad, E. A. and Teixeira, E.: Economic impacts of natural disasters in megacities: The case of 604 floods in Sao Paulo, Brazil, Habitat Int., 45, 106–113, https://doi.org/10.1016/j.habitatint.2014.06.023, 2015.
Hoekstra, A. Y., Mekonnen, M. M., Aldaya, M. M., and Chapa-gain, A. K: The Water Footprint Assessment Manual: Setting the Global Standard Routledge, 2011.
International Energy Agency (IEA): The IEA Model of Short-term Energy Security (MOSES) Primary Energy Sources and Sec-ondary Fuels Working Paper, OECD/IEA, Paris, 2011.
International Energy Agency (IEA): World Energy Outlook 2016 Energy Access Database, Cedex, France, available at: http:// www.iea.org/weo (last access: 28 November 2017), 2016. International Panel on Climate Change (IPCC): Climate Change
2014: Impacts, Adaptation, and Vulnerability. Part B: Regional Aspects. Contribution of Working Group II to the Fifth Assess-ment Report of the IntergovernAssess-mental Panel on Climate Change, edited by: Barros, V. R., Field, C. B., Dokken, D. J., Mastran-drea, M. D., Mach, K. J., Bilir, T. E., Chatterjee, M., Ebi, K. L., Estrada, Y. O., Genova, R. C., Girma, B., Kissel, E. S., Levy, A. N., MacCracken, S., Mastrandrea, P. R., and White, L. L., 2014. Ionita, M., Tallaksen, L. M., Kingston, D. G., Stagge, J. H., Laaha, G., Van Lanen, H. A. J., Scholz, P., Chelcea, S. M., and Haslinger, K.: The European 2015 drought from a clima-tological perspective, Hydrol. Earth Syst. Sci., 21, 1397–1419, https://doi.org/10.5194/hess-21-1397-2017, 2017.
James, L. D. and Shafiee-Jood, M.: Interdisciplinary informa-tion for achieving water security, Water Security, 2, 19–31, https://doi.org/10.1016/j.wasec.2017.10.001, 2017.
Jones, P. G. and Thornton, P. K.: MarkSim: Software to Generate Daily Weather Data for Latin America and Africa, Agron. J., 92, 445–453, https://doi.org/10.2134/agronj2000.923445x, 2000. Jones, P. G. and Thornton, P. K.: Generating downscaled
weather data from a suite of climate models for agri-cultural modelling applications, Agr. Syst., 114, 1–5, https://doi.org/10.1016/j.agsy.2012.08.002, 2013.
Liu, J., Yang, H., Gosling, S. N., Kummu, M., Flörke, M., Pfister, S., Hanasaki, N., Wada, Y., Zhang, X., Zheng, C., Alcamo, J., and Oki, T.: Water scarcity assessments in the past, present, and future, Earth’s Future, 5, 545–559, https://doi.org/10.1002/2016EF000518, 2017.
of the headwaters of the Tagus River, J. Hydrol., 548, 436–447, https://doi.org/10.1016/j.jhydrol.2017.03.015, 2017.
Mandal, S. and Simonovic, S. P.: Quantification of uncer-tainty in the assessment of future streamflow under chang-ing climate conditions, Hydrol. Process., 31, 2076–2094, https://doi.org/10.1002/hyp.11174, 2017.
Marengo, J. A., Ambrizzi, T., da Rocha, R. P., Alves, L. M., Cuadra, S. V., Valverde, M. C., Torres, R. R., Santos, D. C., and Fer-raz, S. E. T.: Future change of climate in South America in the late twenty-first century: intercomparison of scenarios from three regional climate models, Clim. Dynam., 35, 1073–1097, https://doi.org/10.1007/s00382-009-0721-6, 2010.
Marengo, J. A., Valverde, M. C., and Obregon, G. O.: Ob-served and projected changes in rainfall extremes in the Metropolitan Area of São Paulo, Clim. Res., 57, 61–72, https://doi.org/10.3354/cr01160, 2013.
Marengo, J. A., Nobre, C. A., Seluchi, M., Cuartas, A., Alves, L. M., Mendiondo, E. M., Obregón, G., and Sampaio, G.: A seca e a crise hídrica de 2014–2015 em São Paulo, Rev. 659 USP 116, 31–44. https://doi.org/10.11606/issn.2316-9036.v0i106p31-44, 2015.
Martin-Ortega, J., González-Eguino, M., and Markandya, A.: The costs of drought: the 2007/2008 case of Barcelona, Water Policy, 14, 539–560, https://doi.org/10.2166/wp.2011.121, 2012. Melo, D. D. C. D., Scanlon, B. R., Zhang, Z., Wendland, E., and
Yin, L.: Reservoir storage and hydrologic responses to droughts in the Paraná River basin, south-eastern Brazil, Hydrol. Earth Syst. Sci., 20, 4673–4688, https://doi.org/10.5194/hess-20-4673-2016, 2016.
Milano, M., Reynard, E., Muniz-Miranda, G., and Guerrin, J.: Wa-ter Supply Basins of São Paulo Metropolitan Region: Hydro-Climatic Characteristics of the 2013–2015 Water Crisis, Water, 10, 1517, https://doi.org/10.3390/w10111517, 2018.
Minas Gerais State: Lei no. 13.199 de 29 de janeiro de 1999. Dis-pões sobre a Política Estadual de Recursos Hídricos e das outras providências, available at: http://progestao.ana.gov.br/portal/ progestao/panorama-dos-estados/mg/lei-no13-199-99_mg.pdf (last access: 27 October 2017), 1999.
Ministry of Regional Development: Plano Nacional de Segurança Hídrica vai priorizar 114 obras para oferta de água, available at: http://www.mi.gov.br/desenvolvimento-regional, last access: 21 January 2019.
Nelder, J. A. and Mead, R.: A Simplex Method for Function Minimization, Comput. J., 7, 308–313, https://doi.org/10.1093/comjnl/7.4.308, 1965.
Nobre, C. A., Young, A. F., Saldiva, P. H. N., Orsini, J. A. M., No-bre, A. D., Ogura, A. T., and de Oliveira Rodrigues, G.: Vulnera-bility of Brazilian Megacities to Climate Change: The São Paulo Metropolitan Region (RMSP), in: Climate Change in Brazil: Economic, Social and Regulatory Aspects, edited by: Motta, R. S., Hargrave, J., Luedemann, G., and Gutierrez, M. B. S., 197– 219, Brasilia, 2011.
Nobre, C. A., Marengo, J. A., Seluchi, M. E., Cuartas, L. A., and Alves, L. M.: Some Characteristics and Impacts of the Drought and Water Crisis in Southeastern Brazil during 2014 and 2015, Journal of Water Resource and Protection, 8, 252–262, https://doi.org/10.4236/jwarp.2016.82022, 2016.
Pagiola, S., Ramírez, E., Gobbi, J., de Haan, C., Ibrahim, M., Mur-gueitio, E., and Ruíz, J. P.: Paying for the environmental services
of silvopastoral practices in Nicaragua, Ecol. Econ., 64, 374– 385, https://doi.org/10.1016/j.ecolecon.2007.04.014, 2007. Parra, V., Fuentes-Aguilera, P., and Muñoz, E.:
Identi-fying advantages and drawbacks of two hydrological models based on a sensitivity analysis: a study in two Chilean watersheds, Hydrolog. Sci. J., 63, 1831–1843, https://doi.org/10.1080/02626667.2018.1538593, 2018. Pires, M.: Watershed protection for a world city: the
case of New York, Land Use Policy, 21, 161–175, https://doi.org/10.1016/j.landusepol.2003.08.001, 2004. Reilly, C. F. and Kroll, C. N.: Estimation of 7-day, 10-year
low-streamflow statistics using baseflow correlation, Water Resour. Res., 39, 1236, https://doi.org/10.1029/2002WR001740, 2003. Rockström, J., Persson, Å., Nykvist, B., Walker, B., Folke, C., Wit,
C. A. de, Liverman, D., Lambin, E. F., Iii, F. S. C., Schellnhu-ber, H. J., Rodhe, H., Hansen, J., Foley, J. A., Richardson, K., Noone, K., Karlberg, L., Falkenmark, M., Scheffer, M., Crutzen, P., Snyder, P. K., Costanza, R., Corell, R. W., Leeuw, S. van der, Sörlin, S., Hughes, T., Lenton, T. M., Svedin, U., Fabry, V. J. and Steffen, W.: A safe operating space for humanity, Nature, 461, 472–475, https://doi.org/10.1038/461472a, 2009.
Rodrigues, D. B. B., Gupta, H. V., and Mendiondo, E. M.: A blue/green water-based accounting framework for assess-ment of water security, Water Resour. Res., 50, 7187–7205, https://doi.org/10.1002/2013WR014274, 2014.
Rodrigues, D. B. B., Gupta, H. V., Mendiondo, E. M., and Oliveira, P. T. S.: Assessing uncertainties in surface water security: An empirical multimodel approach, Water Resour. Res., 51, 9013– 9028, https://doi.org/10.1002/2014WR016691, 2015.
Rodríguez-Lado, L., Sparovek, G., Vidal-Torrado, P., Dourado-Neto, D., and Macías-Vázquez, F.: Modelling air temperature for the state of São Paulo, Brazil, Scientia Agricola, 64, 460–467, https://doi.org/10.1590/S0103-90162007000500002, 2007. Rodríguez Osuna, V., Börner, J., Nehren, U., Prado, R. B.,
Gaese, H., and Heinrich, J.: Priority areas for watershed service conservation in the Guapi-Macacu region of Rio de Janeiro, Atlantic Forest, Brazil, Ecol. Process., 3, 16, https://doi.org/10.1186/s13717-014-0016-7, 2014.
Rosa, L. P. and Lomardo, L. L. B.: The Brazilian energy crisis and a study to support building efficiency legislation, Energ. Buildings, 36, 89–95, https://doi.org/10.1016/j.enbuild.2003.09.001, 2004. São Paulo State: Lei no. 9.034 de 27 de dezembro de 1994,
Dis-põe sobre o Plano Estadual de Recursos Hídricos –PERH, a ser implantado no período 1994 e 1995, em conformidade com a Lei 7663, de 30 de dezembro de 1991, que instituiu normal de Orientação à Política Estadual de Recursos Hídricos, avail-able at: https://www.al.sp.gov.br/repositorio/legislacao/lei/1994/ lei-9034-27.12.1994.html (last access: 27 October 2017), 1994. Scott, C. A., Meza, F. J., Varady, R. G., Tiessen, H., McEvoy,
J., Garfin, G. M., Wilder, M., Farfán, L. M., Pablos, N. P., and Montaña, E.: Water Security and Adaptive Management in the Arid Americas, Ann. Assoc. Am. Geogr., 103, 280–289, https://doi.org/10.1080/00045608.2013.754660, 2013.
Shevah, Y.: Water Resources, Water Scarcity Challenges, and Per-spectives, in Water Challenges and Solutions on a Global Scale, vol. 1206, 185–219, American Chemical Society, 2015. Sinha, D., Syed, T. H., Famiglietti, J. S., Reager, J. T., and Thomas,
Observa-tions of Terrestrial Water Storage Deficit, J. Hydrometeorol., 18, 381–396, https://doi.org/10.1175/JHM-D-16-0047.1, 2016. Sone, J. S., Gesualdo, G. C., Zamboni, P. A. P., Vieira,
N. O. M., Mattos, T. S., Carvalho, G. A., Rodrigues, D. B. B., Alves Sobrinho, T., and Oliveira, P. T. S.: Water provisioning improvement through payment for ecosystem services, Sci. Total Environ., 655, 1197–1206, https://doi.org/10.1016/j.scitotenv.2018.11.319, 2019.
Srinivasan, V., Konar, M., and Sivapalan, M.: A dynamic framework for water security, Water Security, 1, 12–20, https://doi.org/10.1016/j.wasec.2017.03.001, 2017.
Taffarello, D., Mohor, G. S., Calijuri, M. C., and Mendiondo, E. M.: Field investigations of the 2013–14 drought through quali-quantitative freshwater monitoring at the headwaters of the Cantareira System, Brazil, Water Int., 41, 776–800, https://doi.org/10.1080/02508060.2016.1188352, 2016. Taffarello, D., Srinivasan, R., Mohor, G. S., Guimarães, J. L. B.,
do Carmo Calijuri, M., and Mendiondo, E. M.: Modeling fresh-water quality scenarios with ecosystem-based adaptation in the headwaters of the Cantareira system, Brazil, Hydrol. Earth Syst. Sci., 22, 4699–4723, https://doi.org/10.5194/hess-22-4699-2018, 2018.
United Nations: World Population Prospects: The 2015 Re-vision, Key Findings and Advance Tables, Working Pap. ESA/P/WP.241, United Nations Dept. of Econ. and Soc. Affairs (UNDESA), New York, 59 pp., 2015.
van Dijk, A. I. J. M., Beck, H. E., Crosbie, R. S., de Jeu, R. A. M., Liu, Y. Y., Podger, G. M., Timbal, B., and Viney, N. R.: The Mil-lennium Drought in southeast Australia (2001–2009): Natural and human causes and implications for water resources, ecosys-tems, economy, and society, Water Resour. Res., 49, 1040–1057, https://doi.org/10.1002/wrcr.20123, 2013.
van Ginkel Kees, C. H., Hoekstra Arjen Y., Buurman, J., and Hogeboom, R. J.: Urban Water Security Dash-board: Systems Approach to Characterizing the Water Security of Cities, J. Water Res. Pl., 144, 04018075, https://doi.org/10.1061/(ASCE)WR.1943-5452.0000997, 2018.
Veettil, A. V. and Mishra, A. K.: Water security assessment using blue and green water footprint concepts, J. Hydrol., 542, 589– 602, https://doi.org/10.1016/j.jhydrol.2016.09.032, 2016. Veettil, A. V. and Mishra, A. K.: Potential influence of
cli-mate and anthropogenic variables on water security using blue and green water scarcity, Falkenmark index, and fresh-water provision indicator, J. Environ. Manage., 228, 346–362, https://doi.org/10.1016/j.jenvman.2018.09.012, 2018.
Vörösmarty, C. J., Prusevich, A., Sullivan, C. A., Liermann, C. R., Dudgeon, D., Gessner, M. O., McIntyre, P. B., Green, P., Davies, P. M., Bunn, S. E., and Glidden, S.: Global threats to hu-man water security and river biodiversity, Nature, 467, 555–561, https://doi.org/10.1038/nature09440, 2010.
Wagener, T., Boyle, D. P., Lees, M. J., Wheater, H. S., Gupta, H. V., and Sorooshian, S.: A framework for development and applica-tion of hydrological models, Hydrol. Earth Syst. Sci., 5, 13–26, https://doi.org/10.5194/hess-5-13-2001, 2001.
Whately, M. and Cunha, C. P.: Um olhar sobre o maior manancial de água da região metropolitana de São Paulo, Sao Paulo, 2007. World Water Development Report (WWDR): The United Nations