2017 2nd International Conference on Artificial Intelligence and Engineering Applications (AIEA 2017)
ISBN: 978-1-60595-485-1
Research and Simulation of GPS Navigation Signals
ZELING CAO and QI WANG
ABSTRACT
There are most important strategic significance in our country as well as the carrier rocket, ballistic missiles, the development of the manned space engineering that GPS signal simulation of satellite navigation system has. The structure and principle of GPS navigation and positioning signal were discussed in detail in this paper, with practicality as the starting point, the navigation message is transmitted by the use of pseudo random noise code phase-modulated signal, and the method of direct sequence spread spectrum modulation system is used to simulate the signal of GPS satellite orbit based on the MATLAB/Simulink platform. Then the simulation research and analysis of C/A code and P code in the frequency domain and time domain with it`s correlation is carried on, at the same time, the C/A code frequency domain is captured by using the fast Fourier transform method (FFT).finally the space transmission characteristics of GPS signal is simulated under Gaussian noise.it is show that the simulation result is close to the theoretical value, and the accuracy is better.
KEYWORDS
GPS; MatLab; Pseudo-random noise code; FFT; Gaussian noise.
INTRODUCTION
GPS (Global Positioning System) System is based on satellite radio navigation and Positioning System, which has the interest in land, Marine, aviation and spaceflight, Global, all-weather, continuous and real-time navigation Positioning and timing functions, and it can provide all kinds of users with precision of three-dimensional coordinates, speed and timing services. It is the most mature technology who has practical a satellite navigation and positioning system. what`s more, currently, it has been widely used in topographic survey, traffic management, navigation, field exploration and other fields.
GPS satellite signal simulator can fully simulate carrier flight receiver encountered in the process of all kinds of complicated situation, provides the simulation results, improve the measurement scheme, effectively reduce the risk of use, improve the success rate of the test. This research has been carried out earlier in foreign country and has been successful, while the domestic sector is still blank in our country. Therefore, the development of GPS signal simulator has great strategic significance for the establishment and development of our satellite navigation system and carrier rocket, ballistic missile and manned space engineering.
_________________________________________
GPS SATELLITE ORBIT AND NUMBERING
The GPS constellation configuration includes 24 working satellites, which distributed in six orbital planes, with four satellites on each orbit [1]. The simulation of satellite orbit distribution is shown in figure 1.
Its characteristics are: the four satellites in each orbital plane are not evenly distributed, although the orbits of the orbits are evenly spaced, but the satellite spacing of each orbital plane is unequal. The advantage of this configuration contains first: it can achieve the best visibility of the satellite, that is, when a satellite fails, it will minimize the overall impact of the system and guarantee the stable work of the system. Second: this configuration ensures that a certain redundant satellite is available for observation in the higher latitudes.
In navigation, PRN Numbers are commonly used in satellites. the GPS satellite has its own numbering method according to the different purposes of the application. The PRN numbering method is used in this paper. By the end of 2008, the GPS system contains 31 in-orbit satellites, with a 2-32 PRN code number [1].
GPS SIGNAL STRUCTURE AND CHARACTERISTICS
The GPS satellite launch signals contain three components: carrier, ranging, and data (navigational cables).The range codes are pseudo-random codes C/A Code and Precise Code. The carrier signal use the L frequency band, which consists of L1 and L2 components. The center frequency of L1 is 1575.42 MHz, while L2 is 1227.6MHz. There are two advantages to choose L frequency: one is that its channel bandwidth is easy to allocate, and the other is the delay of the ionosphere. To better determine and compensate the delay caused by the ionospheric effect of different frequency signals GPS signal adopts the dual-frequency structure.
As it shown in figure 2, the baseline clock frequency of the GPS signal Use the frequency synthesizer to generate the various frequencies required. Two carrier [2] are:
L1 carrier: fL1154* f0 1575.42MHz , wavelengthL1 19.03cm;
[image:2.612.221.374.494.644.2]L2 carrier: fL2 120* f0 1227.60MHz , wavelengthL2 24.42cm.
Figure 2. GPS signal structure diagram.
Ranging code
The GPS provides two kinds of ranging codes: one is C/A code, for civilian use, the other is P code, only for authorized user (military protection password).
The C/A code is produced by two 10-bit shift registersG1andG2. The two registers
return to the whole 1 state under the influence of "1" pulse at the end of each Sunday [1]. The m sequenceG1andG2which code length isN210-11023and the period is 1ms
is generated by the driver of the clock whose code rate is 1.023MHz. The characteristic polynomial of G1andG2 is:
10 9 8 6 3 2 2
10 3 1
1 ) (
1 ) ( G
x x x x x x x
G
x x x
(1)
Based on these two polynomials, two determined m sequences are generated, then the Phase selector (Phase selector) is generated, which makes different GPS satellite C/A generators produce different C/A codes.
The two phase selectors ofG2are used to produce the delayed outputG2(tNiTc), and
then the C/A code is obtained by adding the two phasesG(1 t)andG2(tNiTc)also ccalled
C(t)G1(t)G2(tNiTc) (2)
In the formula,Tcis 1/1023ms 977.5nswhich is the corresponding time for a code element;Niis the difference of the code phase difference betweenG(1t)andG(2t).
The P code is generated by add up the two mode of m sequence which is generated by two complex pseudo noise subcodes X1 and X2 with a total of 12 linear shift registers (LFSR)[2]. The characteristic polynomial of the two 12 LFSR of X1 is:
6 8 11 12
1 ) 1
(X x x x x
f a (3)
2 5 8 9 10 11 12
1 ) 1
(X x x x x x x x
f b (4)
The characteristic polynomials of the two 12 LFSR in X2 are:
3 4 5 7 8 9 10 11 12
2 ) 1
(X x x x x x x x x x x
f a (5)
2 3 4 8 9 12
2 ) 1
(X x x x x x x
The m sequence generated by LFSR of grade 12 has a code element of 4095
1 212 )
( ; The m sequence generated by two 12 LFSR will constitute 16769025
yards. It can be seen that the specific generation of P code is more complicated than C/A code.
Exclusive OR operation rules
Exclusive OR operation rule are shown in the following formula.
0 0 0 ; 1 1 0
; 1 0 1 ; 0 1 1
Suppose binary signals: "1" represents binary "0", "-1" means binary "1", and then there is
1 1 1 ; 1 1 1
; 1 1 1 ; 1 1 1
The following is the Simulink simulation of C/A code and P code,figure 3 is C/A code simulation block diagram,figure 4 is C/A code simulation diagram;figure 5 is a block diagram of the p-code,and figure 6 shows its simulation.The matrix coefficient and related data are set as follows: The coefficientsX1a[1, 0, 0, 0, 1, 1] and the
coefficientsX2a[0, 0, 0, 0, 1].The coefficientX1b[1, 1, 0, 1, 1, 1], and the coefficients b
X2 [0, 0, 0, 0, 1], sample time: 1ms.
Figure 3. C/A code simulation block diagram.
Figure 4. C/A code simulation waveform.
0 100 200 300 400 500 600 700 800 900 1000
0 0.1 0.2 0.3 0.4 0.5 0.6 0.7 0.8
t/us
Figure 5. P Code simulation block diagram.
Figure 6. P code simulation waveform.
FFT frequency domain capture
FFT is a kind of DFT efficient algorithm, called Fast Fourier transform [6], which is gained by improve the discrete Fourier transform algorithm according to the odd, even, virtual and real characteristics of discrete Fourier transform.
By analysis,the convolution of the time domain is equivalent to the multiplication of the frequency domain,the Fourier transform of the relevant outputZ(f)X(f)Y(f),and
) (f
X Y(f)is the Fourier transform of input signal and local signal.To calculate the output of the time domain,the output of the frequency domain is required.Here need inverse Fourier transform
)) ( ) ( ( ) (
z 1
f Y f X F
t (7)
In the above equation (7), the calculation is aimed at the continuous system, while for the discrete system, the integral resultz(n)needs to be calculated by the correlation
operation:
1
0
) ( ) ( )
(
z N
m
m n y m x
n (8)
Where:x(m)is input the signal,y(nm)for local signals.
Here take the discrete Fourier transform (DFT) forz(n)and then:
0 100 200 300 400 500 600 700 800 900 1000 0
0.1 0.2 0.3 0.4 0.5 0.6 0.7 0.8
t/us
1 0 1 0 / ) 2 ( ) ( ) ( ) ( N n N m N kn j e m n y m x k Z
1 0 / ) 2 ( 1 0 / )) ( 2 ( ) ( ) ( N n N km j N m N m n k j e e m n y mx (9)
( ) 1 ( ) ( ) ( )
0 / 2 k X k Y e m x k Y N n N km j
Where:N is the number of sampling points during integration time:x*(k)is the conjugate complex ofx(k),kis the first frequency point andk0,1,,N1.The formula
can also be expressed as:
1 0 1 0 / ) 2 ( ) ( ) ( ) ( N n N m N kn j e m y m n x k Z
1 0 1 0 / )) ( 2 ( / ) 2 ((
)
)
(
N n N m N m n k j N km je
m
n
x
e
m
y
(10)Y(k)X(k)
Suppose the input signalx(n)is real, then there isX*(k)X(k)
z(k) Y(k)X(k) X(k)Y(k) (11) According to formula (11), the relevant values of input signal and local signal can be obtained.
The FFT based signal acquisition is applicable to the operation of data blocks, in other words, the real-time requirement is not high. The FFT capture algorithm can search N grids at a frequency point, and N represents the number of sampling points of 1ms.
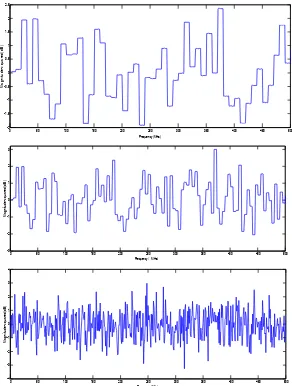
Fig.7-8 shows the Simulink simulation diagram captured by FFT algorithm frequency domain. The related settings are as follows. The coefficientsx1a= [1 0 0 0 0 0 0 0 0 1],x2a=[1 0 0 0 0 0 0 0 0 0 0 0 0].x1b= [1 1 0 1 0 1 0 1 0 1],x2b=[1 1 0 1 0 0 1 0 0].Sequence index: 1, sample time: 3, shift: 0, Buffer size:1024, simulation stop time:20000.
Figure 7. C/A code frequency domain simulation block diagram.
[image:6.612.131.467.521.573.2]D CODE MODULATION
The modulation process is divided into two steps: pseudo-random code spread spectrum and carrier modulation.
To realize spread spectrum, the pseudo-random code is modulated by the D-code which is 50MHz.For example, modulating C/Acode and forming composite code
D
C/A then, the D-code signal extends from 50MHz band width to 1.023MHz.In
the same way, there will forming composite codePDafter modulated by P code.
2) To realize carrier modulation, the signal with carrier L1 or L2 should multiplied.L1 modulate the code forC/ADandPDwhile L2 modulate code forPD
only.
Through the signal modulation, the original D code was changed from smaller one into frequency band is wider and the frequency is higher modulation signal, so it can save the satellite power and enhance signal anti-jamming and secrecy at the same time. The carrier signal L1 and L2 after modulated is called the GPS signal, and the generating principle diagram of it is shown in figure 9 below.
Figure 10 shows MATLAB simulation of amplitude-amplifies and modulation processes of p code and it`s source code. The input parameters in the simulation are as follows: The length of the data code: c = 100;the Number Pcode = 60;the NumberShift = 1;a = 0
P code
x120 L2
x154 L1
/10 C/A code
10.23MHz Fundamental
frequency
π/2 Phase shifter 50bps date
code
‗
‗
+
+
×
×
×
GPS Satellite signals transmit
[image:7.612.178.416.361.528.2]antennas
[image:7.612.166.430.558.714.2]Figure 9. generating principle diagram of GPS signal.
C/A CODE CORRELATION
The good self-correlation and intercorrelation of C/A code for GPS is the key of correctly receive ring demodulating signals and realizing the distance measurement [5]. The autocorrelation function of C/A code can be normalized as:
C t C t dt
T R
c
c
1023
0 ( ) ( )
1023 1 )
( (12)
Where,C(t)represents C/A code;T(c)is Duration of a code element; For code
phase delay (unit code slice).
C/A code self-correlation is commonly used as the approximate expression:
) 1)T (L τ (T
) T τ (
c c
c 1
1 0 ) (
cc c
T
R (13)
When the phase error of C/A code is 0,the self-correlation value reaches maximum value of 1;While the code phase error is a code element, the autocorrelation value is approximately 0, in other words, there is no correlation.
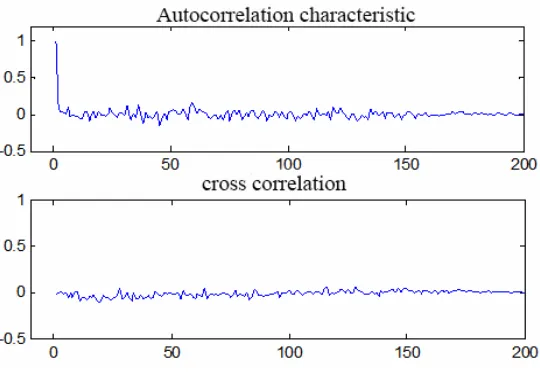
As shown in figure 11 to C/A code of autocorrelation and cross correlation simulation waveform, the waveform diagram can be seen when C/A code phase error to zero since the correlation peak 1,and when the phase error in the code is a code phase, the correlation is approximate 0, consistent with the actual result. The input values of each parameter in MATLAB simulation are as follows: enter the number Pcode=200; enter the numbershift=10;enter a=1;enter a=0;enter the numbershift=100.
GAUSSIAN NOISE INTERFERENCE SIMULATION
[image:8.612.163.433.511.698.2]In the navigation system, the noise comes mainly from the propagation path and the instrument itself. It can be believed that the noise received by the antenna is mainly gaussian white noise. The GPS signal is affected by the noise level during transmission. The signal received on the ground is very weak and the signal power is usually much lower than the noise. In the signal simulation model, the C/A code power can be represented by the signal amplitudePC/A.
2
2
/ A
PC A (14)
A is the signal amplitude. The absolute size of signal power is not practical, and the GPS receiver is more sensitive to SNR because of the interference noise. Therefore, the simulation of noise is of great significance to the setting of SNR. The signal-to-noise ratio is defined as the ratio of signal power to noise power.
n B N
S
0
SNR (15)
Figure.12, Figure.13 is shown as the simulation block diagram and waveform diagram of GPS signals in the interference of gaussian white noise.
The simulation waveform figure shows that gaussian white noise interference with GPS signals gradual changing as the change of related parameters, graphic shows that GPS signals gradually submerged in gaussian white noise with the increase of sampling time. According to the above principle, the parameters in the simulation are set as follows:
[image:9.612.120.474.336.446.2]Gaussian Noise Generation setting: Mean Value: 0, Variance (Vector or matrix):1, Initial seed:50,sample time:1ms、5ms、10ms;AWGN Channel setting: Initial seed:66,Mode:signal to noise ratio(SNR);SNR(dB):50,Input signal power(Watts):1.
Figure 13. Gaussian white noise interference simulation waveform.
CONCLUSION
In this paper, the structure and composition of the GPS signal, track simulation, and the pseudo random noise code (C/A code and P code) and correlation analysis and D code modulation and spread spectrum method are introduced in detail based on practical application, then studied the capture method of frequency domain based on fast Fourier transform; Whereafter the principle of gaussian white noise of GPS signal and its interference with the space transmission characteristics are discussed. Finally,
The related principles and algorithms are simulated by MATLAB/Simulink. The experiment shows that the simulation results and waveform display are in accordance with the theoretical values. In the experiment, the research of signal interference (such as multipath interference [6]) and related algorithms (kalman filtering) needs to be further studied.
0 50 100 150 200 250 300 350 400 450 500 -2
-1.5 -1 -0.5 0 0.5 1 1.5 2 2.5
Frequency(MHz)
M
agni
tude
-s
quar
ed
(dB
)
0 50 100 150 200 250 300 350 400 450 500 -3
-2 -1 0 1 2 3
( )
Frequency MHz
M
agn
itud
e-squa
re
d(
dB
)
0 50 100 150 200 250 300 350 400 450 500 -4
-3 -2 -1 0 1 2 3 4
Frequence(MHz)
M
agn
itude-squar
ed(
dB
REFERENCES
1. Wu Juanli. Research on GPS Software Receiver and Matlab, Master's Thesis of Chang 'An University, Xi 'an, 2009.
2. Shen Chao, Qiu Zhengding. Simulation of GPS System Based on MatLab/Simulink, 3. Journal of system simulation, 2006. 18(7), pp. 1857-1860.
4. C++/Matlab implementation of GPS Software Receiver. Jiaotong University Master's Degree Thesis, Shanghai, 2007.
5. Wen Zheng. Proficient in MATLAB intelligent algorithm. tsinghua university press, Beijing, 2015.5. 6. G.A. rul Elango, g.f. Sudha. Design of complete software GPS signal simulator with low complexity and precise multipath channel model. Journal of Electrical Systems and Information Technology, 2016, pp. 161-181.
7. James Bao-yen Tsui. Fundamentals of global positioning system receivers. A software Approach. John Wiley & Sons Inc, New York, 2000.