Submillimeter-Selected Galaxies and Techniques for the Optimal
Analysis and Observing of Weak Signals
Thesis by
Attila Kov´acs
In Partial Fulfillment of the Requirements for the Degree of
Doctor of Philosophy
California Institute of Technology Pasadena, California
2006
c
2006
Acknowledgements
I owe most to Mom and Dad for always letting me follow my dreams, and Tom Phillips, my adviser, for likewise allowing me to “do my thing” on this never-ending thesis research. I ought to mention, that it all started on my 7th birthday when Grandma presented me with my first astronomy book. She used to tell me that after she was gone, she would watch me from the stars. I am now looking back at her from down here! Thanks Grannie, you are a star! And many thanks to all who gave me love, caring, friendship, support and advice all these years (and may you find forgiveness if I left you out below...). You are my living (rock) stars! Especially my brother, the rest of my family, Connie, and...
Haroon & Martha Ahmed·Zahra Ahmed·Dominic Benford·Peter Bibring·Andrew Blain·
Ad-win Boogert·Colin Borys·El˝od Both·Matt Bradford·Maˇsa ˇCemaˇzar·Scott Chapman & Janya
Freer·Ed Chen·Gerg˝o D´avid·Darren Dowell·Moses Dili Duku·Mick Edgar·Gy¨orgy Fl´orik·Ilja
Friedel·Rosaria Fronteddu·Marisol Gerona·Carl Gottlieb·Thomas Greve·Yiannis Hadjiyiannis ·P´eter Horv´ath· ´Akos Issekutz·Dean “Marvellas” Karvellas·Coley King & Yana Queen·Zsuzsi
Kiss·Jacob Kooi ·Edo Kussell·Melanie Leong· Darek Lis·Carole Lu & Alok Saldanha·Sara
Magnusson·Mike McCarthy·Denis Medvedsek·Karl Menten·Stanimir Metchev & Anne Simon ·Simona Miglietta·Jim Moran·Harvey Moseley·Frederique Motte·Neo Muyanga·Pia Oberoi ·Bartek Ostdenda·J´ulia Paraizs & the Paraizs family·P´eter P´eli ·Paul P´enzes & Rocio Roman·
the Pop-Eleches brothers, “Kiki” & Grigore·Anu Raunio·Frank Rice ·Zolt´an Rihmer·Morvan
Salez·Ines Schwetz & the Schwetz family·Zsuzsa Serf˝oz˝o·Rick Shafer·G´abor Sikl´os·Bastien
& Corinne Solier· Johannes Staguhn·Mark Sylvester ·Ramy Tadros·Patrick Thaddeus· Mike
Travers·Dominik Treeck·Charlotte Vastel ·Beate Wegscheider·Whisper ·Bartek Wydrowski·
Min Yang·Hiroshige Yoshida·Jonas Zmuidzinas·Judit Zombori·the dedicated proofreader, who
had to suffer my many errors·and the many beers, wines, martinis, & other magical concoctions
Hungarian Goulash
This basic food of the Hungarian cattle-herder (i.e., “guly´as” in Hungarian) begins by saying that its proper name is “p¨ork¨olt” (meaning, braised) in Hungarian. Mix in some sour cream before serving, and you may call it “paprik´as” instead. This, highlights an important point: goulash is a quintessential paprika dish—so better have the best grinds of that powder when preparing it. Gopd paprika is bright red (even orangy) and is very fragrant. Then, there’s also “guly´as leves” (i.e., goulash soup), which uses the same base for a soup version with many additional vegetables (almost to the point of too healthy for the average heart-clogged Hungarian) and flour dumplings (“csipetke”).
As the nomenclature suggests, it is normally made from beef (i.e., “gulya”), especially from the unique gray-colored variety that is (or used to be) native to the plains of Hungary but one, which is now on the brink of extinction (I must admit, I never had the pleasure of tasting one of those...). However, almost any dark meat (e.g., pork, lamb, mutton, deer, boar – but hell-no chicken!), or not-quite-meat (e.g., rooster fries, tripe) works. The trick is always to cook it long enough (so that it falls apart under a gentle bite), and add substantial amounts of pork lard (or less-tasty but more heart-friendly vegetable oil) and red wine. Most importnantly, it really should be cooked outdoors in a cauldron hanging over an open fire. Of course, it can be prepared on the stove top also, but don’t expect the divine outcome when you allow yourself such profanity. Anyway, here’s my (slightly nontraditional) recipe:
Ingredients. (for 6-8 servings)
4 lb beef (marbled), lamb, deer or else, cubed in&1 in pieces (even mixed). Make it tough, it just becomes better. (Avoid clean cuts by all means!) 4 Tsp. pork lard (or oil if you must...)
slices of bacon diced (optional) 2 medium yellow onion, finely chopped.
4-6 tsp. paprika (make sure to mix in some of the spicy kind!) 1/2 bottle red wine
2-3 Hungarian or Anaheim peppers (optional) cut in 1/2 in cicles 1-2 ripe tomato (optional) cut in wedges
chillies (red, green, or yellow, fresh or dry) 1/2 lb mushrooms, preferably wild, diced (optional)
3-4 bay leafs (laurel)
1 sprig of rosemary (optional) 1 cinnammon stick (optional)
Preparation. Saut´e the onions in the lard over medium-low heat (with the bacon for extra good-ness), so that it just sizzles, until the onions start to turn golden (about 15-20 minutes). Mix in peppers and chillies and stir in the paprika quickly (it will become bitter if you burn it—and you better start over), and cool it (and yourself!) off with a glass of red wine. With the relief that comes with successful completion of this step, all troubles are now behind! Add the meat, and turn the heat to medium-high. Stir until the meat is browned on all sides (i.e., braised). Add mushrooms, and cook until its juices are evaporated. Add salt, spices, and tomatoes. Simmer for at least 2 hours uncovered. Whenever the liquid is about to disappear under the meat, add more wine. At some point, the fat will come on top in a marbled layer—that is a good sign. It is finally done, when the meat falls apart from a gentle squeeze against the cauldron side.
Abstract
New350µm data constrain accurately the thermal far-infrared spectral energy distributions (SEDs)
for12distant submillimeter selected galaxies (SMGs). The results confirm that the linear radio to
far-infrared correlation, established for local infrared galaxies, holds out to high redshifts (z ∼1–
3). The low correlation constantq ' 2.14is more indicative of star formation than AGN-fueled
dust heating. The sample exhibits an apparent luminosity–temperature relation (LF IR ∝ Td2.89),
possibly owing to selection effects. As a result, photometric redshifts in the radio or far-infrared may not be viable, but expressions may relate the observed quantities for current flux and volume limited SMG samples. These suggest that SED estimation may be possible, for objects similarly selected, based on a single radio or far-infrared flux measurement.
The detection of these faint objects ('10 mJy at350µm) from the ground is complicated by a
bright ('103Jy) and highly variable ('10 Jy RMS in 10 minutes of integration) atmosphere with a
Contents
Acknowledgements iv
Abstract vii
List of Figures xi
List of Tables xii
1 Introduction 1
1.1 From Dust to Star Formation in the Distant Universe . . . 1
1.2 New Techniques for Observing and Analysis . . . 4
2 SHARC-2 350µm Observations of Distant Submillimeter-Selected Galaxies 7 2.1 Introduction . . . 7
2.2 SHARC-2 350µm Observations . . . 8
2.3 Spectral Energy Distributions of SMGs . . . 11
2.3.1 Cold, Quiescent SMGs? . . . 16
2.4 The Far-IR/Radio Correlation at High Redshifts . . . 18
2.5 Dust Emissivity Index . . . 22
2.6 Photometric Redshifts . . . 27
2.6.1 Luminosity-Temperature Relation . . . 28
2.7 Scaling Relations . . . 31
2.8 Conclusions . . . 33
3 Fundamentals of Weak-Signal Observing and Analysis for NonGaussian Noise 37 3.1 Introduction . . . 37
3.2 Signals, Measurements, and Observing Strategies . . . 38
3.2.1 A Data Reduction Challenge . . . 39
3.2.2 Representations of Data . . . 41
3.3 Noise Weighting . . . 45
3.3.1 Weighted Fourier Transforms . . . 46
3.3.2 Independent (Uncorrelated) Noise . . . 47
3.3.3 Stationary Noise . . . 48
3.3.4 Flagging Data . . . 52
3.4 Filtering (Noise Isolation) . . . 53
3.4.1 Filters vs. Weights . . . 54
3.4.2 Noise Whitening . . . 55
3.4.3 Optimal Filters . . . 56
3.4.4 Incorporating Prior Knowledge . . . 61
3.5 Gain Knowledge . . . 63
3.5.1 Gain Accuracy Requirement . . . 63
3.5.2 Gains and Filters . . . 64
3.5.3 Gains and Noise Weights . . . 65
3.6 Data Collection Strategies . . . 66
3.6.1 Fidelity . . . 66
3.6.2 Sensitivity . . . 67
3.6.3 Robustness . . . 68
3.6.4 Feasibility . . . 69
3.6.5 Balanced Strategies . . . 70
3.6.6 Stationary and Metastationary Noise and Patterns . . . 71
3.7 Conclusions . . . 72
4 CRUSH: A Linearly Scalable Implementation of Weak Signal Analysis via a Sequence of Estimators 75 4.1 Introduction . . . 75
4.1.1 Time-Domain Analysis . . . 76
4.2 Compound Signals and Models . . . 76
4.2.1 Pipeline Reduction . . . 78
4.3 Statistical Estimators . . . 80
4.3.1 Maximum Likelihood Estimators . . . 80
4.3.2 Maximum Entropy Estimators . . . 82
4.3.3 Robust Estimators . . . 84
4.4 Filtering Properties . . . 86
4.4.1 Filter Evolution and Convergence . . . 88
4.4.2 1/f-Type noise . . . 94
4.5 Weight Estimation . . . 97
4.5.1 Weighting in Configuration Space . . . 98
4.5.2 Spectral Weight Estimation . . . 99
4.5.3 Robust Weight Estimation . . . 100
4.5.4 Fractional Degrees of Freedom . . . 100
4.6 Gains and Nonlinear Detector Response . . . 102
4.6.1 Gain Estimation . . . 103
4.7 Comparison to Alternative Methods . . . 105
4.7.1 Direct Matrix Inversion . . . 105
4.7.2 Singular Value Decomposition . . . 106
4.8 Conclusions . . . 107
A Note on the Effective Number of Beams Inside an Aperture 110 B CRUSH: A Practical Guide 112 B.1 CRUSHfor SHARC-2 . . . 112
B.2 SHARC-2 Pipeline Elements . . . 116
B.2.1 Signal Models . . . 116
B.2.2 Supplementary Models . . . 120
B.2.3 Consistency Checks & Flagging . . . 122
B.3 The Source Model . . . 122
B.3.1 Optical Depth . . . 127
B.4 χ2Estimation . . . 128
List of Figures
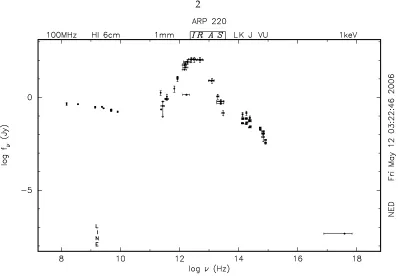
1.1 The spectral energy distribution of a dusty galaxy (Arp220) . . . 2
1.2 The cosmic energy density spectrum . . . 3
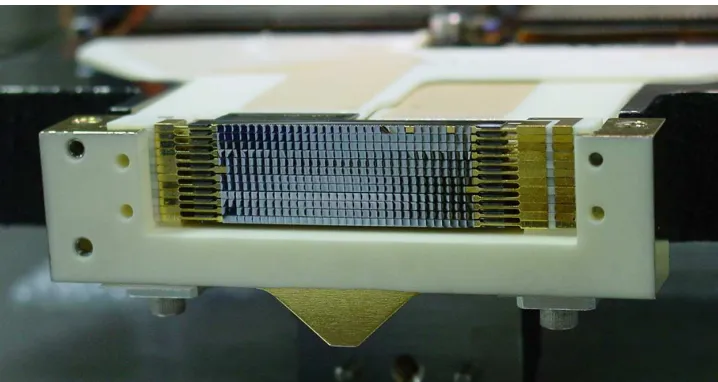
1.3 The SHARC-2 bolometer array . . . 5
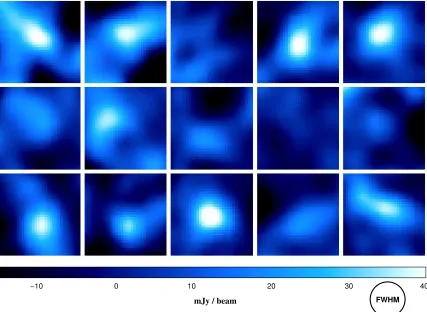
2.1 SHARC-2350µm thumbnail images of the SMGs observed . . . 9
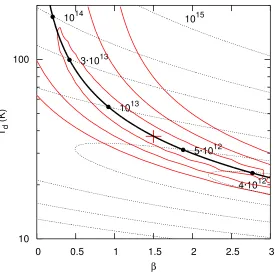
2.2 TheTd–βcorrelation in SED fits . . . 13
2.3 Observed fluxes and best-fit SED models . . . 14
2.4 Median dust temperatures vs. redshift . . . 19
2.5 The radio to far-infrared correlation for SMGs . . . 21
2.6 The original correlation measureqand the luminosity-based alternativeqL . . . 23
2.7 β–qlikelihood contours . . . 26
2.8 Luminosity–temperature (L–T) relation . . . 29
2.9 Empirical relations between observed quantities . . . 32
3.1 Atmospheric power spectrum at 350µm . . . 51
3.2 A weak-signal spectrum and some practical filters . . . 57
3.3 The effect of filtering on the time-series signals . . . 60
3.4 Source filtering and corrections . . . 62
4.1 Iterated filtering of1/f2noise via boxcar data windows . . . 95
4.2 Iterated filtering of1/fnoise via boxcar data windows . . . 95
B.1 A Collection of Scans . . . 113
B.2 Slicing of scan data for deriving parameter estimates. . . 114
B.3 Slicing Example for SHARC-2 scan data. . . 115
B.4 Smoothing and Filtering of Images . . . 126
B.5 Modeling example of a SHARC-2 scan (Pallas) . . . 129
B.6 Example reductions of Pallas . . . 132
List of Tables
2.1 Summary of Observations . . . 12
2.2 Far-Infrared Properties of SMGs from SHARC-2 Data . . . 17
2.3 Properties of SMGs Incorporating Radio Data . . . 25
Chapter 1
Introduction
1.1 From Dust to Star Formation in the Distant Universe
Today’s technological capabilities allow us to study the universe via nearly the full electromagnetic spectrum. The wavebands of astronomical interest are determined either by the physical processes that they probe, or by their reach into the distant universe. To study large volumes of space, it is best to look in a part of the spectrum where most energy is radiated.
Galaxies emit much or most of their light at far-infrared wavelengths (λ'30µm–1 mm), with
their spectral energy distributions (SEDs) typically peaking in the neighborhood of100µm (fig. 1.1).
A mostly unresolved milieu of distant galaxies thus give rise to the Cosmic Infrared Background (CIB, fig. 1.2). Thus, the wavebands of the submillimeter1and far-infrared offer an optimal window
to study galaxy formation into the depths of the universe.
The shape of the CIB spectrum is consistent with cold ('10–100K) thermal of gray- or
black-body radiation. Only free charges (i.e., plasma) and solids can produce such thermal continuum, since free neutral atoms and molecules absorb and emit light in narrow bands at specific energies only. The ionized plasma of the interstellar or intergalactic medium is much too hot (thousands to millions of kelvin) to explain the observed cool galactic continua. Therefore, solid objects must be responsible for radiating this dominant thermal component. And because it is the surface area, not the volume, of solids which gives rise to bulk the thermal radiation, the light we detect in the submillimeter or far-infrared comes mainly from great numbers of rather small particles, instead of large bodies (e.g., planets and asteroids). These particles, also known as the interstellar dust-grains, have typical sizes ranging between 1 nm and 1µm. Thus, it is fair to say, that the study of thermal
far-infrared is mainly concerned with the physical properties of dust.
Stars produce dust when they shed their metal-rich outer envelopes during the final stages of their life cycle, either as planetary nebulæ or as supernovæ. Dust also plays an important role in the formation of new stars by efficiently radiating large amounts of energy, thus enabling the
Figure 1.1 The spectral energy distribution of a dusty galaxy. Arp220 is a local universe example of what we think distant dusty galaxies may be like. This local starburst emits most of its energy at far-infrared wavelengths via warm dust (characteristically37K). This figure was obtained from
theNASA/IPACExtragalactic Database (NED).
gravitational collapse of molecular clouds to form young stellar cores. In this way, the quantities of dust trace both the formation and the death of stars, while dust luminosities and temperatures are fueled by the energetics of the active stellar populations whose light dust absorbs and re-emits in the far-infrared.
Since massive (&8M) stars are far more energetic than their smaller-sized counterparts (e.g,
the Sun), they tend to dominate the heating of dust in their environments (cf. Salpeter 1955 IMF and L-M relation from Kuiper 1938; Schaller et al. 1992; Baraffe et al. 1998; Henry & McCarthy 1993; Henry et al. 1999). Massive stars are also short lived (∼107yr), and the dust luminosities they fuel persist only as long as new stars are forming at the same rate as old ones die. As such, far-infrared luminosities provide an indirect measure of the present rate of high-mass star formation. Therefore, far-infrared astronomy is also the study of star formation, and its history, by reaching into the depth of a younger universe.
Chapter 2 presents a star-formation study for the most distant population of submillimeter-selected galaxies (SMGs). New data, acquired at350µm wavelengths from the SHARC-2
Frequency [Hz]
Energy Density [nW/m2 sr]
1.0E+10 1.0E+15 1.0E+20 1.0E+25
0.01 1 100
The Cosmic Energy Density Spectrum
CIB
COB
CMB
[image:15.612.123.519.215.495.2]CXB
Figure 1.2 The cosmic energy density spectrum. The dominant Cosmic Microwave Background (CMB), with its2.7K Planck blackbody spectrum, carries a snapshot of the universe from the
re-combination era before galaxies were formed. In contrast, a field of distant galaxies contribute to the Cosmic Infrared (CIB) and Cosmic Optical (COB) Backgrounds, indicating that these wave-lengths are optimal for the study of galaxy evolution. Galaxies, like Arp220 (fig. 1.1) at redshifts
lie hidden at optical wavelengths. Additionally, the new results help confirm an important rela-tionship between radio and far-infrared luminosities, well studied locally, but not at the greater distances of SMGs where its impact could be most profound. The new data could hint at the ex-citing possibility of providing reasonable SED estimates for flux- and volume-limited radio and far-infrared galaxy samples based on photometry at the single wavelength of detection.
1.2 New Techniques for Observing and Analysis
Detecting faint and distant objects at submillimeter wavelengths is not an easy task. This is espe-cially true, when attempted from ground-based telescope facilities (e.g., the CSO), because our own atmosphere is many orders of magnitude brighter than the signals sought from the galaxies of great distance. The variability of the atmospheric flux alone, over the time scales of a few hours integra-tion, is typically thousands of times greater than the feeble'20 mJy fluxes of the typical SMG at
350µm wavelength. That these detections are, nevertheless, possible, owes to creative techniques
for the collection and analysis of submillimeter data.
The traditional time-tested approach has been to switch (chop) rapidly between a “source” and a nearby patch of “blank” sky. With the same detectors observing both source and sky, the differ-ence of the two signals provide viable source fluxes (Emerson 1988, 1995). When done sufficiently fast, such that the changing of the atmospheric flux can be neglected (at350µm this typically
re-quires switching back-and-forth several times a second), sensitive photometry becomes possible. However, the signal differencing involved comes at a price of losing sensitivity to many types of source structures, and that image reconstructions require a fair amount of guessing (via maximum-entropy deconvolution, see Emerson 1995; Jenness et al. 2000a,b). Nonetheless, for instruments with but a single, or a just few, detectors chopping can mean the only viable way of collecting data. Recent progress in detector technology heralded the arrival of new larger format, 2-dimensional, bolometer arrays with significantly increased detectors counts, and longer time-scale stabilities. The SHARC-2 instrument with its 384 detectors, arranged in a32×12format, replaced a24pixel
predecessor in January 2003, and is currently the largest submillimeter array in operation. Even bigger arrays are already in production and expected in the near future (e.g., SCUBA-2 with ca.
2×5000pixels, see Audley et al. 2004). These large arrays can measure the sky (and sources)
si-multaneously at many different positions, at all times. As such, it is reasonable to ask whether the old favorite technique of chopping and differencing could now yield to new, and superior, models of observing and data analysis.
Figure 1.3 The SHARC-2 detector array.
author as a novel approach to data reduction. The faint submillimeter galaxies of Chapter 2 provide ample testimony to the success of this approach, as do a number of other papers2whose scientific
results benefited from the new techniques.
Chapters 3 and 4 introduce both the observing and data reduction techniques, which go hand in hand for a successdul experiment. They are discussed in general terms, such that the techniques and their conclusions can be adapted to a wide variety of weak-signal experiments with adverse noise conditions.
The first of the two chapters focuses on the general principles of analyzing weak signals in the presence of non-Gaussian noise. It also introduces the concepts and challenges that specific implementations face and must meet. The discussion covers many of the often overlooked details. which prove critical in low signal-to-noise experiments, such as appropriate weighting and filtering of the data, and the necessity of accurately characterizing signal gains. This chapter also offers a quantitative treatment on how data can be observed and analyzed optimally with the least loss of information possible.
Chapter 4 introduces a particular implementation, that ofCRUSHfor the analysis of SHARC-2 data. The method analyzes data in the time domain through an iterated sequence of statistical estimators. A great advantage of the approach is that its computation cost grows linearly with the size of the data, in sharp contrast with other established methods based on the inversion of large matrices or Fourier transforms. The method approaches maximally optimal analysis in the presence of1/f type noise (and especially1/f2 Brownian noise), the greatest malady affecting typical ground-based submillimeter data and CMB experiments. It may even be better than its
2e.g., Houde et al. (2004); Marsh et al. (2005); Khan et al. (2005,a); Andrews & Williams (2005); Chen et al. (2005);
expensive alternatives, whose actual effects on weak signals can often remain mysteriously buried under their mathematical complexities and subtleties.
Finally, the specifics relating to the astronomical application are presented in Appendix B, while further information is available on the SHARC-2 web-page.3
Bibliography
Andrews, S. M., & Williams, J. P. 2005, ApJ, 631, 1134 Audley, M., et al. 2004, preprint (astro-ph/0410439)
Baraffe, I., Chabrier, G., Allard, F., & Hauschildt, P. H. 1998, A&A, 337, 403
Beelen, A., Cox, P., Benford, D. J., Dowell, C. D., Kov´acs, A., Bertoldi, F., & Omont, A. 2006, ApJ, in press
Borys, C. B., et al. 2006, ApJ, 636, 134 Chen, C. H., et al. 2005, ApJ, 634, 1372
Dowell, C. D., et al. 2003, SPIE Conf. Proc. Vol. 4855, Millimeter and Submillimeter Detectors for Astronomy, ed. T. G. Phillips, & J. Zmuidzinas, 73
Emerson, D. T. 1995, ASPC, 75, 309
Emerson, D. T., & Graeve, R. 1988, A&A, 190, 353 Hasinger, G. 2000, LNP, 548, 423
Henry, T. J., Franz, O. G., Wasserman, L. H., Benedict, G. F., Shelus, P. J., Ianna, P. A., Kirkpatrick, J. D., & McCarthy, D. W 1999, ApJ, 512, 864
Henry, T. J., & McCarthy, D. W. 1993, AJ, 106, 773
Houde, M., Dowell, C. D., Hildebrand, R. H., Dotson, J. L., Valillancourt, J. E., Phillips, T. G., Peng, R., & Bastien, P. 2004, ApJ, 604, 717
Jenness, T., Holland, W. S., Chapin, E., Lightfoot, J. F., & Duncan, W. D. 2000a, ASPC, 216, 559 Jenness, T., Lightfoot, J. F., Holland, W. S., Greaves, J. S, & Economou, F. 2000b, ASPC, 217, 205 Johnstone, D., Wilson, C. D., Moriarty-Schieven, G., Giannakopoulou-Creighton, J., & Gregersen,
E. 2000, ApJS, 131, 505
Khan, S. A., Benford, D. J., Clements, D. L., Modeley, S. H., Shafer, R. A., & Sumner, T. J. 2005, MNRAS, 359, 10
Khan, S. A., et al. 2005, ApJ, 631, 9 Kuiper, G. P. 1938, ApJ, 88, 472
Laurent, G. T., Glenn, J., Egami, E., Rieke, G. H., Ivison, R. J., Yun, M. S., Aguirre, J. E., & Maloney, P. R. 2006, ApJ, 643, in press
Marsh, K. A., Velusamy, T., Dowell, C. D., Grogan, K., & Beichman, C. A. 2005, ApJ, 620, 47 Salpeter, E. E. 1955, Apj, 121, 161
Schaller, G., Schaerer, D., Meynet, G., & Maeder, A. 1992, Nature, 360, 320
Chapter 2
SHARC-2 350
µ
m Observations of
Distant Submillimeter-Selected
Galaxies
The text in this chapter is reproduced in part with permission from:
Kov´acs, A., Chapman S. C., Dowell, C. D., Blain A. W., Ivison R. J., Smail I, & Phillips, T. G. 2006, ApJ, in press
c
2006 American Astronomical Society
2.1 Introduction
Ever since the first submillimeter-selected galaxy (SMG) samples debuted from SCUBA850µm
surveys (Smail et al. 1997; Barger et al. 1998; Hughes et al. 1998; Eales et al. 1999), the nature of the SMG population has been the focus of attention for the galaxy formation community, because the
850µm selection is expected to pick similar sources almost independently of redshift (z∼1–8), due
to a negative K-correction that essentially compensates for the loss of flux from increasing distance. This allows unbiased, luminosity-selected studies of galaxy formation. The hunger for information on these sources spurred a flurry of follow-up studies at all wavelengths, long and short. Since then many of these sources have been identified at optical, UV (Borys et al. 2003; Chapman et al. 2003; Webb et al. 2003) and radio wavelengths (Smail et al. 2000; Ivison et al. 2002), providing accurate positions which allowed optical redshift measurements (Chapman et al. 2003, 2005). As a result we now know that these massive galaxies, with redshifts distributed around a median z of 2.3,
are enshrouded with such quantities of dust that they often lie hidden at optical wavelengths, and therefore constitute a distinct population from the galaxies selected by optical surveys.
More recently, longer wavelength submillimeter surveys, at1100µm and at1200µm (Laurent et al.
of the SCUBA, Bolocam and MAMBO wavelengths on the Rayleigh-Jeans side of the SED does not allow for an effective constraint on the thermal far-infrared spectral energy distributions (SEDs) at the relevant redshifts. Nor do the latest results from theSpitzer Space Telescopeprovide powerful constraints, since at the shorter mid-infrared wavelengths the emission is dominated by polyaro-matic hydrocarbons (PAHs) and a minority population of hot dust. For these reasons, the best estimates of the characteristic temperatures and the integrated luminosities, to date, have relied on the assumption that the local radio to far-infrared correlation (Helou et al. 1985; Condon 1992; Yun et al. 2001) can be extended into the distant universe. There are hints that this may be appro-priate (Garrett 2002; Appleton et al. 2004), but the assumption has remained largely unchecked.
Shorter wavelength submillimeter measurements, sampling near the rest frame peak of the emission, are thus essential to provide firm constraints to the far-infrared SED. Here, we present results at 350µm, using the second generation Submillimeter High Angular Resolution Camera
(SHARC-2; Dowell et al. 2003) at the Caltech Submillimeter Observatory (CSO). From these we derive the first direct measures of dust temperatures and far-infrared luminosities for a sample of SMGs, testing the radio to far-infared correlation. We also attempt to constrain dust emission properties, and investigate the implications of our findings for the viability of photometric red-shifts based on far-infrared and radio measurements. Finally, we present a range of useful scaling relations that may apply to the SMG population.
2.2 SHARC-2 350
µm Observations
We conducted follow-up observations of SCUBA850µm detected sources with radio identifications
and optical redshifts (Chapman et al. 2003, 2005). Seven of the of 15 targets were hand picked based on their predicted bright 350µm fluxes (S350µm > 45mJy from Chapman et al. 2005), while the remaining were selected at random to partially compensate for any selection bias.
The observations were carried out during8separate observing runs between November 2002
and April 2005, in excellent weather (τ225 GHz <0.06), reaching1σdepths of 5–9 mJy in 2–4 hours of integration in 14small fields (' 2.5×1arcmin2) around the targeted sources. Our scanning strategy was to modulate the telescope pointing with a small amplitude (15–20 arcsec) nonconnect-ing Lissajous pattern within the limits of reasonable telescope acceleration (with typical periods of 10–20 seconds). This pattern was chosen to provide fast, 2-dimensional, recurring but nonclosed, patterns with crossing paths—all of which are essential to allow the separation of the superposed source, atmospheric and instrumental signals. For the observations since February 2003, we have taken advantage of the CSO’s Dish Surface Optimization System (Leong 2005) to improve beam shapes and efficiencies, and hence sensitivities, at all elevations.
point-−10 0 10 20 30 40 FWHM
[image:21.612.111.538.202.514.2]mJy / beam
Figure 2.1 SHARC-2350µm thumbnail images of the SMGs observed (sources1−15in Tables 2.1–
2.3) shown in reading order (left to right, top to bottom). Images are 30”×30” regions centered
on the radio positions, and displayed on the same flux scale for comparison. The12.400FWHM
ing data taken during each run. Additionally, our preliminary source identifications revealed a small, albeit significant ('3 arcsec) systematic pointing shift in the negative RA direction. All maps
were re-aligned accordingly. The reconstructed pointing is accurate to 3.5” rms, in good agreement with CSO specifications.
The data were processed using the CRUSH1software package, developed at Caltech (see
Chap-ter 4), which models total power detector signals using an iChap-terated sequence of maximum likeli-hood estimators. The FWHM point-spread function of the final maps (fig. 2.1) are approximately 12” after optimal filtering to search for beam-sized ('9”) features in order to yield maximal
signal-to-noise ratios on point sources. This degradation of the image resolution by around√2, from the
nominal instrumental beam width of 8.5”, is because the fitting for beam sized features is equiva-lent to convolving the image with the slightly wider effective beam of around 9”, which accounts for the smearing of the nominal beam by pointing and focus variations on the long integrations.
Calibration was performed primarily against planets and asteroids, when available, or using stable galactic continuum sources and Arp220.2 Trends in aperture efficiency, especially with
ele-vation, were estimated and were taken into account when calibrating our science targets. The sys-tematic flux filtering effect of the aggressive reduction parameters used in CRUSH to subtract noise signals and reach maximal image depths, was carefully estimated for the case of point sources, and the appropriate corrections were applied to the images. The final calibration is expected with high confidence to be more accurate than15%, with systematic effects anticipated to be less.
The maps produced by CRUSH reveal Gaussian noise profiles with an anticipated tail at posi-tive fluxes. Hence, in searching for350µm counterparts around the published radio positions, we
calculate detection thresholds based on the effective number of beamsNbeam ≈1 +A/Abeam(see Appendix A) inside a detection areaAin the smoothed image. A detection confidence C ≈ 1is
reached at the significance levelSN Rat which,
1−C≈ N√beam
2π
Z ∞
SN R
e−12x 2
dx. (2.1)
As for the appropriate search radius, the probability that the peak of the smoothed image falls at some radius away from the true position is essentially the likelihood that the smoothed noise level at that radius is sufficient to make up for the deficit in the underlying signal. Therefore, for the case of Gaussian noise profiles, we expect the detection to lie inside of a2σ noise peak, and
therefore within a maximal radius given by the conditionSN R= 2/[1−exp(−r2
max/2σbeam2 )]for a Gaussian beam profile withσbeamspread at an underlying signal-to-noise ratio ofSN R. To this we must add the appropriate pointing tolerance (at2σlevel) in quadrature, arriving at an expression
1http://www.submm.caltech.edu/∼sharc/crush.
for the detection radius around the actual position as a function of detection significance, that is,
r2max= 4σpointing2 −2σ2beamln
1−SN R2
. (2.2)
Note, that this expression simplifies tormax →2σbeam/
√
SN Rfor the case ofSN R1and
negli-gibleσpointing.
The combination of SN R = 2.30 and rmax = 10.400 simultaneously satisfy both constraints (eqs. [2.1] and [2.2]) atC = 95%confidence level for a 9”F W HM effective beam andσpointing =
3.500pointing rms. Potential candidates thus identified are subsequently verified to lie within the
expected distance from their respective radio positions. The resulting identifications are summa-rized in Table 2.1. When counterparts were not found, the peak measurement values inside the search area are reported.
The sources, collectively, are much smaller than the SHARC-2 beam (i.e.,d900), as neither (i)
fitting larger (1200) beams or (ii) the filtering of extended structures produce systematically different
fluxes for the sample as a whole. Source extents typically.30 kpc are therefore implied. While the partial resolution of a few objects cannot be excluded, the peak fluxes of the optimally filtered images are expected to be generally accurate measures of the total integrated flux for the objects concerned.
2.3 Spectral Energy Distributions of SMGs
We fitted the SHARC-2350µm and SCUBA850µm fluxes, combined with Bolocam1100µm (Laurent et al.
2005) and MAMBO1200µm (Greve et al. 2004) data when available, with single temperature,
op-tically thin grey-body models of the formS(ν, T) ∝ κ(ν)B(ν, T), whereκ(ν) ∝ νβ is an
approx-imation for the full emissivity term(1−exp[(ν/ν0)β])forνobs ν0. Alternative SED models
in-corporating the full optical depth, or a distribution of temperatures and power-law Wien tails did not provide better description the data. Specifically, the flattening of the Rayleigh-Jeans slope due to optical depths approaching unity is not detectable with the'10% uncertain relative calibration
of the bands, while the Wien side of the spectra is not sampled by the observations. More complex SED models, e.g., the two temperature model used by Dunne & Eales (2001), were not considered, since these require greater number of parameters than can be determined from the few, often just two, photometric data points available for the typical SMG.
SED models, whether incorporating an emissivity slope, full optical depth or multiple temper-ature components, are simple parametrizations of complex underlying spectral distributions, pro-duced by a range of dust properties inside the targeted galaxies. Therefore,T andβof the model
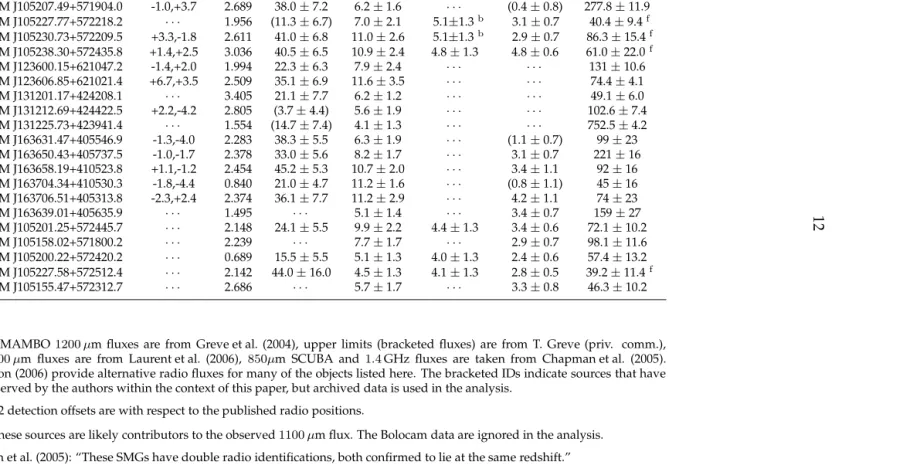
12
Offset J2000a S(350µm) S(850µm) S(1100µm) S(1200µm) S(1.4GHz)
ID Name (arcsec) z (mJy) (mJy) (mJy) (mJy) (µJy)
1 SMM J030227.73+000653.5 +1.0,+0.8 1.408 42.2±9.8 4.4±1.3 · · · 217±9
2 SMM J105207.49+571904.0 -1.0,+3.7 2.689 38.0±7.2 6.2±1.6 · · · (0.4±0.8) 277.8±11.9
3b SMM J105227.77+572218.2 · · · 1.956 (11.3±6.7) 7.0±2.1 5.1±1.3b 3.1±0.7 40.4±9.4f
4b SMM J105230.73+572209.5 +3.3,-1.8 2.611 41.0±6.8 11.0±2.6 5.1±1.3b 2.9±0.7 86.3±15.4f
5 SMM J105238.30+572435.8 +1.4,+2.5 3.036 40.5±6.5 10.9±2.4 4.8±1.3 4.8±0.6 61.0±22.0f
6 SMM J123600.15+621047.2 -1.4,+2.0 1.994 22.3±6.3 7.9±2.4 · · · 131±10.6
7 SMM J123606.85+621021.4 +6.7,+3.5 2.509 35.1±6.9 11.6±3.5 · · · 74.4±4.1
8 SMM J131201.17+424208.1 · · · 3.405 21.1±7.7 6.2±1.2 · · · 49.1±6.0
9 SMM J131212.69+424422.5 +2.2,-4.2 2.805 (3.7±4.4) 5.6±1.9 · · · 102.6±7.4
10 SMM J131225.73+423941.4 · · · 1.554 (14.7±7.4) 4.1±1.3 · · · 752.5±4.2
11 SMM J163631.47+405546.9 -1.3,-4.0 2.283 38.3±5.5 6.3±1.9 · · · (1.1±0.7) 99±23
12 SMM J163650.43+405737.5 -1.0,-1.7 2.378 33.0±5.6 8.2±1.7 · · · 3.1±0.7 221±16
13 SMM J163658.19+410523.8 +1.1,-1.2 2.454 45.2±5.3 10.7±2.0 · · · 3.4±1.1 92±16
14 SMM J163704.34+410530.3 -1.8,-4.4 0.840 21.0±4.7 11.2±1.6 · · · (0.8±1.1) 45±16
15 SMM J163706.51+405313.8 -2.3,+2.4 2.374 36.1±7.7 11.2±2.9 · · · 4.2±1.1 74±23
(16) SMM J163639.01+405635.9 · · · 1.495 · · · 5.1±1.4 · · · 3.4±0.7 159±27
(17)e SMM J105201.25+572445.7 · · · 2.148 24.1±5.5 9.9±2.2 4.4±1.3 3.4±0.6 72.1±10.2
(18) SMM J105158.02+571800.2 · · · 2.239 · · · 7.7±1.7 · · · 2.9±0.7 98.1±11.6
(19)d,eSMM J105200.22+572420.2 · · · 0.689 15.5±5.5 5.1±1.3 4.0±1.3 2.4±0.6 57.4±13.2
(20)e SMM J105227.58+572512.4 · · · 2.142 44.0±16.0 4.5±1.3 4.1±1.3 2.8±0.5 39.2±11.4f
(21)c SMM J105155.47+572312.7 · · · 2.686 · · · 5.7±1.7 · · · 3.3±0.8 46.3±10.2
Note. — MAMBO1200µm fluxes are from Greve et al. (2004), upper limits (bracketed fluxes) are from T. Greve (priv. comm.),
Bolocam1100µm fluxes are from Laurent et al. (2006), 850µm SCUBA and 1.4GHz fluxes are taken from Chapman et al. (2005).
Biggs & Ivison (2006) provide alternative radio fluxes for many of the objects listed here. The bracketed IDs indicate sources that have not been observed by the authors within the context of this paper, but archived data is used in the analysis.
aSHARC-2 detection offsets are with respect to the published radio positions.
bBoth of these sources are likely contributors to the observed1100µm flux. The Bolocam data are ignored in the analysis.
cChapman et al. (2005): “These SMGs have double radio identifications, both confirmed to lie at the same redshift.”
dChapman et al. (2005): “These SMGs have double radio identifications, one lying at the tabulated redshift and a second lying at z<
0.5.” The higher redshift source is assumed to be the dominant contributor.
eSHARC-2
350µm fluxes from Laurent et al. (2006).
[image:24.612.157.636.139.375.2]β
Td
(K)
4·1012 5·1012
1013 3·1013
1014 1015
0 0.5 1 1.5 2 2.5 3
[image:25.612.188.463.218.491.2]10 100
Figure 2.2 The characteristic dust temperatureTd and effective emissivity indexβ are highly
cor-related parameters of the SED fit for the typical SMG, even when three photometric data points allow simultaneous fitting of bothTd andβ (source 13 from Table 2.2, shown with solid 1,2 and
3σ contours). However, by assumingβ = 1.5, we can accurately constrain luminosities (dotted
1024 1025 1026 1027
103
100
W Hz
-1
Rest Frame Frequency (GHz) Rest Frame Wavelength (µm)
MAMBO (1200 µm) Bolocam (1100 µm) SCUBA (850 µm) SHARC2 (350 µm) SHARC2 (Laurent 2006)
[image:26.612.184.461.200.491.2]Arp220
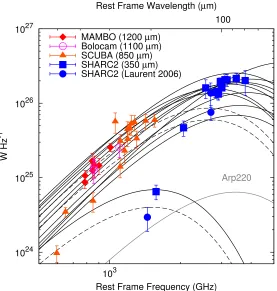
Figure 2.3 Optically thin grey-body SED models were fitted (solid lines) to the various available observed fluxes, and are transformed to the rest frames of the galaxies for comparison. Fits using (Laurent et al. 2006) data also shown (dotted lines). All the spectra peak in the neighbourhood of the redshifted350µm point, providing testimony of the pivotal importance of the SHARC-2 data
point in constraining these models. The SEDs shown represent our best fit to the data for sources detected by SHARC-2, use an emissivity indexβ = 1.5, and incorporate radio fluxes via the
effective characterization of dust emission in a galaxy as a whole. In this sense, the characteristicβ
values, expected in the range1−2, reflect both the underlying grain emissivities, and a distribution
of physical temperatures within the observed objects.
Simultaneous fitting of T and β requires at least three photometric data points (while many
SMGs have only two), and even when permitted these are highly correlated parameters of the fit for the typical SMG (fig. 2.2). Therefore, we initially assumeβ = 1.5for the SED fit, as it provides
good characterization of actively star-forming environments, both in accurately modeled galactic clouds (Dupac et al. 2003) and galaxies of the local universe (Dunne & Eales 2001), and is broadly consistent with laboratory measurements on carbite and silicate grains (Agladze et al. 1996). The properties, thus derived, may be scaled to theβ values of the reader’s choosing, via the deduced
spectral indicesεandλlisted in the Tables 2.2 and 2.3 as,
Td∝β−ε, LF IR∝β−λ, Md∝βε(4+β)−λ. (2.3)
We included 15%calibration uncertainty in addition to the published statistical uncertainties
for all submillimeter data. Nevertheless the luminosities are constrained accurately because the SHARC-2350µm measurement falls near the emission peak for all of these sources (fig. 2.3).
Flux boosting or Eddington bias (Coppin et al. 2005), in the case of less significant detections, where the selection is in the submillimeter, induce a small bias in the derived SEDs. As the bias will not apply to follow-up measurements, and because the exact quantification of the Eddington bias is nontrivial, requiring a priori knowledge of the underlying source distributions, we left fluxes uncorrected for its effects.
For the first time we are able to use multiband photometry to determine accurately the char-acteristic dust temperatures and far-infrared luminosities for the SMG population. Luminosities (Tables 2.2 and 2.3) are calculated analytically from the fitted grey body modelS(ν, T), following
(De Breuck et al. 2003),
LF IR= 4π DL2Γ(4 +β)ζ(4 +β)
kT hν
4+β
ehν/kT −1ν S(ν, T), (2.4)
where luminosity distances (DL) were obtained3for aΛ-CDM cosmology withH0= 65km s−1Mpc−1,
ΩM = 0.3andΩΛ = 0.7. The above expression provides the correct SED integral as long as the tran-sition from the optically thin grey-body approximation to optically thick black body is above the emission peak where the contribution to the total luminosity is negligible. If power law Wien tails, with spectral slopes of−α(Blain et al. 2003), are assumed instead, the luminosities can be scaled
by a constantηβ(α), which is around 1.5 for an Arp220 type template withα= 2. More generally,
in the range ofα∼1.1–4.0 andβ ∼0–3, the values ofηare well approximated (with an rms of5%
or0.02dex) by the empirical formula,
ηβ(α)≈(1.44 + 0.07β)(α−1.09)−0.42.
Similar corrections may be derived for the case of increasing optical depth, withηas a function of hν0/kT.
Illuminated dust masses (Tab. 2.3) were also estimated from the SED model S(ν, T), using
(De Breuck et al. 2003),
Md= S(ν, T)D
2
L
(1 +z)κd(νrest)B(νrest, Td).
Here, the normalization for the absorption efficiency was assumed to beκ850µm = 0.15m2kg−1, representing the extrapolated average125µm value of2.64±0.29m2kg−1(Dunne et al. 2003) from various models by assumingβof 1.5. In comparison to the gas masses derived from CO
measure-ments (Greve et al. 2005; Tacconi et al. 2006)4, we find an average gas-to-dust ratio of54+14
−11[κ850µm/0.15m2kg−1], resembling the ratios seen in nuclear regions of local galaxies by Seaquist et al. (2004), who assume
aκdXCO product comparable to ours. The individual measurements indicate an intrinsic spread of'40% around the mean value. The low ratios may be interpreted as an indication for the
rela-tive prevalence of dust in SMGs over the local population which typically exhibit Milky Way like gas-to-dust ratios around120(Stevens et al. 2005) or, alternatively, that absorption in SMGs is more
efficient withκ850µm≈0.33m2kg−1.
Our estimates of the dust temperatures, and hence luminosities, are systematically lower, than those anticipated based on the 850µm and1.4GHz fluxes alone by Chapman et al. (2005), who
overestimate these quantities by13%and a factor of'2 respectively, when assuming the local
far-infrared to radio correlation. This discrepancy can be fully reconciled if a different constant of correlation is assumed for SMGs (see Section 2.4).
We confirm that the SMG population is dominated by extremely luminous (several times1012L)
systems with'109Mof heated dust, and characteristic35K dust temperatures typical to actively
star forming ULIRGs. As anticipated, these objects resemble the nearby archetypal ULIRG, Arp220 (withTd ≈ 37K, similarly obtained), except that they are about 7 times more luminous on
aver-age.
2.3.1 Cold, Quiescent SMGs?
In addition, there appear to a be several cooler (Td .25K), less luminous (1011–1012L) objects,
albeit with comparable dust masses (few times109M
) present in the population (sources 14 and 4The CO fluxes from Tacconi et al. (2006) were converted into gas masses using the conversion factor X
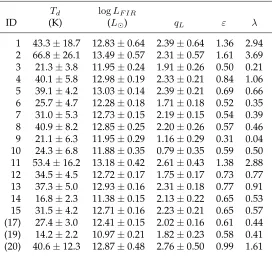
Table 2.2. Far-Infrared Properties of SMGs from SHARC-2 Data
Td logLF IR
ID (K) (L) qL ε λ
1 43.3±18.7 12.83±0.64 2.39±0.64 1.36 2.94
2 66.8±26.1 13.49±0.57 2.31±0.57 1.61 3.69
3 21.3±3.8 11.95±0.24 1.91±0.26 0.50 0.21
4 40.1±5.8 12.98±0.19 2.33±0.21 0.84 1.06
5 39.1±4.2 13.03±0.14 2.39±0.21 0.69 0.66
6 25.7±4.7 12.28±0.18 1.71±0.18 0.52 0.35
7 31.0±5.3 12.73±0.15 2.19±0.15 0.54 0.39
8 40.9±8.2 12.85±0.25 2.20±0.26 0.57 0.46
9 21.1±6.3 11.95±0.29 1.16±0.29 0.31 0.04
10 24.3±6.8 11.88±0.35 0.79±0.35 0.59 0.50
11 53.4±16.2 13.18±0.42 2.61±0.43 1.38 2.88
12 34.5±4.5 12.72±0.17 1.75±0.17 0.73 0.77
13 37.3±5.0 12.93±0.16 2.31±0.18 0.77 0.91
14 16.8±2.3 11.38±0.15 2.13±0.22 0.65 0.53
15 31.5±4.2 12.71±0.16 2.23±0.21 0.65 0.57
(17) 27.4±3.0 12.41±0.15 2.02±0.16 0.61 0.44
(19) 14.2±2.2 10.97±0.21 1.82±0.23 0.58 0.41
(20) 40.6±12.3 12.87±0.48 2.76±0.50 0.99 1.61
Note. — A summary of the derived far-infrared proper-ties of the observed SMGs. All quantiproper-ties were derived using an optically thin approximation withβ = 1.5. Temperatures
and luminosities may be scaled to other β values using the
relations of eq. (2.3), and the corresponding indecesεand λ
listed in here. The qL values derived from the radio data of
[image:29.612.189.461.220.476.2]19, and possibly 3, 9 and 10 in Tables 2.2 and 2.3). While these resemble the Milky Way in temper-atures, and hence probably in star formation densities, they are tens of times more luminous than the Galaxy.
This combination of extreme dust masses yet surprisingly low relative star formation rates, indicated by the lesser dust heating, allude to possibly incorrect low redshift identifications. Should these galaxies lie at the higher, more typical redshifts of the SMG population, their temperatures and luminosities would closely resemble those of the hotter population. However, while lensing of distant SMGs by massive foreground galaxies at the measured redshifts, is conceivable (Blain et al. 1999a; Chapman et al. 2002), these should be rare, and unlikely to account for all cold SMGs.
Alternatively, these seemingly normal type galaxies could, potentially, be remnants to the more remote, hotter population of SMGs, once the short lived starbursting activity subsides. Dust could persist and remain detectable in the more proximate universe, provided that radiation from the rapidly growing black holes (Borys et al. 2005; Alexander et al. 2005a) does not disperse dust en-tirely, e.g., dusty QSOs of Benford et al. (1999) and Beelen et al. (2006), or if the dust can later re-assemble to form large disk galaxies, like source14which is consistent with the large spiral disk
galaxy seen in HST images (Almaini et al. 2006; Borys et al. 2006), or the cold dust mergers sug-gested by the chain of16µm emission seen for source19. This connection between the hot and
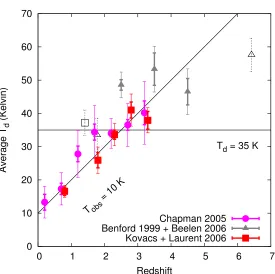
cold SMGs is further hinted at by the apparent trend of dust temperatures increasing with redshift (fig. 2.4) even without the low redshift data. We, therefore, find the existence of massive cold SMGs plausible.
2.4 The Far-IR/Radio Correlation at High Redshifts
One of the most valuable uses of the new measurements is to test the local far-infrared to radio correlation at the redshifts of SMGs (z ∼ 1–3). The simple extension of the correlation into the
distant universe was suggested by earlier studies based on a combination of1.4GHz radio with
ISO15µm (Garrett 2002) andSpitzer24µm and70µm observations (Appleton et al. 2004), both of
which take advantage of SED template fitting to extrapolate fluxes into the far-infrared regime. More recently, Beelen et al. (2006) hints at the validity of the correlation in the case of a handful of distant (z∼2−6) quasars with SEDs well constrained directly from far-infrared measurements.
A quantitative treatment of the correlation (Helou et al. 1985), has been formulated in terms of IRAS60µm and100µm fluxes, expressed in the rest frame as,
q= log
F IR
3.75×10¹²W m−2
−log
S1.4 GHz
W m−2Hz−1
, (2.5)
where the far-infrared parameterF IR= 1.26×10⁻¹⁴(2.58S
0 10 20 30 40 50 60 70
0 1 2 3 4 5 6 7
Average T
d
(Kelvin)
Redshift
Tobs = 10 K
Td = 35 K
[image:31.612.186.461.194.468.2]Chapman 2005 Benford 1999 + Beelen 2006 Kovacs + Laurent 2006
Figure 2.4 Median dust temperatures vs. redshift. Data is binned for this paper (squares), for the Chapman et al. (2005) sample (dots) with temperatures estimates incorporating the radio data, and for dusty quasars (triangles). 1σ error bars were estimated from the scatter inside the bins and
the uncertainties of dust temperatures where available (thick bars). Dispersion within bins are also shown (thin bars), while dotted error bars indicate measurement error for single datum inside a bin.
Tdof35±3K may be applicable forz ∼1.5–3.5 which, if true, can provide photometric redshifts
in that range. However, observing frame temperatures of around10K appear to fit the SMG data
somewhat better than constantTd in the rest frame. This similarity of the SEDs in the observing
S60µmandS100µmare in Jy. The quantity essentially estimates the flux in a wide band centered at
80µm, and is a good tracer of the far-infrared luminosity for temperatures in the range of 20–80 K
and emissivity indicesβ∼0–2 (Helou et al. 1988).
Perhaps, a better measure of the correlation is obtained by directly comparing luminosities. Therefore, we propose to use,
qL= log
LF IR
4.52 THz·L1.4 GHz
. (2.6)
Here the normalization frequency4.52THz has been derived for the adopted grey-body model5
such thatqL → qforT = 40K andβ = 1.5, thus approximating the original definition ofqwhile
extending its usefulness beyond the original restrictions in temperature and emissivity. Radio lu-minosities, in turn, are calculated as,
L1.4 GHz= 4πD2LS1.4 GHz(1 +z)α−1, (2.7)
which includes a bandwidth compression by(1 +z)−1 and a K-correction(1 +z)α to rest frame
1.4GHz. We assume a synchrotron power law ofS ∝ν−α, with the spectral indexαfor which a
typical value of0.7(Condon 1992) of nonthermal radio sources, is assumed for the calculations.6
We confirm that the far-infrared to radio correlation appears to hold throughout the redshift range ofz ∼ 1–3 (figs. 2.5 and 2.6), with the notable exceptions of sources 9 and 10, which likely
host radio loud AGNs7. The detections revealq ≈2.07±0.09andq
L = 2.12±0.07with intrinsic
spreads estimated atσq ≈0.21andσqL ≈0.12around the respective mean values. The alternative radio fluxes of Biggs & Ivison (2006) provideqvalues that are higher by0.06on average and scatter
slightly more withσq ≈0.30andσqL ≈0.23. The reduced dispersion inqLvs.qand the somewhat peculiar case of the two cold lower redshift objects (14 and 19), whose derived dust temperature of only16K fall outside the range whereF IRtraces luminosity (eq. [2.5]), highlight the practicality
of the luminosity-based measure qL vs. the originalIRAS-based one. The derived mean values
are significantly less than the locally observed median values of2.75±0.03for local spirals and
starbusts galaxies from theIRASFaint Catalog (Condon & Broderick 1991),2.34±0.01for radio
identified, flux limited (S60µm>2Jy)IRASsources (Yun et al. 2001) or'2.3 for a range of normal galaxies (Condon 1992) that include spirals and irregulars, E/S0 types, IRASand radio selected samples. The corresponding local scatters are also larger withσq = 0.14,σq = 0.33andσq .0.2
respectively.
5If SEDs include power-law Wien tails instead, the normalizing frequency should be appropriately scaled byηβ(α).
Similar adjustements to the normalization can be derived for any other SED model, hence the shape of the particular SED model used has no effect on the correlation parameterqLotherwise.
6The assumption of the radio spectral indexαis not critical. Indeces different byδαmay produce a small bias inqon the
10.5 11 11.5 12 12.5 13 13.5 14 14.5
23 23.5 24 24.5 25 25.5 26
log (L
FIR
/ L
sun
)
[image:33.612.184.465.223.487.2]log (L1.4GHz / [W Hz-1])
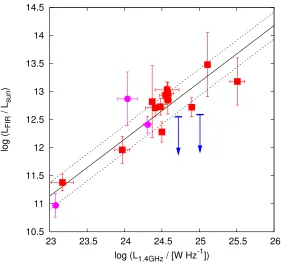
Figure 2.5 The radio to far-infrared correlation for SMGs. Galaxies observed by the authors shown with squares, data from Laurent et al. (2006) with dots. 2σ upper limits are indicated when
ap-propriate (arrows). Far-infrared luminosities were calculated exclusively based on the available submillimeter measurements, with β = 1.5. The best fit model (solid line) reveals no deviation
from linearity in the relationship. The deduced 2σ instrinsic scatters around the model are also
Moreover, we find the relationship to be linear, within measurement uncertainty, over nearly three decades of luminosities of the observed SMGs, with a best fit FIR to radio luminosity in-dex,dlogLF IR/dlogL1.4 GHz, of1.02±0.12. Nonetheless, small levels of nonlinearity, like those
discussed by Fitt et al. (1988); Cox et al. (1988); Devereux & Eales (1989) and Condon et al. (1991) remain possible.
The lowqvalues, the tightness of the correlation, the observed linearity, and the typically warm
dust temperatures, all point to dust heating that is dominated by high mass (>8M) stars. In the
two component model of Yun et al. (2001), short lived (<107yr) high mass stars fuel the ’hot’ ther-mal component that is strongly coupled to the nontherther-mal radio via Type II supernovae, whereas the ’cold’ component heated by a different population of lower mass stars is expected to produce a different correlation with a weaker coupling. They estimateq1 = 2.3andq2>4respectively for the components. As most galaxies contain both components, intermediateqvalues are typically
observed. The lowqs that characterize SMGs are, therefore, indicative of the predominance of high
mass star formation in the dust heating. Moreover, the SMG result forces the revision of the ’hot’ component correlation toq1 .2.1, or lower still (by about0.16), if steeper radio spectral slopes of
α'1are assumed for these very luminous objects (Yun et al. 2001).
The presence of radio-quiet AGNs would contribute to the total far-infrared emission, biasing towards higherqs. Radio-loud AGNs, on the other hand would produce lowqvalues, albeit to
wildly varying extent, which should manifest as an increased spread in the correlation. The tight-ness of the observed correlation, therefore, confirms that radio loud AGNs are rare, while the low
qvalues, otherwise observed, indicate that the AGN contribution to the far-infared luminosity is
small when compared to heating from star formation-activity in SMGs. This is consistent with Alexander et al. (2005a,b), who used ultradeep Chandra X-ray data to find that the AGNs, present in at least 75% of SMGs, contribute little to the total bolometric luminosity of their hosts. Dust heating, therefore, is assumed to be star formation dominated.
Last but not least, the lowqvalues observed may partially arise from selection bias as our initial
sample would miss SMGs with low radio fluxes, i.e., sources with higherqvalues, in the secondary
selection required for redshift identification. However, faint radio sources with undetectable sub-millimeter counterparts, representing a hypothetised hot extension to the SMG population, may be more typical (Chapman et al. 2004; Blain et al. 2004), and thus selection bias could be reversed, missing the lowqvalues instead.
2.5 Dust Emissivity Index
23
0.5 1 1.5 2 2.5 3
0 0.5 1 1.5 2 2.5 3 3.5 4
q
Redshift
0.5 1 1.5 2 2.5 3
0 0.5 1 1.5 2 2.5 3 3.5 4
qL
Redshift
Figure 2.6 (a) Original definition ofqfrom Helou et al. (1985), and (b) the modified, luminosity based definitionqLas a function of redshift. 2σ
upper limits are indicated as appropriate (arrows). Data from this paper are shown with squares while those from Laurent et al. (2006) as dots. The observed SMGs seem to consistently fall below the locally observed mean of2.34(Yun et al. 2001) for local brightIRASsources (solid line) whose
2σscatters are also indicated (dashed lines). The values were all derived assumingβ = 1.5. The derived distribution mean values of the nonradio
[image:35.612.111.679.149.423.2]MAMBO (Greve et al. 2004) and/or Bolocam (Laurent et al. 2005) detections at longer wavelengths, providing justification for a 3-parameter fit. In practice, however, such an approach is unlikely to yield robust quantities for individual galaxies (see fig. 2.2) owing to the proximity of the observed bands and the modest significance of the detections. Therefore, we aimed to fit a single emissivity slope β for the entire sample hoping to provide a better constrained, ensemble averaged, dust
emissivity index. Moreover, we extend our sample to Chapman et al. (2005) SMGs with multiband submillimeter data which were not observed in this paper. MAMBO associations (Greve et al. 2004) and the350µm follow-up of Bolocam and candidates (Laurent et al. 2006) provide 5 extra sources.
We analyze separately the data consisting of detections only, and that including measurement peaks inside the search area for nondetections. While the first set may appear more robust, it could be more susceptible to selection biases due to the rigorous detection requirement. The larger set, containing upper limits, is thus likely to be less biased of the two, and could provide a better characterisation of the whole SMG population.
We have used a modified, nested, version of the downhill simplex method (Press et al. 1986) to perform the fit, yieldingβ = 2.42±0.71, a value that is too uncertain to distinguish between the
expected values in the range of1−2. However, the demonstrated validity of the linear far-infrared
to radio correlation for the SMG sample, allows us to incorporate the radio fluxes to constrain the total integrated far-infrared luminosities, and improve the quality of the fit. Here we assumed
0.12dex as the intrinsic spread inqL, producing the expected model deviation withχˆ2 → 1, and
consistent with the scatter observed for local spirals and starbursts (Condon et al. 1991).
To avoid radio loud objects biasing our analysis, we ignored sources 9 and 10 due to their a priori lowqLvalues. At the same time, we utilized a modifiedχdeviation definition to allow some
of the sources to become “radio loud” in the fit, i.e. to significantly deviate from the correlation in the lowerqLdirection. Specifically, when the derivedqLvalue for a source is more than2σbelow
the averageqL of the fit, we use a relaxed deviation withσq0L = 2, more characteristic of radio loud objects, while keepingχ2continuous over the entire parameter space. The fraction of normal sources falsely identified as “radio loud” by this method is expected to be around2%, and therefore
the effects of mischaracterizations are expected to remain limited.
With the local medianqvalue of2.34we obtainβ = 0.81±0.19 for the detections andβ = 1.00±0.19when all the available information is used in the analysis. Both these results imply an
emissivity index significantly less than the usually quoted values around1.5. The interpretation,
however, relies entirely upon the assumption that the local radio–far-infrared correlation holds unaltered for higher redshifts.
For a more rigorous treatment, we obtained confidence contours for the likely combinations of bothβandqL(fig. 2.7), hence avoiding a priori assumptions on both of these quantities. The smaller
Table 2.3. Properties of SMGs Incorporating Radio Data
Td logLF IR logMd
ID (K) (L) (M) ε λ
1 37.2±3.8 12.60±0.12 8.64±0.17 0.82 1.09
2 60.3±6.1 13.34±0.12 8.22±0.16 0.86 1.15
3 23.5±2.5 12.10±0.15 9.24±0.17 0.72 0.82
4 37.1±3.4 12.86±0.11 8.91±0.14 0.77 0.89
5 36.8±3.3 12.94±0.12 9.01±0.12 0.67 0.65
6 38.6±7.0 12.66±0.13 8.61±0.33 0.94 1.29
7 30.3±3.9 12.71±0.09 9.24±0.25 0.68 0.78
8 39.8±4.5 12.81±0.12 8.69±0.19 0.71 0.93
9a 21.1±6.3 11.95±0.29 9.36±0.48 0.31 0.04 10a 24.3±6.8 11.88±0.35 8.93±0.37 0.59 0.50 11 41.5±4.4 12.82±0.13 8.60±0.16 0.80 0.99
12 43.2±4.7 13.01±0.10 9.69±0.17 0.96 1.40
13 34.8±3.2 12.84±0.10 9.04±0.14 0.73 0.83
14 16.8±1.9 11.38±0.14 9.32±0.19 0.72 0.74
15 30.7±3.2 12.68±0.12 9.18±0.16 0.70 0.75
(17) 28.6±2.3 12.47±0.12 9.14±0.13 0.75 0.85
(19) 16.4±1.7 11.17±0.13 9.17±0.16 0.81 1.02
(20) 28.6±3.5 12.31±0.17 8.98±0.15 0.76 1.02
Note. — Quantities are derived similarly to Table 2.2, ex-cept that the radio data are also incorporated with qL =
2.14. The estimate of the dust masses additionally assumes
κd(850µm) = 0.15m2kg−1for the dust absorbtion efficiency.
[image:37.612.191.456.219.477.2]β
qL
Arp220
0 0.5 1 1.5 2 2.5 3 1.8
[image:38.612.179.463.72.358.2]1.9 2 2.1 2.2 2.3 2.4 2.5 2.6 2.7 2.8
Figure 2.7 Likelihood contours (at 68%, 90% and 95% confidence) for the dust emissivityβand the
radio to far-infrared correlation constantqL, using only the available detections (dashed curves)
and all information, including nondetections (solid curves). The best fit locii of both fits are indi-cated by crosses. The more inclusive set is expected to be a more reliable indicator of SMG prop-erties, as it is less affected by the selection biases that are introduced by requiring detections in all bands. A similar fit to Arp220 is also indicated (black dot).
’normal’qL, with the best fit located at the respective values of0.95and2.27, whereas the more
inclusive data set tends towards emissivity indices in line with expectations, but withqLdecidedly
below the mean in the local universe. The best fit values of the extended set are atβ = 1.63and
qL= 2.10.
Accordingly, we assumedβ = 1.5and used the correspondingqL = 2.14 (from fig. 2.7) to
calculate most likely estimates of the far-infrared emission properties, which are listed in Table 2.3. Systematic biases in the cross-calibration, between the SHARC-2 and the longer wavelength data points, would introduce bias into the estimated emissivity index. Fortunately, with expected
10%relative calibration error, the resulting bias is onlyδβ'0.08, and our conclusions on the dust
2.6 Photometric Redshifts
Obtaining accurate redshifts for distant SMGs has relied on optical measurements, guided by ra-dio or optical associations (Chapman et al. 2003, 2005). This approach has been very successful, providing accurate redshifts for nearly a hundred SMGs to date, but it is unlikely to be practical for compiling much larger samples. Moreover, the identifications involving radio or optical coun-terparts could introduce selection biases into the samples. For both reasons a ‘holy grail’ of large submillimeter surveys has been to obtain redshifts directly from the radio, sub-mm and mid- to far-infrared (e.g.,Spitzer) if possible.
The simplest types of redshift estimators, such as Carilli & Yun (1999, 2000a,b), Wiklind (2003) and Laurent et al. (2006), assume that all SMGs have intrinsically similar rest-frame temperatures. In essence, redshifts are calculated as(1 +z)≈Td/Tobs(Blain 1999) for SEDs characterized byTobs
in the observing frame and an assumed representative dust temperatureTd for all objects. The
methods only differ on howTobsis estimated from the various available flux data. Only
indepen-dent, and accurate, measurements of actual dust temperatures for SMGs with known redshifts, can test the validity of this approach. We offer this test for the first time.
A glance at Tables 2.2 and 2.3 reveals that dust temperatures are distributed around 35K,
with some80%of the data between 25 and 45 K. The same conclusion is suggested by the larger
Chapman et al. (2005) sample, with the dust temperatures estimated from the SCUBA850µm and
radio data using the appropriate far-infrared to radio correlation as discussed above. This majority population of SMGs is consistent, within measurement uncertainty, with a single representative temperature of34.6±1.4K in the rest frame, with an estimated 3 K intrinsic dispersion around the
mean, lending some credibility to photometric redshifts derived as,
(1 +z)≈ 34.6T±3.0 K obs
1.5
β
0.71
,
in the redshift the range ofz∼1.5−3.5. However, the observations suggest that these photometric
redshift indicators could be wholly inappropriate for as many as20%of all SMGs, unless some
of these outliers have incorrect redshifts. Curiously, the very lowqL values measured for sources
14 and 19 hint at ’hot’-type galaxies (Yun et al. 2001), in apparent contradiction with the cool dust temperatures that are implicated at their low redshifts. This mismatch would be reconciled if the temperatures were typical at the photometriczvalues of2.96+0−0..4351and1.95+0−0..3328respectively.
While quasars (Benford et al. 1999; Beelen et al. 2006) too can be characterised by rest-frame SED templates, withTd ≈ 48±8K8 more or less uniformly acrossz ∼ 2−7, they are typically
hotter than SMGs, perhaps due to additional dust heating by an AGN. However, quasars, selected from larger volumes than SMGs, could provide the rare extension of the SMG population into ever
more extreme luminosities and hotter dust temperatures. If true, the different temperatures that characterize quasars vs. the bulk of SMGs, invalidates the single representative temperature as-sumption for all SMGs, already under fire from a minority population of cold SMGs, and therefore may oppose rather than support the applicability of temperature-based photometric redshifts.
Alternatively, the entireSMGs sample, including those low redshift data points, is better fit by temperature evolution of Td ∝ (1 +z), producing similar temperatures in the observed frame
(Tobs'10K), with an average deviation of|χˆ|= 1.40vs.|χˆ|= 2.67produced by the representative
rest frame temperature model when assuming a 10% intrinsic scatter inTd. Hence, the temperature
range that fits most SMGs could arise from the similar fractional dispersion of the redshift distribu-tion, i.e., objects selected near the median redshift of2.3tend to have temperatures of about35K.
As such, temperature-based photometric redshifts may not provide additional information beyond a reflection of the medianzof the sample.
A similarity of SEDs in the observed frame, yielding a nearly constant Tobs and thus Td ∼
(1 +z), could arise simply from selection effects that result from the minimum flux requirement for
detections (fig. 2.8), and the small dynamic range (of a factor'3) of flux densities that characterize
current SMG samples. As such, selection effects alone could render far-infrared and radio based photometric redshift indicators wholly unsuitable for unbiased flux and volume limited samples of SMGs.
2.6.1 Luminosity-Temperature Relation
An alternative, luminosity based approach exploits the hypothetical relationship between dust tem-peratures and the luminosities that they fuel, to derive photometric redshifts by comparing the rest frame relationship to observed temperature indicators and fluxes. Like other scaling relations that characterize galaxies, theL−T relationship would, presumably, be a genuine property of
galax-ies, reflecting the physics of galactic structure and dynamics. While the idea has been drafted by Yun & Carilli (2002), Blain et al. (2003) and Aretxaga et al. (2005), the particular implementation of such a method was left awaiting the determination of the actual form of such anL−Trelation.
We find, that the far-infrared luminosity is well approximated by a power law of the form,
LF IR=L0Tdγ×(1 +z)µ, (2.8)
for some exponentsγandµ. The expression incorporates the possibility of explicit redshift
evolu-tion, approximated by the term(1 +z)µchosen for convenience. This independent redshift term
is expected to absorb selection effects, and allow the determination of the underlying temperature dependence.
29
T
d(K)
L
FIR/L
sun10
100
10
1110
1210
13Arp220
NGC958
Mrk231
NGC1068
z=4
z=0.5
T
d(K)
(1+z)
-1.59
L
FIR/L
sun10
100
10
1010
1110
1210
13Arp220
NGC958
Mrk231
NGC1068
[image:41.612.114.695.129.399.2]Milky Way
Figure 2.8 Luminosity–temperature (L–T) relation. 1σ likelihood contours for grey-body models fitted to submillimeter data (this paper with
solid curves, Laurent et al. (2006) as dotted curves). Contours are also shown for objects not detected by SHARC-2 (dashed). The dusty quasars (triangles) of Benford et al. (1999) and Beelen et al. (2006), and some well-known objects with accurately constrained SEDs are also shown. The plot highlights the difficulty of measuring the unde