2016 3rd International Conference on Information and Communication Technology for Education (ICTE 2016) ISBN: 978-1-60595-372-4
1 INTRODUCTION
The crisis of traditional energy exhaustion is the main driving force to develop new energy resources, solar energy is favored by many scholars with its wide coverage, no pollution and low cost. However, the MPPT technology is the guarantee of efficient use of solar energy. But some solar cells are blocked by clouds, obstacles, surface solid particle, and become a load in the actual work environment, the surface of solar cell will be heated to form a “light spot effect”. Parallel bypass diode at both ends of a number of tandem solar cells to solve this phenomenon. However, the output characteristic curve will be changed. At this point, the P-U curve of the PV array exhibits multiple peaks, and traditional MPPT algorithm (such as admittance increment method and perturbation method, etc.) may find the local optimal solution[1]. So, it is very important to study a MPPT method under partially shaded conditions. Particle swarm optimization algorithm is adopted in the literature [2], but initial particle will be randomly distributed in the search space, and it is not targeted, or easy to fall into local optimal solution. Particle swarm optimization algorithm is also adopted in the literature [3], but its objective function is established in the case of fixed partially shaded conditions, and the practical application is not strong. Literature [4] uses support vector machine algorithm, but it is not really extended to the array model in the dynamic configuration conditions, and just stay in a simple model of the PV array or simulation test phase. Literature [5] uses the Monte Carlo algorithm, it needs to store and calculate a large number of random points, it will cause a large space occupied,
and the calculation speed is slow. Literature [6] uses Fibonacci sequence algorithm, the method can adapt to various partially shaded conditions, but the process is slow, and it is easy to fall into local optimal solution.
The GSO algorithm will be applied to the partially shaded MPPT in this paper. At first, based on the original algorithm, the initial distribution of population is improved, and the search speed is accelerated, then, according to the optimization process of the algorithm, the global maximum power point is found. Compared with the traditional algorithm, the new algorithm can better adapt to the multiple peaks conditions. The simulation results show that the algorithm has high convergence precision and fast searching speed.
2 ANALYSIS OF CHARACTERISTIC CURVE
According to the description of Literature [7] and [8], in the Matlab/Simulink, construct the simulation model of solar cells under partially shaded conditions, on the basis of this, the model of PV array is extended to 3×3. The parallel sub series are Ai, Bi, Ci (i=1, 2, 3).
Simulation using BP 4158 solar cell nominal parameters of BP Solar company, Vm=18V ,
4.72
m
I = A , Voc=22.1V , Isc=5A ,the reference
temperature is 25o
C,the reference light intensity is
2
1000W m/ .The PV array is arranged in partially shaded condition 1 and partially shaded condition 2.In the partially shaded condition 1, the light intensity of A1 and B1 is 2
800W m/ , the light intensity of C1 is 2
700W m/ , the light intensity of A2
Maximum Power Point Tracking for PV Array under Partially
Shaded Conditions Based on Glowworm Swarm Optimization
Algorithm
Hengjie Li, Kailan Kang, Wei Chen, Xianqiang Zeng
Lanzhou University of Technology, Lanzhou, China
and B2 is 2
600W m/ , the light intensity of C2 is
2
500W m/ , the light intensity of A3 and C3 is
2
300W m/ , the light intensity of B3 is 200W m/ 2. In
the partially shaded condition 2, the light intensity of
C1 is 2
600W m/ , the light intensity of A1 and C2 is
2
500W m/ , the light intensity of A2, B1 and C3 is
2
400W m/ , the light intensity of A3 and B2 is
2
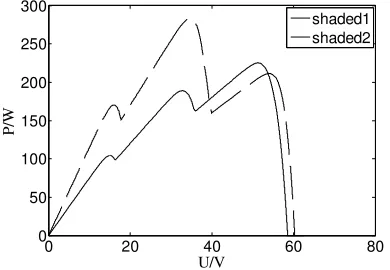
300W m/ , the light intensity of B3 is 2 200W m/ . Fig. 1 is the power output characteristic curve for two kinds of partially shaded conditions. It can be seen that the partially shaded condition 1, the global maximum power point is located at the second extreme points, as a result of the overall light intensity is larger, so the output power is also larger; The global maximum power point is located at third points in the partially shaded condition 2, and the output power is small due to the smaller overall light intensity. However, there are many peak points, and there is only one global maximum power point.
0 20 40 60 80
0 50 100 150 200 250 300
U/V
P
/W
[image:2.612.324.528.40.185.2]shaded1 shaded2
Figure 1. P-U curve under partial shaded conditions.
The output characteristic curve of PV array is more complicated in the case of partially shaded conditions, and the main performance is the multi extreme value of the power point. But through simulation and research, it is found that the distribution of the power extreme points is not chaotic, but is related to the series and parallel mode of the PV array under partially shaded conditions. The P-U characteristic curve of different array structure is shown in Fig. 2.
Using m n× to show the size of the PV array, m represents the number of series connection solar cells in a sub string, n represents the number of parallel sub strings, The experimental environment is partially shaded conditions. The P-U characteristic curve exhibits two extreme points, a global maximum power point in the 2 2× PV array; The P-U characteristic curve also exhibits two extreme points, a global maximum power point in the 2 3×
PV array; The P-U characteristic curve exhibits three extreme points, a global maximum power point in the 3 3× PV array.
0 10 20 30 40 50 60
0 50 100 150 200 250 300
U/V
P
/W
2×3PV 2×2PV 3×3PV
Figure 2. P-U curve of different array structures.
It is the conclusion that number and location of extreme points are related to the series and parallel mode of the PV array under partially shaded conditions. Through the analysis of the value of the voltage at the extreme points, the position of the extreme points is approximately in m×0.85×
(
Voc/n)
,oc
V is array open circuit voltage.
This conclusion is helpful to the initialization of the GSO algorithm. Usually the algorithm for the initial population of the location is evenly distributed, and take an empirical judgment on the quantity of the population. By judging the number and position of the extreme points of the power, the number of the population can be reduced effectively, and the position of the population is initialized, which improves the efficiency of the algorithm.
3 APPLICATION OF GSO IN MPPT
Glowworm swarm optimization (GSO) algorithm [9, 10] is a bionic swarm intelligence optimization algorithm inspired by a foraging activity from glowworm swarm, at present, it has been applied in many engineering field. The GSO algorithm for multi peaks MPPT optimization is constructed by the following four steps:
3.1 Glowworm swarm position initialization phase
Using 3 3× of the PV array, at this point there should be three power extreme points, distribution of three glowworm in the neighborhood of each extreme point, the region where the glowworm is
(
)
(
)
0.85 oc/ 3, 0.85 oc/ 3
m V n m V n
× × − × × +
,m=1,2,3;n=1,
[image:2.612.74.269.281.416.2]3.2 Glowworm swarm fluorescein update phase
The fluorescein value of each glowworm in the glowworm swarm is related to the objective function value of its location. Fluorescein update formula is
(
1) (
1) ( )
( )
i i i
l t+ = −ρ l t +γP u t (1)
Where l ti
( )
is the fluorescent value of theglowworm in the t times; ρand γrepresent the evaporation coefficient and enhancement coefficient of the fluorescence value; u ti
( )
represents thelocation of the glowworm in the t times;
( )
i
P u t represents the target function value of the glowworm iin the t times.
3.3 Glowworm swarm location update phase
According to the roulette algorithm, each of glowworm chooses to move in the neighborhood. The probability formula for glowworm movement
( )
( )
( )
( )
( )
( ) i
j i ij
k i k N t
l t l t P t
l t l t
∈
− =
−
∑
(2)( )
i
j∈N t , N ti
( )
represents the neighborhood ofthe glowworm i when the t times, it can be expressed as
( )
{
:( )
( )
i( ) ( )
;( )
}
i j i d i j
N t = j u t −u t <r t l t <l t (3)
( )
( )
j i
u t −u t represents the distance between the glowworm i and j when the t times;
( )
i d
r t represents the decision domain radius of the glowworm i when the t times.
The location update formula for the glowworm is
(
)
( )
( )
( )
( )
( )
1 j i
i i
j i
u t u t
u t u t d
u t u t
−
+ = + ×
−
(4)
dis glowworm moving step.
3.4 Glowworm swarm decision domain radius update phase
The number of neighbor glowworm determines the size of the decision domain radius. Update formula of glowworm swarm decision domain radius is
(
1)
min{
, max 0,{
( )
(
( )
)
}
}
i i
d s d t i
r t+ = r r t +β n −N t (5)
s
r is the sensing range of glowworm, 0 i d s
r r
< < ;
β is decision domain radius control coefficient;
t
n is the threshold of the number of neighbors glowworm.
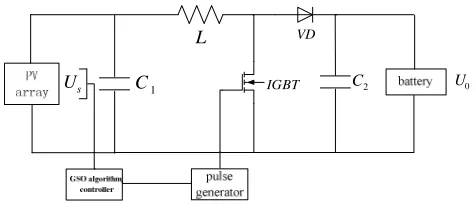
The MPPT control system is shown in Fig. 3.In the problem of MPPT, the full search range of GSO algorithm is u∈
[
0,Voc]
, the global maximum powerpoint is maxP u
( )
. Firstly, the duty ratio of the switch tube is D=0, and the open circuit voltage of the PV array is obtained, according to the law of the extreme points distribution of the initial position of the glowworm swarm, after the location of all the glowworm is distributed, record the u ti( )
and( )
i
P u t .
s
U
L
IGBT
1
C
VD
2
[image:3.612.316.554.149.251.2]C U0
Figure 3. Principle of MPPT control system.
Then, according to the steps of the GSO algorithm, when the position of the glowworm swarm is updated, the duty ratio of the boost circuit is adjusted to drive the pulse generator, and the voltage of the PV array is the voltage value of the current position u ti
( )
, the update formula for dutyratio is
0
1 s/
D= −U U (6)
s
U is the current operating voltage of the PV array, U0 is the voltage at both ends of the battery.
The current PV array voltage and power value, that is, the location of the glowworm and the fitness value, as the initial value of the next update, into the GSO algorithm controller; Until the termination condition is reached, the optimal position of the glowworm is set to the working voltage of the PV array at this time. The formula for the termination conditions are
( )
(
)
maxP u t i =maxP u t i −1 (7)
( )
(
)
4maxP u ti maxP u ti 1 10
−
− − <
(8)
(7) and (8) formula satisfies one of these to achieve termination conditions.
4 SIMULATION ANALYSIS
4.1 Simulation initialization conditions
The simulation model of PV array is adopted in 3×3. The simulation parameters of boost circuit are
1 4
L = mH,C1=200µF,C2=1000µF. The simulation
situations: uniform solar, partially shaded 1, partially shaded 2. The working parameters of partially shaded 1 and partially shaded 2 have been given, under the condition of uniform illumination, the light intensity of each solar cell is 2
800W m/ .
4.2 Partially shaded simulation
The partially shaded 1 and partially shaded 2 are simulated and compared with the particle swarm optimization (PSO) algorithm.
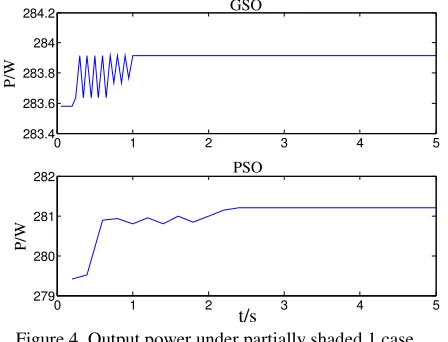
Situation of the partially shaded 1, the change of the output power is shown in Fig. 4. The actual maximum power value is 283.920W. GSO algorithm is updated to meet the termination condition for the 13 times. At this time with 1.0 second, the global maximum power value of the algorithm is 283.918W, and the difference of the actual maximum power is 0.002W, and the convergence rate is 99.9%; PSO algorithm is updated to meet the termination condition for the 28 times. At this time with 2.4 seconds, the global maximum power value of the algorithm is 281.19W, and the difference of the actual maximum power is 2.73W, and the convergence rate is 99.04%.
0 1 2 3 4 5
283.4 283.6 283.8 284
284.2 GSO
P
/W
0 1 2 3 4 5
279 280 281
282 PSO
t/s
P
[image:4.612.327.546.67.235.2]/W
Figure 4. Output power under partially shaded 1 case.
Situation of the partially shaded 2, the change of the output power is shown in Fig. 5. The actual maximum power value is 222.08W. GSO algorithm is updated to meet the termination condition for the 22 times. At this time with 1.6 seconds, the global maximum power value of the algorithm is 222.06W, and the difference of the actual maximum power is 0.02W, and the convergence rate is 99.9%; PSO algorithm is updated to meet the termination condition for the 35 times. At this time with 3.4 seconds, the global maximum power value of the algorithm is 220.46W, and the difference of the actual maximum power is 1.62W, and the convergence rate is 99.72%.
Situation of the partially shaded 2, global maximum power point is located in the three extreme points. Because of the farther distance between the glowworm in the GSO algorithm, therefore, the convergence rate is relatively slow
compared with the partially shaded 1, but eventually it also can trace the global maximum power point.
0 1 2 3 4 5
221.95 222 222.05 222.1
222.15 GSO
P
/W
0 1 2 3 4 5
218 219 220
221 PSO
t/s
P
[image:4.612.68.292.334.505.2]/W
Figure 5. Output power under partially shaded 2 case.
From the simulation, it ' s clearly that GSO algorithm can accurately and quickly track the global maximum power point in all kinds of partially shaded environment, and has higher convergence rate and faster searching speed compared with the PSO algorithm.
5 CONCLUSION
In this paper, the distribution of multiple extreme points of P-U output characteristic curve is analyzed based on the simulation model of partially shaded PV array, and it is applied to the initialization of GSO algorithm, which can find the global maximum power point more effectively. The following conclusions can be obtained from the simulation results: GSO algorithm can be better applied to the MPPT of partially shaded conditions; Compared with the PSO algorithm, GSO algorithm has a greater advantage in the MPPT of partially shaded conditions.
6 ACKNOWLEDGMENT
This work is supported by National Natural Science Foundation of China (51267012), Gansu Provincial Natural Science Foundation of China (1504GKCA033).
REFERENCES
[1] Esram T, Chapman P L. Comparison of photovoltaic array maximum power point tracking techniques [J].IEEE Transactions on Energy Conversion, 2007,22 (2): 439-449. [2] Patel H, Agarwal V. Maximum power point tracking
[3] Liu Y L, Zhou H, Cheng Z. MPPT Control Method of PV System Based on PSO [J]. Computer Engineering, 2010, 36(15):265-267.
[4] Chen Alian Feng Lina Du Chunshui Zhang Chenghui. Modeling of Photovoltaic Array Based on Support Vector Machines Under Partial Shaded Conditions [J]. Transactions of China Electrotechnical Society, 2011, 26(3):140-146.
[5] Tang L,Zeng C,Miao H,et al. A Novel Maximum Power Point Tracking Scheme for PV Systems Under Partially Shaded Conditions Based on Monte Carlo Algorithm [J]. Transactions of China Electrotechnical Society, 2015. [6] Ramaprabha R, Mathur B, Ravi A, et al. Modified
Fibonacci search based MPPT scheme for SPVA under partial shaded conditions[C]//3rd International Conference on Emerging Trends in Engineering and Technology. Goa, India: IEEE, 2010: 379-384.
[7] Yang Y Z K. Photovoltaic Cell Modeling and MPPT Control Strategies [J]. Diangong Jishu Xuebao/transactions of China Electrotechnical Society, 2011, 26:229-234. [8] Liu X, Xinmei Q I, Zheng S, et al. Model and Analysis of
Photovoltaic Array Under Partial Shading [J]. Power System Technology, 2010, 34(11):192-197.
[9] Krishnanand K N, Ghose D. Glowworm swarm based optimization algorithm for multimodal functions with collective robotics applications [J]. Multiagent and Grid Systems, 2006, 2(3): 209-222.