2017 2nd International Conference on Computational Modeling, Simulation and Applied Mathematics (CMSAM 2017) ISBN: 978-1-60595-499-8
Modeling and Optimizing the Process of Airport Security Checking
Jia-lin LI, Shuang ZHANG, Qi-xiang YAN and Zhi-dan CAI
*School of Science, Changchun University of Science and Technology, Changchun 130022, China
*Corresponding author
Keywords: Multi-server model, Bottleneck area, LCIOWF network model, Optimization.
Abstract. We firstly identified the bottleneck area at the Airport checkpoint based on the multi-server model, and proposed some schemes to increase checkpoint throughput and reduce variance in waiting time.Then analyzed the process based on the LCIOWF network model, simulating the passengers throughput under different schemes to verify our model and schemes. Comparing the modified simulating result with the unmodified one, we find that the modified simulating throughput is about 70 Pax more than the unmodified throughput. At the same time, we analyzed the process based on the LCIOWF network model, simulating the passenger throughput under different schemes to verify our model and schemes. The result shows that our scheme achieves a great optimization.
Introduction
More and more people take flights to travel nowadays all over the world. The figure 1 shows the top 50 airport in the world. We can see that America takes up the most part[1][2]. The total number of passengers is increasing as the year grows. For example, we can see that the total passenger in Denver International Airport in 2016 is much more than that in 2015 and even approach at a peak point in July-5492 thousands as it is displayed in figure 2. So airport security problem has been the world concerns at the airport. Airport security checkpoints, passengers and their luggage checked explosives and other dangerous things should be available to check, to ensure to keep all the passengers' safety during the trip. Large hub airport traffic was huge; however, if there is no efficient airport planning and operation organization, it is hard to believe that the security can be conducted systematically. And airlines want to get more benefit, so that to ensure the safety of passengers to maximum at the same time, minimize the security checkpoint queue waiting for the flight time.Therefore, planning and operations of the airport security are very important.
[image:1.595.55.542.534.669.2]
Figure 1. The top 50 Airports in the world. Figure 2. The total passenger in Denver International Airport.
Model Establishment
Sub-model: Multi-server Queuing Model
arrangement is illustrated in figure 3. The Zone A is the entrance area, the Zone B is the checking area and the Zone C is the Exiting area.
Security checking problem is a typical problem about queuing system. Obviously, we could find that it is a process which multiple service counters are in tandem. In order to know the process of how the passengers to arrive at the airport, we analyzed the sample data and get the graph of arrival time and its probability distribution by MATLAB.
[image:2.595.58.538.172.332.2]
Figure 3. The Floor of TSA Security Checkpoint. Figure 4. Passengers' arrival time and its probability distribution.
From the figure 4 above, we could know that the arrival time obeys the normal distribution. But the number is not a tiny integer in this problem, and its limit is the possion distribution, so we can get an approximation of the result, using the poisson distribution instead.
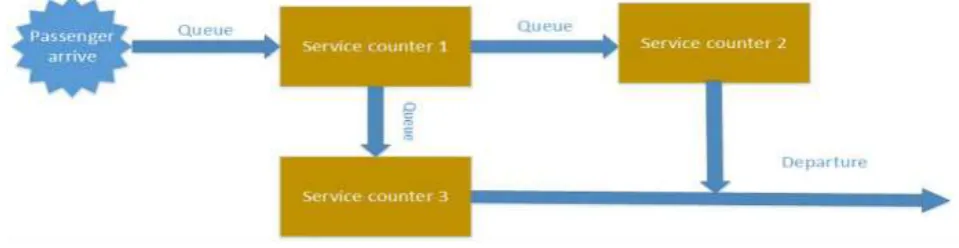
Figure 5. The security queuing system schematic diagram.
In Figure 5, the service counter 1 represents the link of ID information check of the zone A in the process, the service counter 2 represents the link of screening of the zone B in the process, the service counter 3 represents the link of collecting belongings of the zone C in the process.
In addition to note: figure 10 can also be used as a model diagram of Pre-check queue, but because we regard the whole of several scanning process in area B as a service counter, so the two types of the process could be similarly analyzed. So we can only consider the screening process of normal queue. We can only consider a single security checkpoint because each security process is the same, although several security checkpoints open at the same time. It is obvious that if there is security process bottleneck somewhere, the queue length will be longer and the passengers will wait for a longer time there. We could regard the average queue waiting time and average queue length as the indicator find the bottleneck area.
[image:2.595.57.537.398.522.2]At this point, each service counter could be considered as an independent system, so we can assume that the probability which there is no passenger in ith(i1,2,3)system ispi0, the probability which there are npassengers is pin, the model can be established as follows:
The following notation in the model denotes:
i
: The queuing system’s arrival rate of the ith service counter.
i
: The queuing system’s service rate of the ith service counter. n: The actual number of passengers of the queuing system.
0 i
p : The probability of no passengers of the queuing system.
in
p : The probability of n passengers of the queuing system.
Since we assume that the passengers arrive at the service counter obeys the poisson distribution, the service time obey the negative exponential distribution, and under the statistical equilibrium, the output of the queuing system process is still a poisson process[3]; The passengers who arrive at the ith service counter obey the poisson distribution with the parameter i. The service time obey the
negative exponential distribution with the parameter i, then probability which k passengers arrive in a time interval t is as follows:
,... 2 , 1 ! ) ( )
( k
k t e t
p t i
ik
i
(1) The density function of each service time is as follows:
0 t 0 0 t ) ( t i i e t A (2) So the average queue length Li and waiting time Ti at ith service counter is:
3 , 2 , 1 . ) ( ) ( 0 2 2
p i
L i i i i i i i (3) 3 , 2 , 1 /
L i
Ti i i
(4)
Sub-model: LCIOWF Network Theory
Modifications to the Current Process. In order to improve passenger throughput and reduce variance in waiting time, we can take the following optimizing measures to screening process:
(1) Changing the waiting line as “S” shape. S-type queue is used to increase the length of the queue to reduce the waiting time for passengers.
(2) Increasing the number of the bag claim. A terrace which a passenger can remove their belongings be added to the step of checking passenger identification documents .Other configurations remain unchanged.
(3) Increasing the conveyor front-end buffer length or the number of the X-ray scanner. On the basis of the second measure, an X-ray machine can be added before inspecting the paraphernalia and baggage or the buffer length at the front of the conveyor can be increased to give the passengers more sufficient time and space for preparation. So as to achieve the purpose of improving the passenger throughput and reducing the waiting time.
class of objects while reducing the waiting time for normal passengers, a way to add a buffering channel is taken.
The Establishment of the Model.
1) The definition of the process
According to the steps of security screening, we can construct the LCIOWF security process model. The model includes three aspects: process elements, structural relations and element attributes [6]. Process elements are divided into: Resource, Place, Change and Condition. Resource refers to the change involved the factors related to the security system in security service execution, such as the data or information from security systems. Place is LCIOWF model of the state element about the security service process. It stands for the place where resources are stored. Change refers to resource consumption and use after security screening process.Condition represents the condition whether the Place has Token.Structural relationship is the connections between Token and Change.
In the LCIOWF theory, feature attribute is the representation and description of the Place and Change.
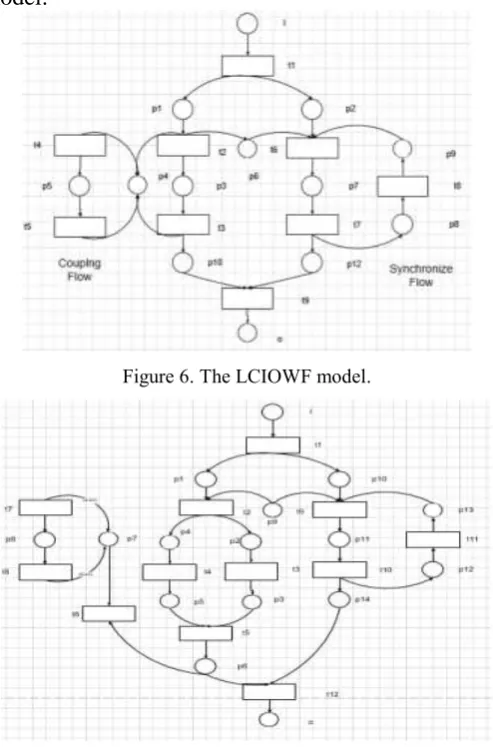
2) The initial establishment of the model
[image:4.595.174.421.336.710.2]The initial establishment of the model refers to the security service flow LCIOWF model, Figure 6 displays the LCIOWF model:
Figure 6. The LCIOWF model.
Figure 7. The LCIOWF model of second measure.
3) The initialization model of the test
4) Determine the attribute value
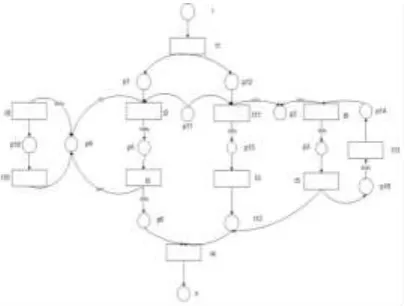
Determining attribute values is the definition and description of Change. Because the first optimizing measure is more intuitive from the simulation results, it is only for the model two and three. We Build the LCIOWF model of the second measure as the figure 7 shows:
Among this schematic diagram, t1 represents inspection the identification and boarding
documents. t7 represents out of problematic items. t9 represents the entrance to the security gate. t10 represents inspection from the millimeter wave scanner or metal detector.
[image:5.595.197.401.235.382.2] [image:5.595.197.403.407.560.2]The modeling process of the third measure is similar to the second measure, but the structure of the model diagram is different. Figure 8 is the LCIOWF model diagram of the third measure. And we could also establish a LCIOWF model diagram of the extra amble passenger lane as it is shown as Figure 9.
Figure 8. The LCIOWF model diagram of the third measure.
Figure 9. The LCIOWF model diagram of the extra amble passenger lane.
Result and Analysis
We can get 12 3 based on the assumptions of the checking process. There are 1 to 47
passengers during the time 0 to 9 '56'', we can get to rate of about 0.079 Pax/s, so the i 0.079.
Similarly, 1 is about 0.075 Pax/s, the service rate of millimeter wave scanners is about 0.081 Pax/s,
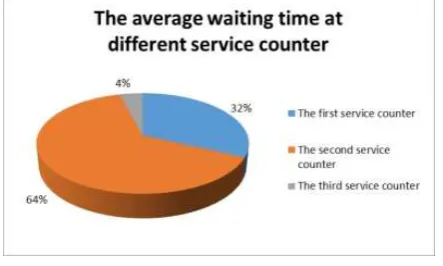
words, bottleneck is located at the Zone B where the passenger and their baggage get scanned separately.
[image:6.595.188.410.216.349.2]This is because passengers were asked to take off coat, shoes, belts and take out the metal items, electronic equipment and so on at the airport security checkpoint then they can get scanned by X-ray and millimeter wave, and each machine can only scan one people per time, therefore it is easy to cause the passenger to wait for a long time at the process, combines the actual conditions of the above-mentioned listed in the service rate and the actual rate here there will be a bottleneck phenomenon. Combined with the real life and model result, our model is obviously fitted with the fact. We can get the number of tokens based on this model and calculation, as Figure 11 shows.
[image:6.595.181.418.368.503.2]Figure 10. The average waiting time at different service counters.
Figure 11. The line chart of comparison of Tokens number.
Comparing the improved scheme with the unmodified scheme's Token number, we can see that:
Before improving, the number of Tokens in the Place which is larger. i0.25001, p10 0.28129,
37504 . 0
o . According to the improvement of the second measure, the numbers of Tokens in the
Place which are larger are, p60.25182, p14 0.26079. On the whole, under the improvement of
the second measure, the maximum value of the improved Token number is 30.46% less than the maximum value of the unsupervised. Meanwhile, in the improvement process, greatly optimizes the initial and final state of the process and reduces the need for queues in the initial state of the possibility of bottlenecks, to achieve the purpose of reducing passenger waiting time.
According to the improvement of the third measure, the numbers of Tokens in the Place which are
bigger are p4 0.26040, p70.26038, p14 0.27869. The efficiency of the security inspection is
improved to a greater extent. Additionally, the maximum value of the modified tokens number is reduced by 25.67% compared with the unimproved value.
Simulation
Similarly, we do the simulation of the second measure and the third measure, analyzing the simulation result and make a comparison of the throughput between the unmodified and improved by EXCEL. The simulation result shows as Figure 12 and the comparison result shows as Figure 13.
[image:7.595.175.418.322.505.2]Figure 12. The Simulation diagram under the unimproved measure.
Figure 13. The comparison of the throughput between the unmodified and improved.
From the comparison of the throughput, it can be seen that after the improvement of the scheme, the passenger throughput increases, and the maximum throughput can be obtained under the second measure.
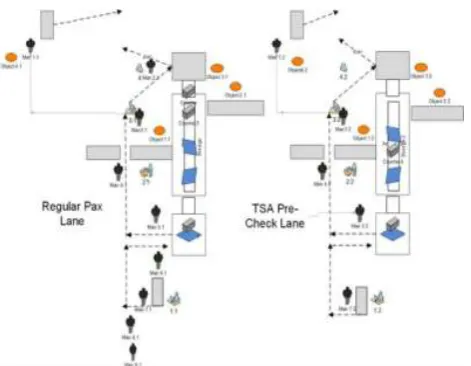
[image:7.595.104.492.578.755.2]If we consider the different styles of travelers, the simulation of improving shows as Figure 14.
As can be seen from the figure, the left part of the figure shows the flow chart of the airport security check when the escalator is not added, and the flow chart of the airport security check after the increase of the slow way.
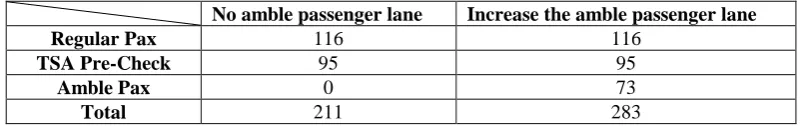
Table 1. Comparison of throughput.
No amble passenger lane Increase the amble passenger lane
Regular Pax 116 116
TSA Pre-Check 95 95
Amble Pax 0 73
Total 211 283
The simulation results are presented as Table 1. According to the simulation of the passenger throughput comparison, it is intuitive to see, increasing the amble pax lane can speed up the passenger throughput, but also can achieve the role of narrowing the difference.
Model Comparison
Tolkien number reflects the expected value of probability of a single service object in a certain state, the greater the average number of token is, the longer the passengers wait for. In order to realize the purpose of reducing waiting time, we should reduce the average number of token. We establish a model of the airport security checking process based on Petri net, Workflow net, and the LCIOWF theory, then made a comparison among the three models.
The Petri net is a model which could be a great way to describe the flow problem. The model built by the Petri net can represent all activities of the flow, and can analyze the static structure and the dynamic structure. Petri net mainly focuses on the impact of the system on the conditions changing. Workflow is a special kind of the Petri net model which is developed on the basis of Petri net. And the LCIOWF net model is extended on the basis of Workflow net.
[image:8.595.97.499.138.201.2]The Tolkien number of the security process based on the 3 models shows as Table 2:
Table 2. The result comparison of the 3 models.
Petri net Workflow net LCIOWF net
The number
of Token
0.24398 0.25000 0.25001
0.03843 0.03810 0.03745
0.24015 0.23549 0.23435
0.05743 0.05637 0.05621
0.29012 0.28125 0.28119
0.14475 0.14063 0.14057
0.37601 0.37500 0.37498
From the table above, we can see that there is a subtle difference of the token number among the three models. And we can reach the conclusion that the LCIOWF model we use is the best model because the token number is the lowest, in other words, the passenger’s throughput is the largest.
Summary
process to verify our model, we can find that adding an extra amble passengers’ lane can reduce the waiting time and increase the throughput. We compared the modified simulation result with the unmodified one then found that the throughput of the modified simulation is about 70 Pax more than the unmodified throughput. It is obvious that our schemes are available.
Acknowledgement
This research was financially supported by the National Science Foundation.
References
[1] Petri C A. Kommunkation mit automaten.Bonn: Institut fur Lnstrum Entelle Mat-hematik, Schtiften des IIM Nr.3, 1962. Also, English translation, Communication with Automata[J]. New York: Griffiss Air Force Base. Tech, Rep. Base. Tech, Rep. RADC-TR-65-377, 1966, 1(1): 1253-1262.
[2] Maged M, Dessouky, Quan Lu, Robert C, Leachman. Using Simulation Modeling to Assess Rail Track Infrastructure in Densely Trafficked Metropolitan Areas[A]. Proceedings of the 2002 Winter Simulation Conference[C]. New York. 2002:725-731.
[3] Bovy S P H P H L.State-Of-The-Art Of Vehicular Traffic Flow Modelling[J]. Delft University of Technology Delft, 2011,215(4):283-303.
[4] Khisty C J. Transportation engineering. New Jersey: Prentice-Hall Inc.1990:381.
[5] Edward Lin, Clark Cheng. Simulation and Analysis of railroad hump yards in North America[J]. Winter Simulation Conference. 2011.
[6] Schneider, Morton. Travel Time Minimization-Transit. C.A.T.S. Research News (Chicago Area Transportation Study), Volume 4, Number 2/June, 1961.
[7] Jiang Xin- Xin, Zhou Hang, Cai Bing-qing. Optimization Research on Process and Layout of Terminal Security Check[J]. Aeronautical Computing Technique, 2015,45(3):27-33.
[8] Mahmassani H S, Liu Y H. Dynamics of commuting decision behaviour under advanced traveller information systems[J]. Transportation Research Part C: Emerging Technologies, 1999,7(2): 91-107.
[9] Srinivasan S, Bhat C R Modeling household interactions in daily in-home and out-of-home maintenance activity participation. J. J. Transportation, 2005, 32(5): 523-544.
[10] Vine, JohnAn. Investigation into border security Checks[M]. Stationery Office, The Central Book Services,2012.
[11] Daniel de Oliveira Mota, Newton Narciso Pereira, Rui Carlos Botter, Afonso Celso Medina. Physical Objects on Navigation Channel Simulation Models. Proceedings of the 2013 Winter Simulation Conference. 2013:3475-3485.