R E S E A R C H A R T I C L E
Open Access
Cortical functional activity in patients with
generalized anxiety disorder
Yiming Wang
1*†, Fangxian Chai
1†, Hongming Zhang
2, Xingde Liu
3*, Pingxia Xie
1, Lei Zheng
1, Lixia Yang
1,
Lingjiang Li
4and Deyu Fang
5Abstract
Background:The neurological correlates of Generalised Anxiety Disorder (GAD) are not well known, however there is evidence of cortical dysregulation in patients with GAD. The aim of the study was to examine cortical functional activity in different cerebral regions in patients with GAD using electroencephalogram (EEG) nonlinear analysis to evaluate its contribution of anxiety severity.
Methods:The cohorts consisted of 64 patients diagnosed with GAD as classified by the Structured Clinical Interview for the Diagnostic and Statistical Manual of the American Psychiatric Association-IV-TR. Anxiety severity was assessed using the Hamilton Rating Scale for Anxiety (HAMA) severity score, with 7≤scores≤17 indicating mild anxiety as A group (n= 31) and 18 and above indicating moderate-severe anxiety as B group (n= 33). Participants with clinical levels of depression symptoms were excluded. A healthy control group comprising 30 participants was matched for age and gender. Closed eyes EEGs were conducted, and between-group differences on non-linear parameter Correlation Dimension (D2) were analyzed. The association of D2 value with HAMA scores was analyzed using multiple linear stepwise regression.
Results: Compared with the control group, D2 values were increased in anxiety groups (P< .05). For those with mild anxiety, this difference occurred in the left prefrontal regions (P< .05). For those with moderate-severe anxiety, significantly greater D2 values were observed in all of the cerebral regions, especially in the left cerebral regions and right temporal lobe (P< .01). When compared with those with mild anxiety, D2 values were significantly greater for those with moderate-severe anxiety in the right temporal lobe and all left cerebral regions except for left occipital lobe (P< .05). A positive correlation was observed between D2 values and moderate-severe anxiety HAMA scores.
Conclusions: The increased D2 values were found in the majority of cerebral regions in GAD patients, especially in the left cerebral regions and the right temporal lobe. The increased GAD severity positively correlates to the D2 values in a larger number of cerebral regions. This analysis method can potentially be used as a complementary tool to examine dysfunctional cortical activity in GAD.
Keywords: Psychiatry, Generalized anxiety disorder, EEG nonlinear analysis, Correlation dimension, Cortical functional activity
* Correspondence:[email protected];[email protected]
†Equal contributors
1
Department of Psychiatry, Affiliated Hospital of Guizhou Medical University, Guiyang, Guizhou 550004, China
3Department of Cardiolog, Affiliated Hospital of Guizhou Medical University,
Guiyang, Guizhou 550004, China
Full list of author information is available at the end of the article
Background
General anxiety disorder (GAD) is a common and chronic anxiety disorder characterized by persistent worry [1]. While advancements have been made in our understanding of the psycho-physiology of GAD in recent years, the neurological correlates of GAD remain poorly understood. Previous studies using functional magnetic resonance imaging (fMRI) have demonstrated that the anterior cingulate and the medial prefrontal regions were activated in GAD pa-tients [2], suggesting some cortical activity was dys-functional in GAD patients [3]. Other fMRI studies found that both the ventral prefrontal cortex (vPFC) and amygdala region are correlation with social anx-iety disorder [4]. What remains unclear however, is whether other cerebral regions are also differentially engaged in people with anxiety when compared to those without, and whether there is a relationship be-tween severity of anxiety disorder and cerebral region functional activity.
EEG is an important noninvasive method to explore cortical neuronal activity by placing electrodes on the scalp, including waveform investigations and power spectra analysis [5–8]. Molina et al [9] reported that patients with obsessive compulsive disorder (OCD) have increased beta and theta power in the EEG and perfusion in frontal regions. However, the complex dynamic changes in brain cannot be discriminated using the technique [10]. Furthermore, EEG with nonlinear features and complexity parameter, for ex-ample correlation dimension (D2), approximate entropy (ApEn), fractal dimension (FD), have been suggested as more suitable techniques for analyzing cerebral dynamic activity. The linear EEG is sufficient and well used for the clinical symptom classification of brain diseases as well as brain electronic signal alterations under different stress conditions, but the non-linear EEG analysis in fractal di-mension [11] provides a better analysis of quantification to identify EEG changes in response to special stimulating conditions such as the GAD. D2 is known as one of non-linear parameter for studying dynamic behaviors.
Another study using quantitative electroencephalog-raphy (qEEG) in patients with anxiety have shown de-creased alpha, beta and theta activity, especially in cerebral middle and central regions [12], and basal in-stability in cortical arousal has also been found [13]. Nonlinear EEG analysis is a new research tool that is being utilized in the study of different physiologic conditions, for example sleep and dementia [14, 15]. The D2 in the EEGs nonlinear analysis, is defined as an index of complexity of information processing representing the cerebral cortical dynamics and be-havior. D2 has been used in experimental and clinical settings in studying schizophrenia [16]. Decreased D2
values have been detected in patients with seizure epilepsy [17], Alzheimer’s disease [18], schizophrenia [19], and depression [20].
The aim of this study was to use EEG nonlinear dy-namics analysis to compare functional changes of the cerebral cortex in patients with or without GAD and to evaluate the impact of the severity of anxiety on cortical functional activity.
Methods Subjects
The study sample consisted of 64 patients with GAD (30 men and 34 women, aged 20–63 years) recruited from the department of psychiatry at the Affiliated Hospital of Guiyang Medical University, from June 2010 to January 2011. All consenting participants met diagnostic criteria for GAD according to the Struc-tured Clinical Interview for the Diagnostic and Statis-tical Manual of Mental Disorders-IV-TR. (DSM-IV) and scored ≥7 on the Hamilton Anxiety Rating Scale (HAMA) [21]. Participants with clinical levels of depression symptoms (defined by a score of≥53 on the Zung Self-Rating Depression Scale (SDS) [22]) were excluded. Participants were categorised
accord-ing to their HAMA scores as havaccord-ing either “mild
anxiety” (7≤scores≤17) or “moderate-severe anxiety” (HAMA≥18) for evaluating the impact of the severity of anxiety on cortical functional activity. Healthy con-trol participants (n= 30) who did not meet the diag-nostic criteria for GAD according to the Structured Clinical Interview for the Diagnostic and Statistical Manual of Mental Disorders-IV-TR (DSM-IV) and scored≤6 on the Hamilton Anxiety Rating Scale (HAMA) were recruited. Diagnostic interviews were conducted by two psychiatrists. Exclusion criteria for all participants in-cluded secondary somatic diseases (hyperthyroidism, hypertension and coronary heart disease).
Selective serotonin-reuptake inhibitors (SSRIs) were routinely used to treat patients with anxiety, concomi-tant short term use of benzodiazepines was allowed (alprazolam (Xanax), 0.8 mg/day, bid for 2 weeks Yabao pharmaceutical Taiyuan Pharmaceutical Co., Ltd.).
Assessment
The severity of anxiety
Severity of anxiety symptoms was assessed using the HAMA. This is a 14 item clinician rated scale, with each item rated 0-4 where a higher score indicates more se-vere symptoms [23], with a total anxiety score range from 0 to 56, score≤17 indicates mild severity, where≥
18 shows mild to moderate, and 25–30 indicates
EEG nonlinear analysis
EEG was conducted in a quiet room with soft lighting. EEG electrodes were placed in accordance with inter-national standards for leads 10–20, specifically left and right forehead (FP1, FP2); left and right frontal (F3, F4); left and right central (C3, C4); left and right parietal (P3, P4); left and right occipital (O1, O2); left and right anterior temporal (F7, F8); left and right temporal (T3, T4); left and right posterior temporal (T5, T6). The left and right earlobe (A1, A2) were used as reference sites. The data was acquired and analyzed using 16-channel EEG (Wireless Digital EEG, ZN16E, Chengdu, China), the EEG with international 10–20 system was used to obtain EEGs in the subjects [24].
In resting state, EEG signals were recorded from each participant, who was asked to close eyes and keep on a relax condition without movement during the 5 min data collection period. EEG data in each interval (180 s) were selected from the 5 min collection period and divided into 6 segments with 30s each for nonlinear pro-cessing. Any artifact sources caused by eye-blink and movement in EEG recording were eliminated by the component analysis system based on their different fre-quencies and patterns as this analysis system is able to recognize the unique patterns of electronic signaling caused by the eye blink.
The D2 value was calculated using a nonlinear software packet embedded in the 16-channel Wireless Digital EEG system. D2 is an index of the variation within a selected time series, reflecting the complexity of a non-linear system. Nonlinear EEG analyzes the brain activity using nonlinear dynamic mathematics and chaos theory, which allows us to monitor the dynamics and complicated electronic activity [25]. Natural and bio-logical phenomena often displays features of nonlinear dynamics, particularly respond to perturbing stimuli or initial conditions [26].
The D2 values are shown as the average of data col-lected from all the brain regions of each patients as indi-cated in Table 2. The differences among controls and patients with anxiety of mild symptoms, or
moderate-severe symptoms were statistically evaluated based on the method of Lacasa [27].
Statistics analyses
Data analysis was carried out using SPSS 19.0 soft-ware. The results were described using Median ± Quartile (M ± Q). The Rank Sum Test was carried out among the three groups (control, mild anxiety, moderate-severe anxiety). P< 0.05 was considered as statistical significant. The final regression model was
Ŷ= 2.7985-0.417X1 + 0.533 X2 (Ŷ: estimates the value of the correlation dimension D2, X1: the patient’s age, X2: HAMA score of patients). The association be-tween D2 and HAMA scores was analyzed bebe-tween moderate-severe anxiety (B group) and control groups using multiple linear stepwise regression, significance was set at α= .05.
Results
Demographic characteristics
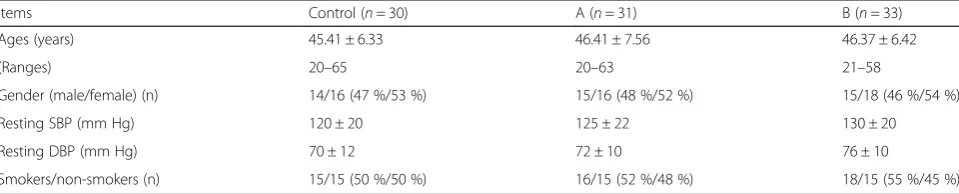
The key characteristics of the patient cohorts are dis-played in Table 1. No significant differences were found between the control, GAD A and B groups in the demographic variables (age, sex) between the con-trol and GAD A and B groups. Their smoking status and blood pressure ratings of patients and control groups were indicated, the percentages of smoking populations and average blood pressure in each group are comparable (Table 1).
The comparison of Correlation Dimension between the groups
[image:3.595.58.538.609.706.2]Compared with the control group, D2 values were in-creased in anxiety groups (P< .05). For those with mild anxiety, this difference occurred only in the left pre-frontal regions (P< .05). For those with moderate-severe anxiety, significantly greater D2 values were observed in all of the cerebral regions, especially in the left cerebral regions and right temporal lobe (P< .01). When com-pared with those with mild anxiety, D2 values were sig-nificantly greater for those with moderate-severe anxiety
Table 1Demographic data between the control and GAD groups (Mean ± SEM)
Items Control (n= 30) A (n= 31) B (n= 33)
Ages (years) 45.41 ± 6.33 46.41 ± 7.56 46.37 ± 6.42
(Ranges) 20–65 20–63 21–58
Gender (male/female) (n) 14/16 (47 %/53 %) 15/16 (48 %/52 %) 15/18 (46 %/54 %)
Resting SBP (mm Hg) 120 ± 20 125 ± 22 130 ± 20
Resting DBP (mm Hg) 70 ± 12 72 ± 10 76 ± 10
Smokers/non-smokers (n) 15/15 (50 %/50 %) 16/15 (52 %/48 %) 18/15 (55 %/45 %)
in the right temporal lobe and all left cerebral regions except for left occipital lobe (P< .05) (Tables 2 and 3).
Association between D2 value and HAMA scores
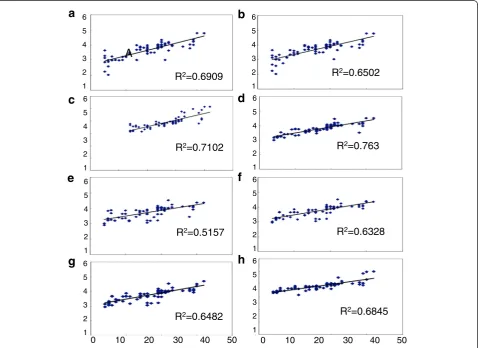
Multiple linear stepwise regression analysis revealed that, for the GAD B group, D2 values and HAMA scores were positively correlated (r> .63, P< .05) in the left prefrontal, frontal, central, parietal occipital, anterior temporal, temporal, posterior temporal regions (Fig. 1).
Discussion
This study found that individuals with GAD have dysfunctional cortical activity in the majority of cerebral regions, especially in the left cerebral regions and right temporal lobe. Moreover, more severe anxiety was asso-ciated with involvement of a larger number of cerebral regions. Specifically, we demonstrated increased values of D2 in frontal temporal regions in GAD patients, sug-gestive of temporal lobe cortical dysfunction. These as-sociation is unlikely affected by their smoking status and blood pressure because the percentages of smoking pop-ulations and average blood pressure in each group are comparable. Glosser et al. found that patients with anterior temporal lobectomy often develop mood disor-ders and the severity of psychiatric symptoms peak in the 6 months after surgery [28]. It is possible that dys-function of the frontal and temporal regions can result in emotional changes [29], and the results of an fMRI study on patients with GAD also revealed dysfunction in the bilateral superior temporal gyrus and dorsal pre-frontal cortex [30]. However, given the cross-sectional nature of these data and the multiple comparisons used, identifying the true direction of this relationship requires further investigation.
In the current report, we found increased D2 values in patients with greater GAD severity, lateralized to the left hemisphere (the dominant hemisphere as all participants were right-handed). To our knowledge, this is the first study to demonstrate significant differences in cerebral hemisphere in left and right laterality, however the machanism is not clear. Kalisch et al. [31] used the mag-netic resonance imaging at 7 T to measure hippocampal volumes in a rat model of extremes in trait anxiety (ex-periment 1) and in a Wistar population with normal
anxiety-related behavior (experiment 2). While experi-ment 2 yielded a strong evidence for a negative relation-ship which was specific for trait anxiety, results from experiment 1 globally supported the hypothesis of a positive relationship between hippocampus volume and trait anxiety. Therefore, as what the authors stated, the relationship between hippocampal volume and anxiety may be more complex than expected, thus we speculate that this increase in D2 value is associated to the cortical dysfunctional activity in these patients.
We agree with the reviewer that the temporal and hip-pocampal regions are not the same. It has been reported [32] that the volume in the whole-brain gray matter, not only in the hippocampal region, but also including su-perior temporal gyrus and midbrain, is reduced in pa-tients with GAD. It has also been shown [33] that the reduced white matter (WM) volume were associated with dysfunctional cognitive and emotional in GAD, WM volume is correlation with symptom severity. Im-plying that dysfunctional activities can occur both in cerebral cortex and hippocampal regions correlation with clinical characteristics. However, it would be tech-nically challenging to detect the hippocampal dysfunc-tional activation by EEG in human. Although the use of Nonlinear EEG to analyze generalized anxiety disorder has not been reported, this analysis method is suggested in further research the ralationship between cerebral cortex volume and generalized anxiety disorder, and as a complementary tool to detect dysfunctional cortical ac-tivity in GAD.
[image:4.595.57.540.636.715.2]A strength of this study was the use of neuroimaging to investigate cortical dysfunctional activity. The nonlin-ear analysis method was sufficiently sensitive to detect differences in cortical activity between patients with dif-ferent levels of anxiety, a finding that may have implica-tions for the clinical diagnosis of GAD. Currently, a diagnosis of GAD relies on clinical judgment, using information gathered via symptom assessment and re-sponses to standardized scales. However, a disadvantage of clinical judgment is subjectivity; diagnosis will be influenced by clinical training, experience and other sub-jective factors and may differ amongst clinicians. This technique, however, remains the gold standard for psy-chiatric diagnostic assessment.
Table 2The comparison of Correlation Dimension in different groups (M ± Q)
Group n Left prefrontal (FP1-A1)
Right forehead (FP2-A2)
Left frontal (F3-A1)
Right frontal (F4-A2)
Left central (C3-A1)
Right central (C4-A2)
Left parietal (P3-A1)
Right parietal (P4-A2)
Control 30 3.57 ± 0.48 3.53 ± 0.58 3.64 ± 0.36 3.61 ± 0.43 3.66 ± 0.44 3.66 ± 0.51 3.65 ± 0.34 3.59 ± 0.49
A 31 3.36 ± 0.24* 3.41 ± 0.46 3.52 ± 0.35 3.58 ± 0.37 3.55 ± 0.36 3.66 ± 0.33 3.59 ± 0.39 3.58 ± 0.37
B 33 3.66 ± 0.69▲▲ 3.52 ± 0.59▲ 3.95 ± 0.33**▲▲ 3.81 ± 0.35▲▲ 3.94 ± 0.33**▲▲ 3.85 ± 0.27▲▲ 3.97 ± 0.27**▲▲ 3.80 ± 0.41▲▲
P 0.000 0.016 0.000 0.004 0.000 0.003 0.000 0.006
Compared with control group,*P < .05,**P
Neuroimaging techniques may impact upon the nosology of mental disorders in the future and have the capacity to influence psychiatric practice by potentially improving clinical treatment [34]. Indeed, these have been valuable in other areas of psychiatry, for example, in depressed populations, via fMRI [35], positron emis-sion tomography (PET) [36] and single-photon emisemis-sion computed tomography (SPECT) [37, 38]. These differing neuroimaging methodologies, fMRI, PET, SPECT and EEGs nonlinear analysis offer complimentary insights into neurobiology, and each have their strengths and
[image:5.595.59.539.100.177.2]weaknesses. fMRI and PET techniques can not directly detect neuronal activity, neither can EEG. Linear analysis methods have limits in stability and sensitivity in detect-ing complicated cortex function as EEG signals originate in a highly nonlinear system [39, 40]. Further, nonlinear dynamics analysis can provide information about the neural network [41] and track the changes cerebral functional activity [42, 43] which cannot be detected with linear analysis. This technique has also shown to be more sensitive than linear analysis in detecting subtle aspects of emotional processing. Indeed, EEG Table 3The comparison of Correlation Dimension in different groups (M ± Q)
Group n Left occipital (O1-A1)
Right occipital (O2-A2)
Left anterior temporal (F7-A1)
Right anterior temporal (F8-A2)
Left temporal (T3-A1)
Right temporal (T4-A2)
Left posterior temporal (T5-A1)
Right posterior temporal (T6-A2)
Control 30 3.62 ± 0.59 3.69 ± 0.57 3.63 ± 0.54 3.71 ± 0.56 3.91 ± 0.69 3.86 ± 0.50 3.78 ± 0.36 3.60 ± 0.59
A 31 3.45 ± 0.61 3.42 ± 0.47* 3.43 ± 0.58 3.70 ± 0.46 3.66 ± 0.72 3.65 ± 0.71 3.61 ± 0.54 3.55 ± 0.54
B 33 3.99 ± 0.23**▲▲ 3.81 ± 0.51▲▲ 4.05 ± 0.82**▲▲ 3.89 ± 0.36▲▲ 4.29 ± 0.49**▲▲ 4.01 ± 0.51▲▲ 4.14 ± 0.51**▲▲ 3.81 ± 0.32▲▲
P 0.000 0.000 0.000 0.004 0.000 0.005 0.000 0.006
Compared with control group, *P< .05, **P< .01;compared with group A,▲P< .05,▲▲P< .01 Group A: mild symptoms of anxiety; Group B: moderate to severe symptoms of anxiety
a
g
c
e
A
b
h
d
f
6
5
4
3
2
1
6
5
4
3
2
1
6
5
4
3
2
1
6
5
4
3
2
1
6
5
4
3
2
1 6
5
4
3
2
1
6
5
4
3
2
1
6
5
4
3
2
1
0 10 20 30 40 50 0 10 20 30 40 50
R2=0.6909 R2=0.6502
R2=0.7102 R2=0.763
R2=0.5157 R2=0.6328
R2=0.6482 R2=0.6845
[image:5.595.60.539.358.706.2]nonlinear analysis has been widely used in other popula-tions (epilepsy [44, 45], schizophrenia [46], dementia [47]), to monitor the depth of anesthesia [48–50], and is effect-ive in evaluating patients being treated for acute car-bon monoxide poisoning [51]. As the electrical activity of the human brain self-organizing nonlinear dynamic systems is complex, and the neural circuits are extensive and full of synaptic connections [52]. The non-linear method in the current study has a great potential in delineating the complexity of EEG in patients with different psychological disorders.
However, we acknowledge that there are certain limitations when interpreting these data. The sample size was not extensive, limiting ability to further ana-lysis the relationship between anxiety disorder severity and EEG non-linear parameters. However, given the cross-sectional nature of these data and the multiple comparisons used, identifying the true direction of this relationship requires further investigation.”
Conclusions
Patients with GAD demonstrate dysfunctional cortical activity in the majority of cerebral regions, the in-creased D2 values were found in the majority of cere-bral regions in GAD patients, especially in all the left cerebral regions and right temporal lobe, GAD severity positively correlate with increased D2 values in a larger number of cerebral regions. Our study demonstrates that EEG dynamic non-linear analysis is appropriate for the investigation of the neurological correlates of GAD, and holds potential for the further evaluation of cortical dysfunctional activity in patients with varying levels of GAD severity and assessment of treatment effects, this analysis method is also suggested as a complementary tool to detect dysfunctional cortical activity in GAD.
Abbreviations
D2, Correlation Dimension; DBP, diastolic bood pressure; DSM-IV, Diagnostic and Statistical Manual of Mental Disorders-IV-TR; EEG, electroencephalogram; fMRI: functional magnetic resonance imaging; GAD, Generalised Anxiety Disorder; HAMA, Hamilton Rating Scale for Anxiety; PET, positron emission tomography; SBP, systolic blood pressure; SDS, Zung Self-Rating Depression Scale; SPECT, single-photon emission computed tomography; vPFC, ventral prefrontal cortex
Acknowledgements
This study was supported by National Natural Science Foundation of China, Project Grant: [2015] 81560235, National Clinical Research Center for Mental Health Disorders (2015BAI13B02). Clinical key subjects in Guizhou Province (2014). All authors had a role in either the design of study, in the collection of material, analysis and interpretation of data, in the writing of the paper; and in the decision to submit the paper for publication.
Availability of data and materials
The datasets supporting the conclusions of this article are included within the article.
Authors’contributions
YW and XL participated in the design of the study and performed the statistical analysis, FC, PX, LZ, LY carried out the studies tests, DF, LL and HZ participated in coordination and drafting of the manuscript. All authors participated in data interpretation, drafting of the manuscript and have read and approved the final manuscript.
Competing interests
The authors declare that they have no competing interests.
Consent for publication
Not applicable.
Ethics approval and consent to participate
The study involved in the paticipatation of patients and healthy volenteers was approved by the Affiliated Hospital Ethics Committee of Guizhou Medical University (NO 10/2010).
All participants gave their written informed consent to participate. The procedures followed were in accordance with the revised Declaration of Helsinki of 1964 [53].
Author details
1Department of Psychiatry, Affiliated Hospital of Guizhou Medical University,
Guiyang, Guizhou 550004, China.2Department of Cardiolog, The General Hospital of Jinan Military Region, Jinan 250031, China.3Department of Cardiolog, Affiliated Hospital of Guizhou Medical University, Guiyang, Guizhou 550004, China.4The second Xiangya Hospital, Central South University, 139# Renmin road, Changsha, Hunan 410011, China.5Department of Pathology, Northwestern University Feinberg School of Medicine, Chicago 60611, USA.
Received: 15 February 2016 Accepted: 8 June 2016
References
1. Wu WY, Wang G, Susan GB, Durisala D, ANG QQ. Duloxetine versus placebo in the treatment of patients with generalized anxiety disorder in China. Chin Med J. 2011;124:3260–8.
2. Paulesu E, Sambugaro E, Torti T, Danelli L, Ferri F, Scialfa G, Sberna M, Ruggiero GM, Bottini G, Sassaroli S. Neural correlates of worry in generalized anxiety disorder and in normal controls: a functional MRI study. Psychol Med. 2010;40:117–24.
3. Jetty PV, Charney DS, Goddard AW. Neurobiology of generalized anxiety disorder. Psychiatr Clin North A. 2001;24:75–97.
4. Guyer AE, Nelson EE. Amygdala and ventrolateral prefrontal cortex function during anticipated peer evaluation in pediatric social anxiety. Arch Gen Psychiatry. 2008;65:1303–12.
5. Reid SA, Duke LM, Allen JJ. Resting frontal electroencephalographic asymmetry in depression: inconsistencies suggest the need to identify mediating factors. Psychophysiology. 1998;35:389–404.
6. Allen JJ, Urry HL, Hitt SK, Coan JA. The stability of resting frontal elec-troencephalo graphic asymmetry in depression. Psychophysiology. 2004; 41:269–80.
7. Sumich A, Harris A, Flynn G, Whitford T, Tunstall N, Kumari V, Brammer M, Gordon E, Williams LM. Event-related potential correlates of depression, insight and negative symptoms in males with recent-onset psychosis. Clin Neurophysiol. 2006;117:1715–27.
8. Bares M, Brunovsky M, Kopecek M, Stopkova P, Novak T, Kozeny J, Höschl C. Changes in QEEG prefrontal cordance as a predictor of response to anti-depressants in patients with treatment resistant depressive disorder: a pilot study. J Psychiatr Res. 2007;41:319–25.
9. Molina V, Montz R, Pérez-Castejón MJ, Martin-Loeches M, Carreras JL, Calcedo A, Rubia FJ. Cerebral perfusion, electrical activity and effects of serotonergic treatment in obsessive-compulsive disorder. A preliminary study. Neuropsychobiology. 1995;32:139–48.
12. Demerdzieva A. Eeg Characteristics of Generalized Anxiety Disorder in Childhood. Acta Informatica Medica. 2011;19:9–15.
13. Clark CR, Galletly CA, Ash DJ, Moores KA, Penrose RA, McFarlane AC. Evidence-based medicine evaluation of electrophysiological studies of the anxiety disorders. Clin EEG and neurosci. 2009;40:84–112. 14. Pradhan N, Dutt DN. A nonlinear perspective in understanding the
neurodynamics of EEG. Comput Biol Med. 1993;23:425–42.
15. Babloyantz A, Salazar JM, Nicolis C. Evidence of chaotic dynamics of brain activity during the sleep cycle. Phys Lett A. 1985;111:152–6.
16. Carlino E, Sigaudo M, Pollo A, Benedetti F, Mongini T, Castagna F, Vighetti S, Rocca P. Nonlinear analysis of electroencephalogram at rest and during cognitive tasks in patients with schizophrenia. J Psychiatry Neurosc. 2012;37: 259–66.
17. Lehnertz K, Elger C. Can epileptic seizures be predicted? Evidence from non-linear time series analysis of brain electrical activity. Phys Rev Lett. 1998; 80:5019–22.
18. Jeong J, Chae JH, Kim SY, Han SH. Non-linear dynamical analysis of the EEG in patients with Alzheimer’s disease and vascular dementia. J Clin Neurophysiol. 2001;112:827–35.
19. Kirsch P, Besthorn C, Klein S, Rindfleisch J, Olbrich R. The dimensional complexity of the EEG during cognitive tasks reflects the impaired information processing in schizophrenic patients. Int J Psychophysiol. 2000;36:237–46.
20. Hosseinfard B, Moradi MH, Rostami R. Classifying depression patients and normal subjects using machine learning techniques and nonlinear features from EEG signal. Comput Methods Programs Biomed. 2013;109:339–45. 21. Hamilton M. The assessment of anxiety states by rating. Br J Med Psychol.
1959;32:50–5.
22. Zung, William WK, Richards CB, Short MJ. Self-rating depression scale in an outpatient clinic: further validation of the SDS. Arch Gen Psy. 1965;13:508–15. 23. Maier W, Buller R, Philipp M, Heuser I. The Hamilton Anxiety Scale: reliability,
validity and sensitivity to change in anxiety and depressive disorders. J Affect Disord. 1988;14:61–8.
24. Wang J, Wu D, Chen Y, Yuan Y, Zhang M. Effects of transcranial direct current stimulation on language improvement and cortical activation in nonfluent variant primary progressive aphasia. Neurosci Lett. 2013;549:29–33. 25. Skinner JE, Carpeggiani C, Landisman CE, Fulton KW. Correlation dimension
of heartbeat intervals is reduced in conscious pigs by myocardial ischemia. Circ Res. 1991;68:966–76.
26. Strogatz SH. Nonlinear Dynamics and Chaos: With Applications to Physics, Biology, Chemistry and Engineering(Studies in nonlinearity) (Paperback). 1994. p. 1.
27. Lacasa L, Gómez-Gardeñes J. Analytical estimation of the correlation dimension of integer lattices. Chaos. 2014;24:043101.
28. Glosser G, Zwil AS, Glosser DS, O’Connor MJ, Sperling MR. Psychiatric aspects of temporal lobe epilepsy before and after anterior temporal lobectom. J Neurol Neurosur Ps. 2000;68:53–8.
29. Donald TS, Gow CA, Ross HC.“No longer gage”: Frontal lobe dysfunction and emotional changes. J Consul Clin Psychol. 1992;60:349–59.
30. Zhao XH, Wang PJ, Li CB, Wang JH, Yang ZY, Hu ZH, Wu WY. Prefrontal and superior temporal lobe hyperactivity as a biological substrate of generalized anxiety disorders. Nat Med J Chin. 2006;86:955–60.
31. Kalisch R, Schubert M, Jacob W, Kessler MS, Hemauer R, Wigger A, Landgraf R, Auer DP. Anxiety and hippocampus volume in the rat. Neuropsychopharmacology. 2006;31:925–32.
32. Moon CM, Kim GW, Jeong GW. Whole-brain gray matter volume abnormalities in patients with generalized anxiety disorder: voxel-based morphometry. Neuroreport. 2014;25:184–9.
33. Moon CM, Jeong GW. Alterations in white matter volume and its correlation with clinical characteristics in patients with generalizedanxiety disorder. Neuroradiology. 2015;57:1127–34.
34. Malhi GS, Lagopoulos J. Making sense of neuroimaging in psychiatry. Acta Psychiatr Scand. 2007;1:1–18.
35. Guo WB, Liu F, Xue ZM, Yu Y, Ma CQ, Tan CL, Sun XL, Chen JD, Liu ZN, Xiao CQ, Chen HF, Zhao JP. Abnormal neural activities in first-episode, treatment-naïve, short-illness-duration, and treatment-response patients with major depressive disorder: A resting-state fMRI study. J Affect Disord. 2011;135:326–31.
36. Post RM, DeLisi LE, Holcomb HH, Uhde TW, Cohen R, Buchsbaum MS. Glucose utilization in the temporal cortex of affectively ill patients: positron emission tomography. Biol Psychiat. 1987;22:545–53.
37. Davies J, Lloyd KR, Jones IK, Barnes A, Pilowsky LS. Changes in regional cerebral blood flow With Venlafaxine in the Treatment of Major Depression. Am J Psychiat. 2003;160:374–6.
38. Milo TJ, Kaufman GE, Barnes WE, Konopka LM, Crayton JW, Ringelstein JG, Shirazi PH. Changes in RCBF After Electroconvulsive Therapy for Depression. J ECT. 2001;17:15–21.
39. Pritchard WS, Duke DW. Measuring“Chaos”in the Brain, A tutorial review of EEG dimension estimation. Brain Cognition. 1995;27:353–97.
40. Lopes-da-Silva F. Neural mechanism underlying brain wave:from neural branches to networks. Electro Clin Neurophysiol. 1991;79:81–93. 41. Jelles B, van Birgelen JH, Slaets JP, Hekster RE, Jonkman EJ, Stam CJ.
Decrease of nonlinear structure in the EEG of Alzheimer patients compeared to healthy controls. Clin Neurophysiol. 1999;110:1159–67. 42. Wu DY, Dong WW. Nonlinear dynamic analysis in the EEG. Clin nerve
Electrophysiol (Chin). 2003;12:335–8.
43. Chen XL, Yao BL, Wei DN. EEG nonlinear analysis in mental arithmetic and directed. Chin J of Rehabilita Theory and Prac (Chin). 2005;11:978–80. 44. Savit R, Li D, Zhou And W, Drury I. Understanding dynamic state changes in
temporal lobe epilepsy. J Clin Neurophysiol. 2001;18:246–9.
45. Van L, Quyen M, Martinerie J, Navarro V, Baulac M, Varela FJ. Characterizing neurodynamic changes before seizures. J Clin Neurophysiol. 2001;18:191–208. 46. Chen XS, Wang HX, Zhang MD. Schizophrenia EEG. Nonlinear Dynamics. J
Shanghai Jiaotong Uni (Medical Sciences) (Chin). 2006;26:169–71. 47. Wan BK, Chen J, Ji HZ. Alzheimer’s EEG complexity and approximate
entropy analysis. Beijing Biomed Eng (Chin). 2005;24:103–107,130. 48. Schneider G, Sebel PS. Monitoring depth of anaesthesia. Eur J Anaesth.
1997;14:21–8.
49. Widman G, Schreiber T, Rehberg B, Hoeft A, Elger CE. Quantification of depth of anesthesia by nonlinear time series analysis of brain electrical activity. Phys Rev E. 2000;62:4898–903.
50. Wu DY, Jia BS, Yin L. Nonlinear EEG analysis in depth of anesthes ia monitoring. People’s Liberat Army Med (Chin). 2005;30:40–2.
51. Wang YX, Wang XM, Liu H, Chen F. EEG nonlinear analysis in the efficacy evaluation of patients with acute carbon monoxide poisoning. J of Neurol (Chin). 2012;11:177–81.
52. Stam CJ, van-Woerkom TC, Pritchard WS. Use of non-linear EEG measures to characterize EEG changes during mental activity. Electroencephalogr Clin Neurophysiol. 1996;99:214–24.
53. Guyer AE, Lau JY, McClure-Tone EB, Parrish J, Shiffrin ND, Reynolds RC, Chen G, Blair RJ, Leibenluft E, Fox NA, Ernst M, Pine DS, Nelson EE. Human Experimentation: code of ethics of the World Medical Association. Br Med J. 1964;2:177.
• We accept pre-submission inquiries
• Our selector tool helps you to find the most relevant journal
• We provide round the clock customer support
• Convenient online submission
• Thorough peer review
• Inclusion in PubMed and all major indexing services
• Maximum visibility for your research
Submit your manuscript at www.biomedcentral.com/submit