University of Huddersfield Repository
Robson, Colin and Evans, Peter
Educating children with disabilities in developing countries: the role of data sets
Original Citation
Robson, Colin and Evans, Peter (2003) Educating children with disabilities in developing countries: the role of data sets. OECD, Huddersfield, UK.
This version is available at http://eprints.hud.ac.uk/id/eprint/475/
The University Repository is a digital collection of the research output of the University, available on Open Access. Copyright and Moral Rights for the items on this site are retained by the individual author and/or other copyright owners. Users may access full items free of charge; copies of full text items generally can be reproduced, displayed or performed and given to third parties in any format or medium for personal research or study, educational or notforprofit purposes without prior permission or charge, provided:
• The authors, title and full bibliographic details is credited in any copy; • A hyperlink and/or URL is included for the original metadata page; and
• The content is not changed in any way.
For more information, including our policy and submission procedure, please contact the Repository Team at: [email protected].
EDUCATING CHILDREN WITH DISABILITIES
IN DEVELOPING COUNTRIES:
THE ROLE OF DATA SETS
Table of Contents
Acknowledgements... 1
Introduction ... 1
Defining Disability... 2
Types of Disability Data Sets... 5
National Censuses... 5
Household Surveys... 7
Service Registries... 9
Other Approaches... 10
Examples of Disability Data Systems and of the Results They Produce... 10
Asking Different Questions Produces Different Answers... 12
Qualitative Studies on the Lives of Children in Developing Countries... 13
Data Sets and Classificatory Frameworks Produced by or Associated with International Organizations... 14
The World Bank... 14
The United Nations Statistics Division... 17
Questions Used to Identify Persons with Disabilities... 20
The World Health Organization (WHO)... 22
The United Nations Educational, Scientific, and Cultural Organization (UNESCO)... 23
The Organization for Economic Cooperation and Development (OECD)... 25
The European Union... 27
The United Nations Children’s Fund (UNICEF)... 28
Other Data Sets and Data Sources... 30
Demographic and Health Surveys (DHS)... 30
Statistical Information and Monitoring Program on Child Labor (SIMPOC)... 30
Development Banks... 30
Other Organizations... 31
Children with Disabilities and the Education for All (EFA) and Millennium Development Goals (MDG) Global Initiatives... 31
Education for All (EFA)... 31
Millennium Development Goals (MDG)... 33
Information From World Bank Regions... 34
Conclusions and Recommendations... 35
A Warning Note... 38
References ... 40
2 Disability Prevalence Estimates Based on Impairment Definitions...12
3 Limitation Prevalence by Nation...13
4 Example of Results of Search of DISTAT...17
5 Examples of ICF Components and Domains...23
6 Classification Within Components in the ICF...23
7 Examples of Allocation of National Categories to the Three Cross-national Categories...26
8 Percentage of Children 24 to 108 Months with Disability Problems...29
Boxes 1 Advantages and Disadvantages of Using a Census to Collect Data on Disability...6
2 Advantages and Disadvantages of Questionnaire Based Surveys...8
3 Examples of Disabled Children’s School Enrollment Rates...16
4 Contents of “Guidelines and Principles for the Development of Disability Statistics”...18
5 UN Recommended List of Questions on Disability...21
6 Different “Screener” Questions Used by Those Countries Using the UN Recommended List...22
7 The ISCED Levels of Educational Programs...24
8 Proposed Indicators for Children with Disabilities...28
Appendix 1 ... 47
Educating Children with Disabilities in Developing Countries:
The Role of Data Sets
Colin Robson, The University of Huddersfield with Peter Evans, The OECD Secretariat
Acknowledgements
Grateful thanks to Jan Georgeson for carrying out the library and Internet research on which this study is based.
Introduction
It appears highly likely that children with disabilities comprise one of the most socially excluded groups in all societies today. It has been estimated that 85 percent of the world’s disabled children under 15 years of age live in developing countries (Helander, 1993). The brief provided by the World Bank for this study asserts that in developing countries, the “…vast majority of these children receive no education, are absent in school data sets, and invisible on the national policy agenda.” In this situation the bringing about of change in nations’
commitments to children with disabilities is critically dependent on the availability of data. This is the only route to the establishment of sound policies, strategic plans, and effective services and supports. Hence there is an urgent need to improve the quality and availability of international data related to the education of children with disabilities, in terms of coverage, reliability, and validity. Educational reform is crucially dependent on such data.
Given such initiatives and commitments on the part of developing countries there should be a corresponding commitment on the part of the World Bank and other funding bodies to providing the resources needed to realize such reforms.
In the absence of relevant data it will not be possible to ensure that children with
Defining Disability
A widely used term such as disability is likely to mean different things to different people. The international dimension of this study introduces the additional complexity of different languages. The translation of a term such as disability into other languages necessarily puts it into different linguistic and cultural contexts. Definitions do of course exist. A typical dictionary definition focuses on “want of power” linked with notions of weakness, incapacity, and disqualification. It is easy to stray from the purely descriptive to a pejorative usage, the avoidance of which, in part, explains the coining of alternative terms such as “differently abled.”
The United Nations, in providing recommendations for the conduct of national censuses defines a person with disability as:
A person who is limited in the kind or amount of activities that he or she can do because of ongoing difficulties due to a long-term physical condition, mental condition or health problem (United Nations, 1998).
The World Bank Disability Group’s Web site http://wbln0018.worldbank.org provides a section on Defining Disability:
Defining what is meant by disability is sometimes a complex process, as disability is more than a description of a specific health issue; rather it is affected by
people’s cultures, social institutions, and physical environments. The current international guide is the World Health Organization’s discussion and
classification within ICF: International Classification of Functioning, Disability and Health. ICF presents a framework which encompasses the complex
multifaceted interaction between health conditions and personal and environmental factors that determine the extent of disablement in any given situation.
This does not in itself provide a definition, though it does provide a reference to the ICF
framework discussed below. It provides, too, an important reminder that disability is not simply a health issue. In particular, there is a complex interaction between social institutions and health conditions that determine the extent to which a person is actually disabled, or not able to do something.
ICF essentially follows a top-down model. A group of experts, assisted by representative disability organizations, have produced a highly complex classificatory scheme with components of Body Functions and Structures, Activities and Participation, and Environmental Factors, each of which is comprised of various domains. This is used to provide a coding. Thus, as an example:
The code recorded for a person experiencing moderate difficulty changing body position is d410.28, where:
– d denotes the component, in this case Activities and Participation. – the first digit (4) denotes the chapter or domain, i.e., Mobility.
– the 2nd and 3rd digits (10) denote the 2nd level category, i.e., Changing basic body position.
– the first digit after the decimal point (2) denotes the uniform qualifier, indicating there is moderate difficulty with performance.
– the second digit after the decimal point (8) indicates that capacity is not specified.
Notwithstanding its complexity if ICF were to be fully implemented, the tri-partite categorization of impairment (loss or malfunction at the level of organ or body part), activity limitation (work, school, self-care, or social interaction, and generally activities of daily living), and handicap (defined contextually in connection with survival roles), underlies much of the efforts to obtain national and international data sets in the disability field. Note, however, that there is much inconsistency in the use of these terms. In particular, the usefulness of making a distinction between disability and handicap is queried (e.g., Edwards, 1997) in that essentially external causes underlie both.
Zinkin and McConachie (1995) recommend the definitions agreed by disabled people’s organizations:
In essence, “impairment” is an individual limitation, whereas “disability” is restriction imposed by the current organization of society. “Impairment” is defined by WHO (1980a) as “any loss or abnormality of psychological,
physiological, or anatomical structure or function.” Making descriptions at the level of the impairment allows focus on the individual child and her/his needs as an individual. When the emphasis is on children with impairments as a social group (original emphasis) we have used the term “disabled children,” defining disability as the disadvantage or restriction of activity caused by contemporary social organization which takes little or no account of people who have … impairments and thus excludes them from participation in the mainstream of social activities (UPIAS 1976, Finkelstein 1993) (p. xi).
The relevant terminology used in the education sector has changed dramatically during the last decades. The narrow disability based classifications and the resulting labelling of children are being replaced by wider definitions such as “disadvantaged children,” “children in especially difficult circumstances” or “children with special educational needs.” These broader terms include the whole range, from profound disabilities to minor difficulties in performing necessary functions (p. 3).
The educational focus is valuable for the present study, but their approach runs the risk of conflating very different phenomena. The Organization for Economic Cooperation and
Development (OECD) reported in a monograph (OECD, 2000a) and summarized in issues of the publication Education at a Glance (OECD, 1998; 2000b), separates out three cross-national categories currently referred to as disabilities, learning and behavior difficulties, and social disadvantages (OECD, 2003). These categories are derived from categories used in the collection of national educational statistics on children for whom additional resources are provided to enable them to access the regular school curriculum.
This type of resources definition is clearly wider than a more traditional medically based approach and is attractive as a means of operationalizing the broad educationally relevant definition advocated by Jonsson and Wiman (2001). However, it is based on data from the industrialized countries that constitute OECD, with the initial development of the instrument used in these studies incorporating pilot work in developing countries (OECD, 2000a; chapter 2).
This brief overview of some issues in defining disability for this study reinforces the stance taken by Fujira and Rutkowski-Kmitta (2001) in a detailed and insightful analysis of the issues involved in Counting Disability. Their chapter in the definitive Handbook of Disability Studies (Albrecht, et al., 2001) “challenges the validity or utility of a universally applicable or singular definition of disability” (p. 69). They reiterate the argument of Zola (1993) that “…how one chooses to define and thus count disability should largely be driven by the purposes of the count” (p. 78). Their approach that “focus is determined by function” recognizes that “counting disability is a ‘political arithmetic’ used to galvanize awareness of the relationship between society and disablement” (p. 93).
Several existing national systems for collecting data on disability have stated purposes similar to the purposes of the current study. For example, the Central Registry for Rehabilitation in Hong Kong aims “To facilitate provision of services and to assist in their reaching out to people with a disability” (Health and Welfare Bureau, 1995). In similar fashion, The National Intellectual Disability Database in Ireland is concerned “To provide information for
decisionmaking in relation to the planning, funding, and management of services” (Health Research Board, 1997).
Given that the main purpose of this study is to foster the inclusion of children with
• Be appropriate for counting children;
• Have educational relevance
• And, above all, be feasible for use in developing countries.
Hence, rather than adopting a single explicit definition of disability, these considerations will be borne in mind throughout the report.
Types of Disability Data Sets
The following account does not purport to provide a comprehensive review of all existing data sets in the general field of disability. It attempts to cover examples of data sets that appear to be of likely relevance to the purposes of this study.
Three main types of system for the collection of population level data on disability exist in the forms of national censuses, household surveys, and administrative registries.
National Censuses
Because of the great cost and substantial data demands of comprehensive national coverage in a census where the attempt is made to enumerate every person in a national population, the detail and depth of any questions about disability are severely limited.
Nevertheless, there is a strong case for all national censuses to include a section on disability, and for this to cover childhood disability in order to help ensure that childhood disability
becomes visible on the national policy agenda. The infrequency of national censuses limits their value as a tool for planning services and programs. Few of the censuses whose data are presented in the most recent version of the United Nations disability statistics database, which is itself still in preparation, DISTAT-2 (see Mbogoni and Me, 2002: Appendix 2), are less than 10 years old and several date from the 1980s or earlier.
Box 1 Advantages and Disadvantages of Using a Census to Collect Data on Disability
Advantages
1. To provide small areas data. The census is the only data collection activity nation-wide that can provide detailed data at the level of the smallest geographic area. Data collected though surveys can hardly be used to estimate disability prevalence even at the smallest level of geographical detail due to the limited sample size and the related sample errors. Data for program development and analysis at local level can only be collected through a census or a registration system, which is available only in a very limited number of countries.
2. To provide data to compare persons with disabilities and persons without disabilities. Every census collects data on living arrangements, employment, and education and if these characteristics are tabulated for persons with and without disabilities, different levels of participation related for example to education and work and employment can be easily measured.
3. To allow for time-series analysis. It is common in many countries that a census is undertaken on a regular basis, every five or ten years. If data on disability are collected in several censuses, time-series analysis can be performed in relation to disability prevalence rates and participation data.
4. To use as a sample-frame for a follow-up survey. Several countries, e.g., Canada, France, and New Zealand, have used the census to establish a sample frame for follow-up specialized surveys. In countries where a specialized disability survey is planned, persons identified through the screening module included in the census can provide a frame to more effectively design a sample frame for a more detailed survey on disability.
Disadvantages
1. Measuring the continuum. Disability is not a phenomenon that can be easily described with a binary classification yes/no. It is rather an experience that needs to be measured in a continuum to consider several issues such as intensity, duration, and environment. It is important that the instruments used be able to capture as much as possible the different points on this continuum. In this context the design of the question(s) used as a screener to identify the target population with disability should be carefully studied to be sure they do not exclude part of that population. To measure the complexity of this continuum, multiple questions to set context, clarify terminology, and define multiple domains are required. This aspect is particularly difficult in a census where the number of questions asked is restricted.
2. Need for extensive training of enumerators. The main focus of a census is the total counting of the population and their social and demographic characteristics. The collection of data on disability requires extensive training of enumerators on how to ask the questions, which may not be possible in a census.
3. Special Population Groups. The use of a short question in a census tends to underestimate special population groups such as, children, elderly, persons with cognitive and psychological impairments. Specialized surveys where longer instruments can be used are more suitable to measure disability in these sub-population groups.
4. Use of proxy. Censuses have an extensive use of proxy respondents.
In addition to the concerns discussed above about the impact of different approaches and terminology on prevalence rates, there are worries about the quality of census questions used to identify disability in terms of reliability and validity. Such testing as has been done in Australia (Davis and Gligora, 2001); Canada (Langlois, 2001) and the United States (McNeil, 1993) has not been encouraging. The Australian study, for example, led to a decision not to include any disability questions in the 2001 census as they did not reach criterion requirements for reliability and validity.
Although such studies provide valuable pointers toward improving validity and reliability, they are all in industrialized countries. Me and Mbogoni (2001) have analyzed the data available in DISTAT-2. They find that “person-level” questions (i.e., requesting information about individual household members) is associated with higher reporting of disability than “household-level” questions (i.e., is there anyone in this household who ...). Hess, et al., (2001), comparing the two types of question in a United States study, although replicating the finding, also reported that household-level questions produced more reliable data than the person-level approach, and in a shorter interview time. However, Mathiowetz and Lair (1994) find that household-level reports of functional limitations are higher than self-reports. Overall this is an area wherein the research base is weak and many of the factors likely to affect the reporting of disability are poorly understood,, particularly when the focus is on childhood disability in developing countries.
Household Surveys
Household surveys involve the systematic sampling of households with the sample so constructed that it is possible to arrive at an estimate of the feature of interest. Such a survey could focus solely on disability issues, but it is more likely that these would be embedded within a more wide-ranging study, typically of general health issues. Examples include the National Health Interview Survey (NHIS) for the United States; an annual survey of health and health care (National Center for Health Statistics, 1998). Questions on activity limitations and the presence of acute or chronic health conditions permit some assessment of disability. A 1996 survey of the West Bank in Palestine is a similarly structured one-off example (Palestinian Central Bureau of Statistics, 1996).
Box 2 Advantages and Disadvantages of Questionnaire Based Surveys
Advantages
General to all surveys using respondents
1. They provide a relatively simple and straightforward approach to the study of attitudes, values, beliefs and motives.
2. They may be adapted to collect generalizable information from almost any human population. 3. High amounts of data standardization.
Postal and other self-administered surveys
4 Often this is the only, or the easiest, way of retrieving information about the past history of a large set of people. 5. They can be extremely efficient at providing large amounts of data, at relatively low cost, in a short period of time.
6. They allow anonymity, which can encourage frankness when sensitive areas are involved.
Interview surveys
7 The interviewer can clarify questions.
8 The presence of the interviewer encourages participation and involvement (and the interviewer can judge the extent to which the exercise is treated seriously).
Disadvantages
General to all surveys using respondents
1 Data are affected by the characteristics of the respondents (e.g., their memory; knowledge; experience; motivation; and personality).
2 Respondents won't necessarily report their beliefs, attitudes, etc. accurately (e.g., there is likely to be a social desirability response bias - people responding in a way that shows them in a good light).
Postal and other self-administered surveys
3 Typically have a low response rate. As you don't usually know the characteristics of nonrespondents, you don't know whether the sample is representative.
4 Ambiguities in, and misunderstandings of, the survey questions may not be detected. . 5 Respondents may not treat the exercise seriously, and you may not be able to detect this.
Interview surveys
6 Data may be affected by characteristics of the interviewers (e.g., their motivation; personality; skills; and experience). There may be interviewer bias, where the interviewer, probably unwittingly, influences the responses (e.g., through verbal or nonverbal cues indicating “correct” answers).
7 Data may be affected by interactions of interviewer/respondent characteristics (e.g., whether they are of the same or different class or ethnic background).
8 Respondents may feel their answers are not anonymous and be less forthcoming or open.
Notes: Advantages 4 and 5 may be disadvantages if they seduce the researcher into using a survey when it may not be the most appropriate strategy to answer the research question(s).
The telephone survey is a variation of the interview survey which does not involve face-to-face interaction and has rather different advantages and disadvantages.
Surveys incorporating disability related questions can be on an annual or other regular basis, permitting the assessment of change or trend. An alternative is to have a regular general survey wherein more extensive disability related questions are included from time to time. The Health Survey for England (Department of Health, 1995) is an example of this approach.
There are disability-specific household surveys, though these are typically on a one-off basis or at relatively infrequent intervals. Examples include the five yearly National Survey of Disability, Ageing, and Carers in Australia (Australian Bureau of Health and Welfare, 1998), and the 1987 National Sampling Survey of Disability in China (Bureau of Statistics, 1990), which surveyed 1.6 million persons.
General health surveys in which disability questions form a minor part will be likely to present similar validity and reliability problems to those noted above in relation to censuses. Disability-specific household surveys can, in principle, avoid such problems, although question wording will require careful consideration and adequate pretesting. Durkin (2001), who has devised such an instrument (Durkin, et al., 1994, discussed below in Appendix 2), has carried out studies on validity, reliability, and sensitivity of survey questions in three developing countries in relation to child disability.
Service Registries
This is an administrative record of the numbers of persons in receipt of a service or benefit. The most common forms are adult health and employment programs, and children’s educational and social services. A large scale example is the Mexican Registration of Children with a Disability (Instituto Nacional De Estadistica Geografia e Informatica, 1998). Children of all education levels (2.7 million in 1995), from preschool upwards, are identified by type and number of disabilities together with basic demographic and socioeconomic indicators.
This type of record has the advantage that it is commonly collected routinely for
administrative purposes. With current emphases on accountability, there is a strong argument for countries having good data on the recipients of services and benefits. It is, however, highly problematic for population level demographics, or for making cross-country comparisons (the number of children registered will be a complex function of the types of programs, the eligibility rules, and how positively the programs are perceived by the population). Even in industrialized countries, only a fraction of persons with a disability are typically in receipt of a service or benefit. Fujiura (1998) estimates, for example, that in the United States, only 11 percent of persons classified as “mentally retarded” are served by the long-term residential care system. This is, of course, not to assert that such persons should be in a residential care system, only that the numbers in the system do not provide a reliable population indicator. In developing countries it would be anticipated that discrepancies would be large. For example, in Mauritius, the 1990 census identified nearly 28,000 persons with a disability. Half of them were in receipt of
The countries doing the most for children with disabilities inevitably appear to have the highest rates of disability. This may affect the willingness of government administrators to classify children as disabled.
Service records are, nevertheless, useful and important in providing information on who gains access to services and programs. The OECD study discussed above (OECD, 2000a; 2003) demonstrated, for example, that across a wide range of categories of not only disability, but also learning and behavior difficulties and social disadvantages, there is overrepresentation of male children in both special and regular school classrooms (typically a 60%/40% male/female split). This clearly raises important equity issues, discussed below.
Other Approaches
Other methods of data collection have been employed. For example:
Key informant surveys, which involve asking key people in the community, such as community leaders, teachers, and midwives, to identify all disabled persons in their community. This approach is attractive as low cost and feasible in developing countries. However, the method has been shown to be inaccurate when tried in various countries with serious
underestimation of less physically obvious conditions (e.g., Belmont, 1984; Thorburn, 1993).
Cohort studiesinclude organized longitudinal studies which follow a birth cohort, typically of several thousand children (e.g., Davie, et al., 1972; Stewart-Brown and Haslum, 1988). They are heavily resource intensive and effectively ruled out because of this in developing countries.
Examples of Disability Data Systems and of the Results They Produce
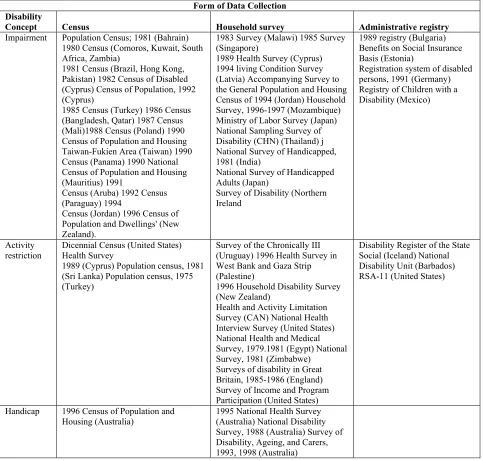
Table 1 provides a selection of disability data systems. They are classified by the type of data collection, and also by the concept of disability on which they are based (impairment, activity restriction, or handicap, as proposed in the ICF framework discussed above). This selection reflects the fact that most disability data systems are based on impairments and
restricted activities. In the developing world, systems based on impairment predominate. Where comparisons are possible, the different types of definition produce relatively consistent
differences in population estimates. For example, handicap type definitions typically produce lower estimates than activity restriction definitions. Impairment definitions are employed by countries reporting the lowest rates of disability.
Aruba (1991), 6.57 percent in Belize (1991), 7.56 percent in Bermuda (1991), to 12.15 percent in the United Kingdom (1991). It should be noted that the methodologies for obtaining these
[image:16.612.67.550.179.640.2]estimates differ considerably in method of data collection, type of definition, and date of the study.
Table 1Selected International Disability Data Systems by Disability Definition and Form of Data Collection
Form of Data Collection Disability
Concept Census Household survey Administrative registry
Impairment Population Census; 1981 (Bahrain) 1980 Census (Comoros, Kuwait, South Africa, Zambia)
1981 Census (Brazil, Hong Kong, Pakistan) 1982 Census of Disabled (Cyprus) Census of Population, 1992 (Cyprus)
1985 Census (Turkey) 1986 Census (Bangladesh, Qatar) 1987 Census (Mali)1988 Census (Poland) 1990 Census of Population and Housing Taiwan-Fukien Area (Taiwan) 1990 Census (Panama) 1990 National Census of Population and Housing (Mauritius) 1991
Census (Aruba) 1992 Census (Paraguay) 1994
Census (Jordan) 1996 Census of Population and Dwellings' (New Zealand).
1983 Survey (Malawi) 1985 Survey (Singapore)
1989 Health Survey (Cyprus) 1994 living Condition Survey (Latvia) Accompanying Survey to the General Population and Housing Census of 1994 (Jordan) Household Survey, 1996-1997 (Mozambique) Ministry of Labor Survey (Japan) National Sampling Survey of Disability (CHN) (Thailand) j National Survey of Handicapped, 1981 (India)
National Survey of Handicapped Adults (Japan)
Survey of Disability (Northern Ireland
1989 registry (Bulgaria) Benefits on Social Insurance Basis (Estonia)
Registration system of disabled persons, 1991 (Germany) Registry of Children with a Disability (Mexico)
Activity restriction
Dicennial Census (United States) Health Survey
1989 (Cyprus) Population census, 1981 (Sri Lanka) Population census, 1975 (Turkey)
Survey of the Chronically III (Uruguay) 1996 Health Survey in West Bank and Gaza Strip (Palestine)
1996 Household Disability Survey (New Zealand)
Health and Activity Limitation Survey (CAN) National Health Interview Survey (United States) National Health and Medical Survey, 1979.1981 (Egypt) National Survey, 1981 (Zimbabwe)
Surveys of disability in Great Britain, 1985-1986 (England) Survey of Income and Program Participation (United States)
Disability Register of the State Social (Iceland) National Disability Unit (Barbados) RSA-11 (United States)
Handicap 1996 Census of Population and
Housing (Australia) 1995 National Health Survey (Australia) National Disability Survey, 1988 (Australia) Survey of Disability, Ageing, and Carers, 1993, 1998 (Australia)
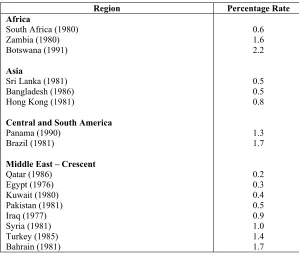
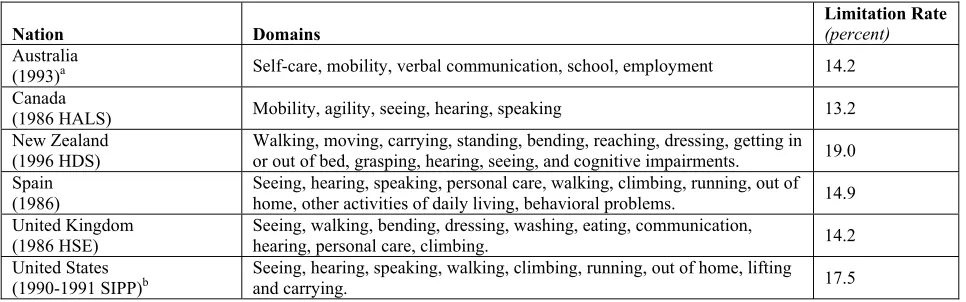
If comparison is restricted to national estimates of disability taken from impairment based national censuses, as shown in Table 2, the variability in estimation is substantially reduced. A similar convergence, but at much higher values, appears in major national surveys, mainly carried out in industrialized Western nations, which assess limitation prevalence. These are summarized in Table 3. Note that the number of “domains” (areas of activity) included varies from study to study.
Asking Different Questions Produces Different Answers
The above discussion makes it clear that there is a lack of uniformity in the questions used by countries to identify the population with disabilities and, linked to that, a lack of
uniformity in the definition of disability employed. And that these differences are systematically related to the estimates of prevalence obtained. It is not only the type of question, but its exact wording, the context in which it is asked, and the order in which questions are asked that affect the answers received. All this is clearly a problem from the perspective of making valid
[image:17.612.154.453.366.621.2]international comparisons of prevalence rates in different countries. As discussed in the preceding section on defining disability, it is necessary to take note of the purpose to which a definition will be put in deciding its appropriateness. This issue is returned to in the final section of this report.
Table 2 Disability Prevalence Estimates Based on Impairment Definitions
Region Percentage Rate
Africa
South Africa (1980) Zambia (1980) Botswana (1991)
Asia
Sri Lanka (1981) Bangladesh (1986) Hong Kong (1981)
Central and South America Panama (1990)
Brazil (1981)
Middle East – Crescent Qatar (1986) Egypt (1976) Kuwait (1980) Pakistan (1981) Iraq (1977) Syria (1981) Turkey (1985) Bahrain (1981) 0.6 1.6 2.2 0.5 0.5 0.8 1.3 1.7 0.2 0.3 0.4 0.5 0.9 1.0 1.4 1.7
Table 3 Limitation Prevalence by Nation
Nation Domains Limitation Rate(percent)
Australia
(1993)a Self-care, mobility, verbal communication, school, employment 14.2 Canada
(1986 HALS) Mobility, agility, seeing, hearing, speaking 13.2
New Zealand (1996 HDS)
Walking, moving, carrying, standing, bending, reaching, dressing, getting in or out of bed, grasping, hearing, seeing, and cognitive impairments. 19.0 Spain
(1986) Seeing, hearing, speaking, personal care, walking, climbing, running, out of home, other activities of daily living, behavioral problems. 14.9 United Kingdom
(1986 HSE) Seeing, walking, bending, dressing, washing, eating, communication, hearing, personal care, climbing. 14.2 United States
(1990-1991 SIPP)b Seeing, hearing, speaking, walking, climbing, running, out of home, lifting and carrying. 17.5
a. Excludes canvas of impairments. b. Functional limitations definition.
Source: Fujiura and Rutkoski-Kmitta (1995; table 2.8, p.83).
Qualitative Studies on the Lives of Children in Developing Countries
Qualitative studies enable the experiences and feelings of people to be explored, permitting an understanding of their lives not accessible by means of quantitative surveys or other data collection techniques resulting in numerical information only. A wide variety of methods can be used, including the use of relatively unstructured interviews, focus groups or other group interviews, participant observation, and so on. Such studies are particularly
important for marginalized groups such as children with disabilities in developing countries. In studying disabled childhood there is a tendency to rely on the views of parents, teachers, and other professionals, hence denying the voice of the child.
Shakespeare, et al., (2000) describe an ongoing qualitative study of life as a disabled child through the children’s own experiences and perspectives. They focus on disabled children between 11 and 16 and include children with a wide range of physical, mental, and sensory impairments and who are from a range of backgrounds, in both inclusive and segregated settings. They aim to examine the role of structural factors, social settings, cultural contexts, and policy implementation by shedding light on all aspects of the lives of disabled children, their
relationships with family, peer group and adults, their experiences at home, at school, and in leisure. Although their study is based in England and Scotland, the central features of their approach are applicable in all contexts, including developing countries.
The United Nations Convention on the Rights of the Child (CRC) places great emphasis on the participation of children and the disabled in decisionmaking (Committee on the Rights of the Child, 1997). Regional meetings have been proposed “…to which disabled children and young people, and local disability organizations would be invited to present their experiences of respect or lack of respect for their rights, what they would like to see changed and their
suggestions for further action” (Committee on the Rights of the Child, 1999; p. 50).
Data Sets and Classificatory Frameworks Produced by or Associated with International Organizations
This section reviews and critiques the data that the World Bank and other international organizations are collecting regarding children with disabilities and their education. The main international organizations involved, apart from the World Bank, are the United Nations (particularly its Statistics Division), UNICEF, UNESCO, OECD, the European Community (particularly through its statistical arm, EUROSTAT, and WHO (primarily through the development of classificatory systems, including ICF).
Other potentially relevant organizations, briefly reviewed at the end of this section, include DHS (Demographic and Health Surveys), SIMPOC (an offshoot of the International Labor Organization, ILO, concerned with monitoring child labor), Development Banks (e.g., The Inter-American, African, and Asian Development Banks). There are also umbrella organizations such as the Washington Group on Disability Statistics and the PARIS21 Consortium (Partnership in Statistics for Development in the 21st Century), which bring together different organizations with interests in disability and development statistics respectively.
The World Bank
The section on “Primary Data Documentation” in the World Bank publication on World Development Indicators (World Bank, 2002) makes it clear that:
The World Bank is not a primary data collection agency for most areas other than living standards and debt. As a major user of socioeconomic data, however, the World Bank places particular emphasis on data documentation to inform users of data in economic analysis and policymaking. (p. 381)
Relevant data and statistics to this study are available in the “EdStats” pages of the World Bank Web site http://www.worldbank.org/data/, which present country-specific and themed data, regional indicators, and links to other sources. It concentrates on making a variety of national and international data sources from the United Nations Institute for Statistics (UIS), and the OECD, available in one location.
There are extensive tables giving country profiles in respect of Education for All (EFA) and thematic data on progress in relation to the Millennium Development Goals (MDG)
although it appears that there is existing disability information that could be included. For example a Lesotho national report includes a disability question, but data on this are excluded from the World Bank country profile (see http://www1.worldbank.oeg/education/edstats/, Education for All 2000 assessment, country specific data).
The link to “Children with disabilities” leads to United Nations and United States disability sites discussed below, and hence gives no new or additional information on children with disabilities and education. Similarly, a section on Vulnerable Children and Children with Disabilities, in material on Early Child Development (ECD) covers relevant reports from other organizations; for example “Early intervention and education for children and youth with disabilities into the twenty-first century: situation in the Asian and Pacific region” (UN Economic and Social Commission for Asia and the Pacific – ESCAP).
There is, however, recognition that the World Bank needs to be more proactive in this area. The call for the production of the present review results, presumably, from this. A recent meeting on Educating Children with Disabilities in Developing Nations (Scofield and Fineberg, 2002), to which Judith Heumann, recently appointed Disability and Development Advisor at the World Bank, and Robert Prouty, World Bank Lead Education Specialist, contributed, brought up lack of data as a key concern, regretting the fact that there are virtually no data on disability at the World Bank.
It should be stressed that there are of course other relevant World Bank activities apart from data collection. There is extensive material on Statistical Capacity Building, where technical assistance is offered to member countries on creating an adequate statistical base for the analysis of economic, financial, and social developments necessary to guide policy making. The World Bank also supports projects which serve persons with disabilities, and projects in this area are currently growing in number.
For example, in the education area, several projects have components that benefit persons with disabilities. They include:
• India Basic Education and District Primary Education Projects, which assists primary school teachers in the project districts in identifying and assessing children with disabilities and developing inclusive programs for their education.
• India Technician Education Project, which establishes two polytechnic institutions that are designed for students with disabilities.
• Nepal Second Basic and Primary Education Project, which supports inclusive education of children with nonsevere disabilities in primary schools.
• Yemen Vocational Training Project, which finances subprojects for vocational training and rehabilitation of persons with physical disabilities.
Various World Bank sponsored reports also are relevant. Metts (2000) contributed a lengthy report “…intended to provide the World Bank with the information and insights
necessary for policy formulation and strategic planning in the area of disability” (p. ii). Although there are some data, the concern is primarily with policy formation. Lynch (1994) includes more data and is based on “…desk studies, documentary searches and 15 case studies of primary schooling for children with special educational needs in the Asia region” (p.1). “Special educational needs” is interpreted widely to include “impairments and other disadvantages.” There are several papers on poverty and disability (e.g., Elwan, 1999) and a particularly useful one on “Education, Poverty and Disability in Developing Countries” (Jonsson and Wiman, 2001). It provides examples of the school enrollment rates of disabled children in some developing countries, reproduced below as Box 3.
Box 3 Examples of Disabled Children’s School Enrollment Rates
Philippines (1997)
Department of Education enrollment records 1997-8 indicate that of 3.5 million disabled children of school-going age only 40,710 are actually enrolled in schools (1.16%). In the Asian Pacific Region the overall enrollment rate of disabled children is estimated to be less than 5 percent.
(V. Ilagen (2000) “Inclusive Education in the Asian Pacific Region: Are the Disabled Included?)
Mozambique, Maputo Province (1997)
Out of the total of 170,000 children attending regular schools, 1,167 were children with special educational needs (0.7%).
(E. Lehtomaki, L Chiluvane and I Viniche (2000) “Case Strengthening Social Networks in and around the School: Experiences in Maputo Province, Mozambique”)
Ethiopia (1999)
The male/female ratio among students with disabilities enrolled in special settings was 140:1. The overall enrollment rate of children with disabilities enrolled in these settings was estimated to be less than 1 percent. (M. Mengesha (2000) “Special Needs Education: Emerging in Ethiopia”)
Source: Savolainen, et al., (2000).
Persuasive arguments are put forward in favor of an inclusive, mainstream education for children with disabilities, as against segregated residential provision, claiming that:
The claim is made that few, if any, children who are disabled require segregated
residential provision for educational or any other reasons. See also a World Bank report focusing on Eastern Europe and the former Soviet Union, which makes a similar case (Tobis, 2000).
The United Nations Statistics Division
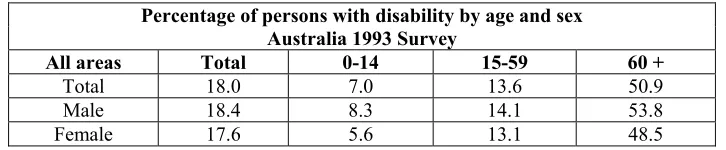
The Statistics Division of the United Nations, which forms part of its Department of Economic and Social Affairs, produces extensive statistical databases. In the field of disability its central resource is the International Disability Statistics Data Base, DISTAT, the most up to date version of which is DISTAT-2, which is not yet fully available (Mbogoni and Me, 2002). The database is available on-line at http://unstats.un.org/unsd/disability/. Currently “…the only information we have on children with disabilities from DISTAT-2 are prevalence rates by age groups for those aged 0–14” (personal communication from Margaret Mbogoni, Statistician, United Nations Statistical Division to Jan Georgeson, researcher for the present study, 20 March 2003). Table 4 gives an example of the data available together with the questions used to identify persons with a disability. DISTAT (i.e., the original version of the database) included
[image:22.612.125.488.381.456.2]information on the socioeconomic characteristics of persons with disabilities, together with data on the educational attainment and school attendance of children (see the “Disability Statistics Compendium” United Nations, 1990). Unfortunately an update on these aspects is not yet available (Mbogoni, personal communication, as above).
Table 4 Example of Results of Search of DISTAT
Percentage of persons with disability by age and sex Australia 1993 Survey
All areas Total 0-14 15-59 60 +
Total 18.0 7.0 13.6 50.9 Male 18.4 8.3 14.1 53.8 Female 17.6 5.6 13.1 48.5 Source: Tables provided by country.
It is important to note that the database is a collection of census, survey, and administrative registration systems information as provided by countries, supplemented by information provided from correspondence with national statistical services. The questions used to collect information in individual countries are available on the database. Because of the methodology used in compiling the database, it carries the important warning “…due to differences in the concepts and methods used in collecting data on disability, prevalence rates should not be compared across countries.”
Together with other units of the United Nations Secretariat, the specialized agencies and regional commissions, … cooperate with developing countries in evolving a realistic and practical system of data collection based either on total enumeration or on representative samples, as may be appropriate, in regard to various disabilities, and in particular, … prepare technical manuals/documents on how to use household surveys for the collection of such statistics (United Nations, 2001; p. iii).
The resulting Guidelines and Principles for the Development of Disability Statistics (United Nations, 2001), although oriented to statisticians, is intended to be useful to managers of disability programs “as they are essential partners in developing objectives for a data collection activity and the use of the resulting data” (p. iii). Use of the ICIDH/ICF framework is advocated. It covers a wide range of issues that are central to planning and organization in collecting data on disability. There also are useful suggestions on sampling issues, and on the dissemination and use of disability data. It is intended to be applicable to both industrialized and developing world contexts. Box 4 provides details of the contents.
Box 4 Contents of “Guidelines and Principles for the Development of Disability Statistics”
CONTENTS
INTRODUCTION
A. International recommendations
B. The International Classification of Impairments, Disabilities, and Handicaps (ICIDH) 1. The three ICIDH concepts of disablement
2. The International Classification of Functioning, Disability and Health-ICF 3. Application of the ICIDH in disability data collection
C. Data sources on disability 1. Surveys
2. Population censuses
3. Advantages and limitations of using censuses and surveys to collect disability data 4. Administrative records and registers
GENERAL ISSUES IN PLANNING AND ORGANIZING THE COLLECTION OF DATA ON DISABILITY
A. Preparatory activities
1. Identifying the objectives of the study
2. Consulting users and persons with disabilities, and examining relevant existing data 3. Publicity
4. Defining the population with disabilities
B. Designing questions to identify persons with disabilities
C. General issues in design and operations 1. Choice of respondent
2. Nonresponse
3. Mode of data collection 4. Translation of questionnaires 5. Data processing
METHODOLOGY FOR DISABILITY DATA COLLECTION A. Censuses
1. Investigating disability in a population census 2. Developing disability questions for a census
3. Additional topics on disability to be investigated in a census 4. Using a population census as a screen for a follow-up survey B. Surveys
1. Approaches to collecting disability data in sample surveys 2. Survey questionnaire design
3. Development of questions to identify persons with disabilities 4. Measuring cognitive and psychological functioning
5. Special topics (causes, duration, technical aids, environment, and services and support)
C. Sampling for a disability survey 1. Scope and purpose
2. Keys to determination of sample size 3. Optimum use of sample frames
4. Use of two-phase sampling and post-stratification 5. The potential for use of large clusters in sample design 6. General principles for disability survey sampling: summary 7. Country experiences: sampling schemes
D. Collecting data on disability in institutions 1. Types of institutions to include
2. Drawing a sample of institutions and respondents 3. Enlisting the support of the institutions
4. Considerations when interviewing institutional residents
DISSEMINATION AND USE OF DISABILITY DATA
INTRODUCTION A. Planned tabulations
1. Number of persons versus number of disabilities
2. The socioeconomic profile of the population with disabilities 3. Comparisons of persons with and without disabilities 4. Recommended tabulations
B. Reports and publications
C. Other forms of dissemination and use 1. Making unpublished data available 2. Preparing special tabulations on request 3. Disseminating micro data on computer media
4. Providing on-line dissemination and computer access to the data D. Indicators
1. Indicators that measure the presence of disability 2. Indicators that measure the equalization of opportunities 3. Disability-free life expectancy
Questions Used to Identify Persons with Disabilities
1. Is there anyone in the household who has any loss of sight? 2. Can X see normally wearing glasses or contact lenses? 3. Does anyone have any loss of hearing?
4. Does anyone have anything wrong with their speech?
5. Is there anyone who has blackouts or fits, or loses consciousness?
6. Does anyone have any condition that makes them slow at learning or understanding things?
7. Does everyone have full use of their arms and fingers?
8. Does anyone have difficulty gripping or holding things such as a cup or pen? 9. Does everyone have full use of their feet and legs?
10. Is anyone receiving treatment for nerves or an emotional condition?
11. Does anyone have any condition that restricts them in physical activities, or in doing physical work?
12. Does anyone have any disfigurement or deformity?
13. Does anyone ever need to be helped or supervised in doing things because of any mental illness?
Appendixes provide more detailed information on ICF examples of questions for identifying disability among children, various instruments for identifying cognitive and
psychological impairments, and national examples of survey questions relating to use of services and support. This document, and any revised versions that are published, represent key resources for all involved in the production and use of disability statistics in the developing world.
the meeting, fully accepted by the participants, was to guide the development of a small set(s) of general disability measures, suitable for use in censuses, sample based national surveys, or other statistical formats, which will provide basic necessary information on disability throughout the world (p. 1).
This is an ongoing group, with a second meeting planned for 2003, followed by an estimated three further meetings (see their Web site for further developments,
http://www.cde.gov/nchs/citygroup.htm). While it is currently a “work in progress” clearly such a development will be of considerable value in achieving the purposes of this study. UNSD
representatives discussed some of the advantages and disadvantages of using the ICF framework and classification (Mbogoni and Me, 2002), which are considered below in the section on WHO. In relation to developing countries, Mbogoni (2000) points out the wide range of questions used in surveys and censuses to assess disability in the 1990 census round and shows that, although there is less variability in the 2000 round, only 5 of the 11 of the countries reviewed made use of the United Nations recommended list of disabilities, based upon the ICIDH, given below as Box 5. The “personal care” question was asked only in one of the 11 countries reviewed (Mauritius). Mbogoni also points out that use of the list did not mean that countries were asked the same kind of initial screener question; indeed each of the five employed quite different questions, as shown in Box 6.
Box 5 UN Recommended List of Questions on Disability
a. Seeing difficulties (even with glasses, if worn)
b. Hearing difficulties (even with hearing aid, if used)
c. Speaking difficulties (talking)
d. Moving/mobility difficulties (walking, climbing stairs, standing)
e. Body movement difficulties (reaching, crouching, kneeling)
f. Gripping/holding difficulties (using fingers to grip or handle objects)
g. Learning difficulties (intellectual difficulties, retardation)
h. Behavioral difficulties (psychological, emotional problems)
i. Personal care difficulties (bathing, dressing, feeding)
j. Others (specify)
Box 6 Different “Screener” Questions Used by Those Countries Using the UN Recommended List
1. Do you/Does … have problems with any of the following?
2. Does the person experience any disability (i.e., any limitation to perform a daily-life activity in a manner considered normal for a person of his/her age) because of a long-term physical/mental condition or health problem?
3. Does … suffer from any long-standing disability that prevents him/her from performing an activity?
4. Do you have any long-term illness or disability?
5. Which of the following basic activities are affected by any nonlasting condition that you may have?
The review points out the need for a standardized screener question, as well as a recommended list and guidance on its use.
The World Health Organization (WHO)
WHO, as its Web site makes clear, “…does not have any data on the number of people who have disabilities” (http://www3.who.int/whosis/faq/). What it does have, as already alluded to several times in this study, is the International Statistical Classification of Functioning, Disability, and Health (ICF), see http://www.who.int/classification/icf. It is a newly developed member of the WHO family of international classifications and seeks to describe how people live with their health condition. It is a classification of health and health-related domains that
describe body functions and structures, activities, and participation. The domains are classified from body, individual, and societal perspectives, together with a list of environmental factors.
The precursor WHO classification, International Classification of Impairments, Disabilities, and Handicaps (ICIDH), was heavily criticized in relation to disability mainly because its conceptual basis was exclusively medical, leading to a medicalization of disability (e.g., Pfeiffer, 1998; though attempts were made to counter this criticism, e.g., Ustun, et al., 1998). The lack of involvement by persons with disability or their organizations also attracted criticism. ICF made attempts to counter this, with efforts to closely involve the organizations of people with disabilities and to remove “handicapism” language. ICF also recognizes that disability is a social construct.
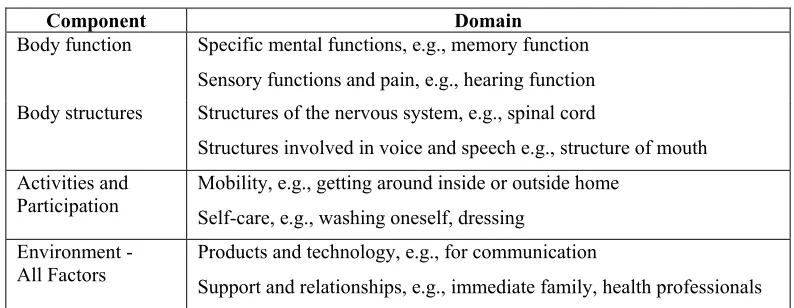
Table 5 Examples of ICF Components and Domains
Component Domain
Body function Specific mental functions, e.g., memory function Sensory functions and pain, e.g., hearing function Body structures Structures of the nervous system, e.g., spinal cord
Structures involved in voice and speech e.g., structure of mouth Activities and
Participation
Mobility, e.g., getting around inside or outside home Self-care, e.g., washing oneself, dressing
Environment - All Factors
Products and technology, e.g., for communication
Support and relationships, e.g., immediate family, health professionals
There is classification within components. Domains consist of facets or blocks, within which are nested groups of up to four-level categories, as illustrated in Table 6.
Table 6 Classification Within Components in the ICF
Domain, e.g., Communication (within the Activities and Participation component) Facet, e.g., Conversation and use of communication devices and techniques Two-level category, e.g., Conversation
Three-level category, e.g., Sustaining a conversation Four-level category, if needed
All domains are coded with a “generic” qualifier, recording the extent of the “problem” as none, mild, moderate, severe, or complete. There also are qualifiers for specific components. For example, a second qualifier for body structure measures the change in body structure and a third measures the localization of the impairment. There also are environmental factor qualifiers that measure the extent to which an environmental factor acts as a facilitator or barrier.
The United Nations Educational, Scientific, and Cultural Organization (UNESCO)
UNESCO has taken the lead role in worldwide organizations on matters concerning the education of children with disabilities and of special needs education more widely. As discussed earlier in this review the term “children with special needs,” although variously defined, is commonly taken to include those with a range of difficulties and sometimes disadvantages, as well as those with disabilities.
• Number of countries using different forms of provision (e.g., boarding special schools);
• How pupils are recorded for official purpose (e.g., registered in disability groups);
• Presence or absence of policy of integration;
• Presence or absence of links between special and ordinary schools;
• Number of pupils in special schools as a percentage of school age population; and
• Preschool provision for children with special educational needs (e.g., available for less than 10 percent of children).
UNESCO has adopted a mission statement committing itself to the concept of “inclusive education” deriving from the Salamanca Statement and Framework for Action 1994 (see
UNESCO, 1999). A typical project under this heading is “Steps towards inclusive education in Thailand and Lao PDR,” which promotes access and quality education for children with
disabilities (http://www.unescobkk.org/education/apeal/Bulletin81/part201a_special_needs.htm).
UNESCO also has been involved, together with EUROSTAT and OECD, in a special study on data collection between 1996 and 1999, focusing on the revision of the International Standard Classification of Education (ISCED) (UNESCO, 1997). As the title indicates, this is a classificatory system and has an analogous role in education to that of the ICF framework in the field of health. Box 7 shows the levels of the ISCED system. A central feature of the revised ISCED classification is that the prime criterion for assignment of an educational program to an ISCED level is the content of the program. Descriptions are given of the content expected for each level. The very different nature of educational systems in different countries, including different organization of the cycles of education (e.g., some but not all countries distinguish between lower and upper secondary education) complicate this exercise and make international comparisons difficult. The UOE (UNESCO, OECD, EUROSTAT) data collection exercise discussed below focuses on industrialized countries with OECD membership and makes use of the ISCED framework.
Box 7 The ISCED Levels of Educational Programs
Level 0 - Pre-primary
Level 1 - Primary Education – first cycle of basic education
Level 2 - Lower Secondary Education – second cycle of basic education Level 3 - Upper Secondary Education
Level 4 - Non tertiary level programs serving students who have already completed the upper secondary level Level 5 - Tertiary level programs not leading directly to an advanced research qualification
In the field of special educational needs the assignment of some programs to ISCED levels has proved contentious. For example, a program for older students with severe or profound learning difficulties may in content terms appear closest to primary basic education. However, it also could focus on life and self-help skills which share some of the aspirations of programs for students coming to the end of their school education.
UNESCO’s role in relation to the Education for All (EFA) global initiative is discussed below.
The Organization for Economic Cooperation and Development (OECD)
OECD takes the lead role in the UOE data collection exercise referred to in the preceding section. This is used, among others, to produce the yearly Education at a Glance handbook (e.g., OECD, 2002). It is a substantial and influential book currently running to approximately 400 pages. Short “Highlights” are available and the data sets can be accessed via the Internet (http://www.oecd.org/els/stats/els_stat.htm).
A wide range of indicators covers the context in which education systems work, the financial and human resources that OECD countries invest in education, access, participation, progression, and completion, the learning environment, outcomes, and student achievement. Although coverage is mainly of the industrialized OECD countries, recent editions have included some indicators for nonmember countries participating in the UNESCO/OECD World Education Indicators program funded by the World Bank. Coverage of children with disabilities was, until recent editions, limited to information about students educated in segregated special schools. However, recent editions have included new indicators on “Students Receiving Additional resources to Access the Curriculum” (disabilities, learning or behavior difficulties, and social disadvantages) (OECD, 2000:2001).
As the heading suggests, a “resource based” definition has been adopted. This approach was taken because of difficulties encountered in making meaningful international comparisons when different countries have very different national definitions of special educational needs. Some definitions are limited to purely organic physical and sensory disabilities although other countries include socially and economically disadvantaged students. However, it was accepted that many OECD countries made additional resources of various kinds available to students who had particular difficulties for a variety of reasons in accessing the regular curriculum, whether or not this came within a national definition of special educational needs. A further complication is that although a large proportion of countries had national categories of needs, the actual
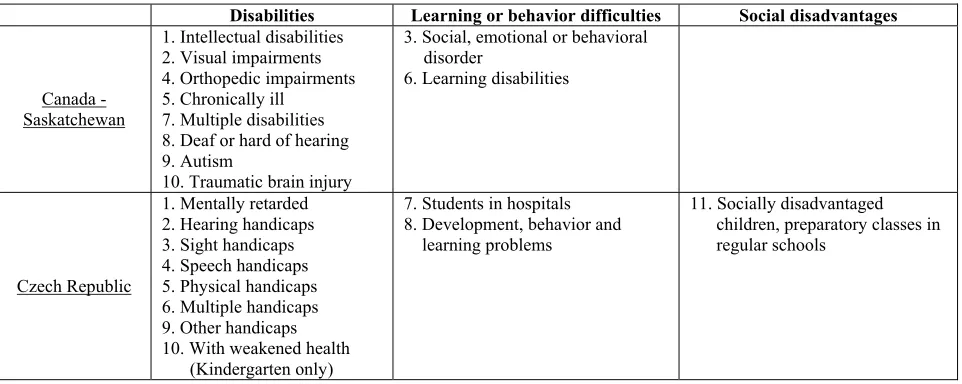
Table 7 Examples of Allocation of National Categories to the Three Cross-national Categories
Disabilities Learning or behavior difficulties Social disadvantages
Canada - Saskatchewan
1. Intellectual disabilities 2. Visual impairments 4. Orthopedic impairments 5. Chronically ill
7. Multiple disabilities 8. Deaf or hard of hearing 9. Autism
10. Traumatic brain injury
3. Social, emotional or behavioral disorder
6. Learning disabilities
Czech Republic
1. Mentally retarded 2. Hearing handicaps 3. Sight handicaps 4. Speech handicaps 5. Physical handicaps 6. Multiple handicaps 9. Other handicaps 10. With weakened health
(Kindergarten only)
7. Students in hospitals 8. Development, behavior and
learning problems
11. Socially disadvantaged children, preparatory classes in regular schools
Source: OECD (2003; Table 3.2).
The indicators developed (OECD, 2001) include the percentage of students receiving additional resources in primary and lower secondary education in different countries, both
overall and within the cross-national categories; the location of their education in special schools, special classes, or regular classes; and the gender distribution in the different locations. A
monograph giving further details and analyses of individual categories in relation to particular disabilities is available (OECD, 2000) and a further monograph is in preparation (OECD, 2003).
The general message obtained is of very wide country to country variability. In some countries virtually all children of whatever disability or difficulty are educated in integrated settings (e.g., Italy and the New Brunswick province of Canada). In others almost all students with disabilities are in special schools (e.g., Switzerland and the Czech Republic). However, there is a high degree of consistency in gender distributions, with a 60/40 male/female split for different categories and cross-national categories. It is not possible to state with any degree of confidence whether this represents an inequitable distribution. Further data collection is planned that should help elucidate this finding (OECD, 2003).
Data collection is based on responses to a questionnaire and the completion of data collection tables following the conventions of the main UOE data collection exercise (OECD, 2000; p. 105 and Appendix 3; p. 121). The collection relies on data that are either already collected nationally or regionally or which can be readily collected. The instrument has been tested in both paper and electronic versions and also has been piloted for data collection at school level.
operationalization in the context of the industrialized countries of the ISCED-97 call for a definition in resource terms. In the developing countries context, a definition in terms of “additional resources needed” would appear to be both more realistic and to help pinpoint what is required to implement programs and services.
Through collaboration with UNESCO, initial pilot work was carried out in Sri Lanka and Zambia. The data collection instrument was further tested in Chile, Costa Rica, the Philippines, Uganda, and Zambia, with encouraging results. The instrument is currently forming the basis for further related data collection exercises in the countries of South America.
OECD also is responsible for PISA, the Program for International Student Assessment (OECD, 1999), a new regular survey of 15-year-olds assessing their preparedness for adult life. At present PISA does not appear to have fully taken on board what is needed to include students with disabilities (e.g., no accommodations of the test to make it accessible to blind or physically handicapped students are currently allowed). However, efforts are being made to remedy this situation.
OECD, through its Center for Research and Innovation in Education (CERI), has carried out studies on integrating students with special needs into mainstream schools. These studies have incorporated other exercises in comparative statistical data collections (e.g., Evans, et al., 1995).
PARIS21 (Partnership in Statistics for development in the 21st Century) is based at OECD. It was launched in 1999 “…to act as a catalyst for promoting a culture of evidence based policymaking and monitoring in all countries, and especially in developing countries”
(PARIS21, 2002). It does not, to date, appear to have any disability focus.
The European Union
The European Union through its statistical arm EUROSTAT and EURYDICE (the information network on education in Europe, which is part of SOCRATES, the communities’ program on education) provides extensive data on the education systems in Europe. In the field of interest to this review, much is published under the heading of special educational needs rather than disability.