© 2016, IRJET | Impact Factor value: 4.45 | ISO 9001:2008 Certified Journal
| Page 1970
Automatic Tumor Segmentation Using Image Geometry and Intensity
Parameters
Adhish Aithal K
1, Dr.C H Renumadhavi
21
M.Tech, Department of Electronics and Instrumentation Engineering, RV College of Engineering, Bengaluru,
Karnataka, India
Associate Professor, Department of Electronics and Instrumentation Engineering, RV College of Engineering,
Bengaluru, Karnataka, India
---***---Abstract -
The paper presents an efficient method to extracttumor in the brain images from MRI (Magnetic Resonance Imaging) images. The proposed algorithm will initially have pre-preprocessing stage which removes the noise present in the image such as annotations, markings, etc. and skull stripping process which involves removal of the muscles, bones, and so forth exhibit in the picture. The next stage is to choose the mask containing the tumor which will be given to the segmentation stage. The segmentation method is implemented using Chan-Vese level set method which is a region based segmentation technique. The accuracy obtained from the proposed algorithm is 95%. This algorithm for brain tumor segmentation provides efficient approach to extract brain tumor from MRI image which helps the experts to analyze the desired region of interest.
Key Words: MRI (Magnetic Resoance Imaging), Tumor, Skull stripping, Chan-Vese level set.
1.
INTRODUCTION
Brain Tumor is an abnormal growth of a mass of tissue that grows violently in the brain or central spine which disrupts proper brain function. The brain tumors are classified as Benign and malignant. The Benign is the least belligerent type of brain tumor which do not contain cancer cells, but the latter one contains cancerous cells and are considered to be life threatening [1]. According to the survey, over 78000 people are diagnosed for tumor every year, out of which 25000 cases are malignant and remaining 53000 are found to be non-malignant. It has been estimated that over 24,880 new tumor cases will be registered in the year 2016[2]. The average endurance rate of brain tumor patients is only
34.4% and in India every 2 of 1,00,0000 people die from Brain tumor.
Brain Tumor can be detected using Computed Tomography (CT) and Magnetic Resonance Imaging (MRI) techniques. MRI has advantage over other imaging techniques because it yields an excellent soft tissue and a comprehensive image with contrasting boundaries among the anatomical structure [3]. A T1 weighted image will give a bright or high intensity region for fat and a dark or low intensity region for water, because of the short Echo Time (TE) of fat. A T2 weighted image will give bright regions of fat and water because of long TE.
Appropriate segmentation of tumor and statistics of the tumor located region will give noble features which helps clinicians to trace the position of tumor for diagnosis, treatment, surgical planning, radiation therapy, etc. Several techniques are used to detect brain tumor such as fuzzy methods, neural networks, watermarking techniques, morphological methods, variation segmentation, etc. The SVM technique yields an accuracy of 85% on average [4]. The watermarking and tamper detection technique is applicable for images having Region of Interest (ROI) up to 20 percent of the overall image [5]. In reference to the above mentioned techniques an efficient way to overcome the problem is necessary. This paper emphasis on extracting the brain tumor using Chan-Vese level set method segmentation which is independent of the ROI size. The upcoming section of this paper discuss about the methodology used in this paper, followed by the third section will focus on the results and analysis obtained using this technique.
2. METHODOLOGY
© 2016, IRJET | Impact Factor value: 4.45 | ISO 9001:2008 Certified Journal
| Page 1971
Fig -1: Flow diagram of the proposed algorithm
The initial stage of the algorithm involves pre-processing which remove the noise such as annotation, markings, etc. in the image, followed by the mask selection and finally segmentation stage using Chan-Vese level set method. The first step performed is the image pre-processing which involves the removal of noise and extra cranial tissues in the image such as skull, skin, bone, muscles, etc.
2.1 Pre Processing
The MRI images may contain text or ROI (Region of Interest) marked by the radiologist. This needs to be eliminated before sending the image to the segmentation stage. Along with the noise the brain image will have skull, muscles, bone which needs to be removed. This can be achieved using Otsu thresholding followed by morphological opening [4], which removes the noise as well as the skull from the brain MRI image. Otsu thresholding algorithm uses zeroth and first order cumulative moments of the gray level histogram.
(1)
is the weight of the image, is the number of pixel of intensity level of the image of L given in equation (1). The optimal threshold is selected for the lowest point in the two classes to maximize the separation of the resultant classes in gray levels as given in equation (2).(2)
Later mathematical Morphology opening operation is applied to get the skull free image. Opening is erosion
followed by dilation. Opening of image ‘A’ by masking element ‘B’ is given by (3). The masking element of size 3x3 is used.
(3)
2.2 Mask Selection
Selecting the mask is a vital step which selects the tumor region as a primary location which serves as the input to the Chan- Vese algorithm for segmentation. The mask can be manually set by the user or selected based on parameters. The mask is selected automatically dividing the images into sub regions and obtaining its area. The regions with round shape, area with certain threshold value and having intensity of certain threshold value is taken as the region containing the tumor. This provides a boundary enclosing the tumor. The obtained boundary box enclosing the region will serve as mask input to the next segmentation stage.
2.3 Chan – Vese Segmentation
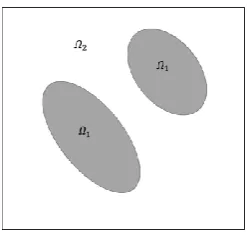
Chan-Vese segmentation is a region based segmentation procedure. This algorithm initially divides the image into two regions, foreground region ( ) and background region ( ) as shown in Fig-2. The components present in the foreground region are independent or may not be connected [6]. The Chan-Vese equation is given by Equation (4).
Fig -2: Depiction of foreground and background regions
(4) Where ‘I’ is the input image with ‘ ’ and ‘ ’ are the threshold intensity level for foreground and background region respectively, is the length of the boundary of the foreground region [7]. This equation can be made independent of foreground region by rewriting the equation (4) as
[image:2.595.356.480.457.573.2]© 2016, IRJET | Impact Factor value: 4.45 | ISO 9001:2008 Certified Journal
| Page 1972
Equation (5) is written in terms of heavy side step functionwhich is defined as
(6)
If is 1 it indicates the foreground region ( ) for positive values of ϕ and 0 indicates the background region for negative values of ϕ. The boundary of the region the differential term in equation (5), which will be zero valued within the region, but will be non zero at the boundary and the integration of 𝛻ϕ in the boundary region will provide the boundary points.
Local minimization of Chan-Vese energy is done by gradient descent [8][9]. The gradient descent equation is found with the help of Euler-Lagrange calculus as given in equation (7)
(7)
δ(ϕ) is the delta function which is used to make H_ϕdifferentiable in equation(5). The delta function can be defined as give below in equation (8)
, for 𝜀 >0 (8)
If the background is bright in the image, then the term in equation (7) becomes negative as I approaches and pulls down the functions creating the curve.
3.
RESULTS
The proposed method for extracting tumor in the brain image was implemented in Matlab 2013 with processor speed of 2.6 GHz and 8GB RAM. The time taken for image of 938 x 911 pixels [10] with 300 iterations in level set method for the complete execution of algorithm was 26 seconds which assures the faster execution of the algorithm. However with smaller resolution of input image, the time taken will be less as compared to the result obtained for the above mentioned image [11]. The simulation results obtained at various stage of the algorithm is presented from Fig-3 to Fig-7. The input image containing tumor is shown in Fig-3. The pre-processing section which involves noise removal and skull stripping is shown in Fig-4. The selection of the mask in the image is taken based on the area, shape and the intensity of the selected region as depicted in Fig-5. Fig-6 is the tumor extracted image with contour of the tumor region also extracted. Finally the superimposed image of the tumor and the original image is shown in Fig-7
Fig-6
: Tumor
extracted image
Fig -5:
Selection of
mask containing
tumor region
Fig -4: Filtered and skull stripped image Fig -3: Input image
Fig -7
:Superimposed image of tumor
© 2016, IRJET | Impact Factor value: 4.45 | ISO 9001:2008 Certified Journal
| Page 1973
The amount or the percentage of area covered by thetumor of the overall brain image is calculated using equation (9).
(9)
The area covered by the tumor in the above image is 3.39%. The evaluation of the proposed methodology for tumor extraction in MRI images is performed by using metrics such as sensitivity, specificity and accuracy in terms of TP (True Positive), (TN) True Negative, (FP)False Positive and FN (False Negative) [11].
True Positive (TP): The segmented result is positive in the presence of tumor in the image.
True Negative (TN): The segmented result is negative in the absence of tumor in the image.
False Positive (FP): The segmented result is positive in the absence of the tumor in the image.
False Negative (FN): The segmented result is negative in the presence of tumor in the image.
Sensitivity = TP / (TP + FN) (10) Specificity = TN / (TN + FP) (11) Accuracy = (TP + TN) / (TP+TN+FP+FN) (12)
Sensitivity value signifies the percentage of recognition of positive value or images containing tumor, Sensitivity value signifies the percentage of recognition of negative values or image not containing tumor and accuracy defines the degree of proximity of measured value to its actual value.
The performance of the proposed algorithm was evaluated for data set of 20 images containing images with and without tumor by calculating specificity, sensitivity and accuracy as mentioned in Table.1.
Table-1: Statistical measurements of the proposed algorithm
Sensitivity (%) Specificity (%) Accuracy (%)
100 90 95
The proposed algorithm provides 100% sensitivity and 95% accuracy from which we can conclude that the algorithm is efficient to segment or extract the tumor located region from the image. Also computationally the time taken for the execution of the proposed was less than a minute for high resolution images up to 2048x2048.
4.
CONCLUSION
The tumor extraction helps the experts to determine the degree of aggressiveness of the tumor. The proposed brain
tumor segmentation algorithm gives good results for tumor segmentation as demonstrated in the previous section. But the challenging part is to choose a better mask for the segmentation. As the masked region is accurate better would be the segmentation result. Hence the proposed algorithm can be improved by choosing few more vital parameters for better mask selection. This will be the study for the future research and enhancement of this algorithm
REFERENCES
[1] National Brain Tumor Society, “Brain Tumor Information”, 2016.
[2] American Brain Tumor Association, “Brain Tumor Statistics”, 2016.
[3] Kharrat, Ahmed, et al. "Detection of brain tumor in medical images." Signals, Circuits and Systems (SCS), 2009 3rd International Conference on. IEEE, 2009. [4] Anitha, V., and S. Murugavalli. "Brain tumour
classification using two-tier classifier with adaptive segmentation technique." IET Computer Vision 10.1 (2016): 9-17.
[5] Eswaraiah, R., and E. Sreenivasa Reddy. "ROI-based fragile medical image watermarking technique for tamper detection and recovery using variance." Contemporary Computing (IC3), 2014 Seventh International Conference on. IEEE, 2014.
[6] Chan, Tony, and Luminita Vese. "An active contour model without edges." Scale-Space Theories in Computer Vision. Springer Berlin Heidelberg, 1999. 141-151.
[7] Sun, Jiuyu, Nilanjan Ray, and Hong Zhang. "VFCCV snake: A novel active contour model combining edge and regional information." Image Processing (ICIP), 2014 IEEE International Conference on. IEEE, 2014.
[8] Caselles, Vicent, Ron Kimmel, and Guillermo Sapiro. "Geodesic active contours." International journal of computer vision 22.1 (1997): 61-79.
[9] Dietenbeck, Thomas, et al. "A level-set approach for tracking objects in image sequences using a level conservation constraint: Application to cardiac sequences." Image Processing (ICIP), 2014 IEEE International Conference on. IEEE, 2014.
[10] Magnetic Resonance Technology Information Portal, “MRI Images.” ,2016.
[11] Amin, Asjad, and Mohamed Deriche. "Robust image segmentation based on convex active contours and the Chan Vese model." Signal and Information Processing (GlobalSIP), 2014 IEEE Global Conference on. IEEE, 2014.
[12] Wang, Zhou, et al. "Image quality assessment: from error visibility to structural similarity." Image Processing, IEEE Transactions on 13.4 (2004): 600-612.
[13] Dang, Hongshe, et al. "Initial contour automatic selection of geometric active contour model." Intelligent Computation Technology and Automation, 2009. ICICTA'09. Second International Conference on. Vol. 2. IEEE, 2009.
© 2016, IRJET | Impact Factor value: 4.45 | ISO 9001:2008 Certified Journal
| Page 1974
Automatic Control and Artificial Intelligence (ACAI2012), International Conference on. IET, 2012. [15] Mumford, David, and Jayant Shah. "Optimal