© 2016, IRJET | Impact Factor value: 4.45 | ISO 9001:2008 Certified Journal | Page 1017
Virtual Durability Simulation for Chassis of Commercial vehicle
Mahendra A Petale
M E (Mechanical Engineering) G S Moze College of Engineering Balewadi Pune -4111025
Prof. Manoj J Sature
Asst. Professor G S Moze College of Engineering, Balewadi Pune, India - 411 045
---***---Abstract
– In conventional virtual validation byComputer Aided Design of truck chassis was based on the static analysis based. Load cases derived was by Experience. This led to some of the critical areas being unnoticed. Hence, it was necessary to rely on physical testing for the validation of the design, which is costly and time consuming. In order to fast track the development & cut short the validation time and cost , validation of new product or design a technique is required that depends on virtual prototype testing at the design stage of development. The use of multi body dynamics and finite element method makes this task simple and accurate taking into account the road load data ( RLD ) stress history and multi axial stress field, thus making the durability predictions more accurate. In this paper Virtual validation Methodology using RLD approach for a typical heavy truck Chassis is presented with good correlation with Physical validation reducing overall design and development cost and time to deliver first time right product.
Key words—RLDA , CAE, MBD, Rig Testing, Fatigue life, Design optimisation
1.
INTRODUCTION
In the past, the CAE validation of truck cabin and chassis was based on the conventional static analysis based on the load cases derived by experience. This led to some of the critical areas being unnoticed. Hence, it was necessary to rely on physical testing for the validation of the design.
The physical prototype testing is a time and cost consuming activity. In order to reduce the development period, development cost and number of prototypes, a technique is required that depends on virtual prototype testing at the design stage of development. Thanks to recent improvements in computer performance and the availability of the commercial finite element & fatigue softwares. Using these commercially availably codes , engineers can conduct fatigue analysis that take into account the road load data ( RLD ) stress history and multi axial stress field, thus making the durability predictions more accurate.
The accelerated testing is done on a multi poster test rigs on cab and chassis separately. The acceleration history to the multi-poster test rigs is derived from proving ground (torture track) history. The truck cabin is fitted on part of chassis frame along with its suspension for testing.
Similarly, the chassis is suspended at its front and rear suspension area. In order to predict the durability by fatigue analysis, the multi axial stress fields are required for the entire load history. The use of multi body dynamics and finite element method makes this task simple and accurate.
The case study of a typical heavy truck (both chassis & cabin) is presented with detailed simulation procedure.
2.
MULTI
POSTER
DURABILITY
TESTING
&
SIMULATION
The fatigue strength of Frame is generally assessed
through the proving ground (torture track) testing
and accelerated tests like four-poster testing. In a
four-poster test, the displacement history of the four
hydraulic shakers is first determined using the frame
accelerations determined from the experimental
rough road driving, and input accelerations
experienced by an actual vehicle in field. In multi
poster test, the load history is reduced by reducing
non damaging events in order to shorten the test
time. This is done through the damage correlation
between the rough road driving, torture track
test-driving & multi poster test. The typical multi poster
test setups are shown in Fig. 1 and 2
Chassis Fatigue Testing is accelerated test procedure
similar to 4-poster test, which is used for chassis
durability. In this testing along with Z-direction road
inputs, X and Y (Longitudinal and Lateral) direction
inputs, braking torque loads are considered. In case
of chassis, the Longitudinal and lateral forces are
significant in addition to Z forces. A 22-poster test
rig used for 6 x 4 tractor – 49T Tractor
- all direction road excitations
- braking effects
- Cabin and engine excitations to Chassis.
© 2016, IRJET | Impact Factor value: 4.45 | ISO 9001:2008 Certified Journal | Page 1018
Fig 1- Typical Multi Poster set up
[image:2.595.323.557.118.317.2]Fig 2- Multi Poster Test Rig for Frame
[image:2.595.53.283.348.483.2]Fig 3- Fifth Wheel constraint arrangement
The cabin weight, Powertrain weight, fifth wheel loads are applied by actuators with suitable fixtures. The effect of above aggregates in vehicle running condition is simulated. Refer fig. 2 &3Fig 4 –Power Train arrangement
Methodology adopted
Review present conentional system of design optimisation
Identify the aggregates requiring optimisation
Build initial 3 D CAD model of the vehicle aggregates in Pro-e or CATIA software
Do initial Finite Element analysis for the built CAD model with analyiss softwares like hypermesh , NASTRAN
Find out the critical zones or areas related to maximum stress / deflection in order to decide intrumentation points on the physical parts
Identify the referance vehicle model for intrumentation and capturing road load data
Identify the service routes where new model will be subjected to usage for desired target life of product
Intrument the referance vehicle at various locations as identified in the earlier step with the help of various devices like strain gauging , LVDT, WFT, Accelerometer, RPM meter, Rosette as the requirment of capturing output like strain , displacment , Forces along XYZ, Moments about XYZ for damage analysis, damage edit and control
Do physical running of the instrumented vehicle on identified with the desired payload and application speed , grade and acceleration
Data acquisition by use of data acquisition system like eDAQ plus (SOMAT) which is
having
64 Channel analog, 500 Hz sampling rate , GPS channels , Digital inputs [image:2.595.50.283.530.692.2]© 2016, IRJET | Impact Factor value: 4.45 | ISO 9001:2008 Certified Journal | Page 1019
software like ICE-flo GlyphWorks, Plottingamplitude time history , rainflow analysis with respect to number of cycles and rainflow change histogram
Development of correlation with service usage and proven ground (torture track) in order to decide number of cycles for service life usage , Signal processing and damage edit , drive file generation
Kinematic model building in ADAMS based on drive file and extraction of forces
Durability analysis (Virtual simulation) of the 3D CAD model Fatigue calculation software like FEMFAT, Design Optimisation using optistruck & Hyperstudy
Below are below two major steps followed
2.1 Transformation of rig test signals to
load time histories at chassis attachment
points through ADAMS
On- road / torture track testing of vehicle for predefined cycles is the general way to evaluate durability of frame mountings. Performing on-road testing, as number of vehicle variants increases, is time consuming and costly affair. Hence, with the objective to perform vehicle frame durability evaluation at laboratory level and to accelerate testing activity, this full Frame fatigue test evaluation has been planned. Drive files for the rig using the strain, LVDT and WFT data is collected by instrumenting reference vehicle and running on service road.
[image:3.595.307.558.60.258.2]Frame Fatigue analysis test rig set up there is actuators (J1 to J19) are used for giving axle vertical motion, axle longitudinal force, axle lateral force and cab vertical force input. One end of all above-mentioned actuators is connected to rigid structure. Two rubber bush are provide between frame and fifth wheel assembly. Axles are excited through adapter assembly, which are fixed together.
Fig 4 – Frame Fatigue test ADAMS Model
The test activity is performed in the virtual world
through simulations using ADAMS and Nastran, FE
fatigue. Equivalent ADAMS model is made
replicates test setup. This ADAMS multi body
simulation is performed giving the displacement
input drive file at the four-poster leg locations. The
multi body dynamic analysis output is the force
history at all the mounting locations on the cab.
Dynamics analysis is performed to get the load
history at various front and rear suspension mount
locations.
The attachment point load time histories calculated through ADAMS are then used to calculate fatigue life. These time histories is taken as input for durability simulation
2.2 Durability simulation for fatigue life
simulation
Fig 5 & 6 shows the flowchart of simulation method
used for the prediction of fatigue strength of frame.
This method makes use of various CAE solvers like
MSC-ADAMS, MSC-NASTRAN & MSC-FATIGUE. The
brief description of the process is as given below.
First, a finite element model of the Chassis is created
using CAD data and then an eigen value analysis is
performed using NASTRAN. The results of the eigen
value analysis are then converted into an ADAMS’s
modal model using ADAMS/FLEX.
© 2016, IRJET | Impact Factor value: 4.45 | ISO 9001:2008 Certified Journal | Page 1020
leg locations. The multi body dynamic analysis
[image:4.595.37.281.212.442.2]output is the force history at all the mounting
locations on the cab. This history is then combined
with the NASTRAN’s static unit load inertia relief
analysis results to obtain a stress history in the cabin
for the entire multi poster cycle using linear
superposition method.
[image:4.595.307.546.221.408.2]Fig 5 –Chassis Simulation process flowchart
Fig 6 –Fatigue analysis process in MSc Fatigue
This process of linear superposition method
followed by rain flow cycle counting & finding the
cumulative damage by Miner’s rule & finally arriving
at fatigue life of cabin is performed in MSC-FATIGUE.
Refer fig.6 for the schematic model of the analysis
process.
[image:4.595.46.419.495.718.2]Fig 7- Rear Cross member Gusset Location
Fig 8- Engine Mounting cross member location
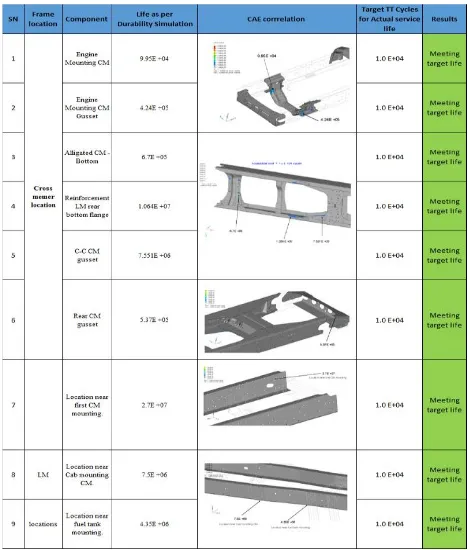
[image:4.595.307.556.496.678.2]© 2016, IRJET | Impact Factor value: 4.45 | ISO 9001:2008 Certified Journal | Page 1021
that Chassis is meeting target fatigue life cycles as
required
TABLE 1 (Durability Simulation Result Summary)
3
CONCLUSION
This virtual simulation methodology for durability
life prediction can be effectively used at the design
stage for evaluating the fatigue durability chassis for
eliminating expensive physical prototype testing. A
virtual simulation methodology was developed for
finding out the vehicle durability, which has a
correlation with physical testing in terms of the
sequence of failure and locations, and number of
cycles. This simulation methodology makes use of
input test data, multi-body dynamics & finite
element method. This methodology eliminates the
use of static assumed service load cases, which do
not represent the full duty cycle to which the vehicle
will be subjected. This is very effective simulation
tool which can be used during design and
development of new products reducing overall
development time and cost of Design iteration and
physical validation.
ACKNOWLEDGMENT
I would like to express my special thanks of
gratitude to my superiors who gave this golden
opportunity to do this wonderful project which also
helped me in doing lot of Research and I came to
know about so many new things. I am really thankful
to them. Secondly I would also like to thank my
family and Friends who helped to complete this
project in limited time period.
REFERENCES
[1] Automotive Structures". SAE Technical Paper 950711, 1995.
[2] MSC/PATRAN User's Manual, 2005, The MacNeal Schwendler Corporation, Los Angeles, CA, March 2005
[3] Morrow, J. D. Fatigue Design Handbook, Section 3.2, SAE Advances in Engineering, Vol. 4,
[4] Society for Automotive Engineers, Warrendale, PA, 1968, pp. 21–29.
[5]Alex Porter “Accelerated testing and validation”