© 2016, IRJET ISO 9001:2008 Certified Journal Page 454
ENHANCED AND EFFICIENT IMAGE RETRIEVAL VIA VISUAL
ATTENTION AND SALIENCY FEATURES
Nage Bhagyashri Sudhakar
1, Pawade Pritam Dilip
2, Gholap Pooja Shivaji
3,
Kharde Gayatri Sunil
4, Nirmal M. D.
51
Student, Dept. of Computer Engineering, PREC, Loni, Maharashtra, India
2Student, Dept. of Computer Engineering, PREC, Loni, Maharashtra, India
3Student, Dept. of Computer Engineering, PREC, Loni, Maharashtra, India
4Student, Dept. of Computer Engineering, PREC, Loni, Maharashtra, India
5Professor, Dept. of Computer Engineering, PREC, Loni, Maharashtra, India---***---Abstract -
With the fast development of Internet and multimedia technology, users continuously produce partial-duplicate images for images sending, information transform, and so forth. In partial duplicate images there are only some parts of the whole images, and the transformations like scale, viewpoint, illumination, and resolution. (Figure 1 shows some typical examples of partial-duplicate images.) Because of transformation, complication and challenges of retrieval of task increased. The attraction of research attention increased because of rapidly demanded real world applications of partial duplicate image retrieval. The research attentions like duplicate image identification, security to the copied images or also the searching landmark. The partial-duplicate image-retrieval problem is nothing but object-based image image-retrieval. In some methods like traditional object-based image-retrieval, it considers the whole image as a query image. In traditional method it also uses bag-of-visual-words (BOV) model 1.2 for analysis of text retrieval system.
This method is not sutable for the noise which is created at the background. This is why, in retrieval stage there is no such information with respect to visual words. There are different ways given by the researchers to find solution to this difficulties, some solutions are:
1. More discriminative descriptions are produced from local descriptors.
2. By considering the local features the weak geometric constraints are created on the global image representation. 3. By user interaction retrieval of a user-interest region are done.
Newly developed technologies are efficient over the traditional images retrieval with some limitations. The duplicate regions are so small, so that extraction of only a bit of the feature in the images so only consistency constraint construction is not effective dealing with the partial-duplicate image retrieval, this is the second limitation. And the last one is nothing but there are millions of images in large-scale datasets so to perform the same operation or the interaction is not a simple task. The current technologies are not performing satisfied partial duplicate image retrieval because of these limitations. But they provide the image retrieval with the
removal of the background noise of the query image. We always take care that constraint should not minimizes the efficiency of the retrieval
Key Words: Bag-of-visual-words (BOV) model, Image
retrieval, Index structure, visually salient and rich regions (VSRR).
1. INTRODUCTION -
We know that a bag of visual words is nothing but the image which is stated in the state-of-the-art image retrieval systems, and this image is obtained by quantized descriptors of high-dimensional local image. From the scalable schemes of text retrieval the indexing and retrieval of image for large scale is done. The discriminative power of image features due to feature quantization is minimized by BOV. There is some relationship between the visual words so some relationships are avoided. For displaying the different objects or regions of images user transfer images through internet. When we get return result of those images then we expect maximum focus on this region while retrieving the partial duplicate. After getting some similar regions then sometimes they are not in non-salient regions which we use for retrieval, this one of the user challenge. Second is nothing but the returned retrieval image maker should be salient, of the similar regions for increasing the experiences of the user.
© 2016, IRJET ISO 9001:2008 Certified Journal Page 455
Figure 1.1: Example of Duplicate web images
[image:2.595.310.556.319.426.2]We introduced the concept of partial duplicate image retrieval scheme which is depend on saliency-guided visual matching. Also at the same time of process we localized the duplicates. We can see flow of this scheme in figure 2. We are going to represent the visually salient and rich regions (VSRR) as the unit of retrieval.
In this scheme the BOV model is used to represent the VSRR. To improve efficiency of our partial duplicate image retrieval scheme we examined five datasets.
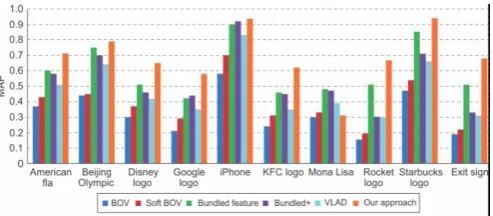
Figure 2: Comparison of five approaches with the mean average precision (MAP) for partial-duplicate Image
retrieval
2. LITERATURE
SURVEY-To evaluate our system, we compared our method with the state-of-the-art approaches on five image datasets:
The Public Internet Partial-Duplicate (PDID) image dataset consists of 10 image collections and 30,000 distractors. 1 each collection has 200 images. The Large-Scale Partial-Duplicate (PDID1M) image
dataset consists of the PDID dataset and 1 million distracter images from Flickr. The UKbench dataset consists of 2,550 groups of four images each. The Mobile dataset includes images of 300 objects,
and it indexes 300 images of the digital copies
downloaded from the Internet, blended by the 10,200 images from the UKbench as distracters. The Caltech256 (50) dataset is a subset of
Caltech256 that consists of 50 classical object categories with 4,988 images.
We use the evaluation metric this metric is the mean average precision (MAP) which is used to evaluate the PDID, PDID1M, and Caltech256 datasets which we used in our scheme. We calculate the average precision (AP) of our query image. If we compare the performance measurement of the UKbench dataset and Mobile dataset then there is difference. In UKbench dataset we consider top-four retrieved images among the queries and in Mobile dataset top-ten hit rates.
Partial duplicate image retrieval architecture:
Step of partial duplicate image retrieval:
1. Query Image 2. Extract Features 3. Image Database 4. Feature Database 5. Similarity Measure 6. Feedback Algorithm 7. Final Matched Result
[image:2.595.38.285.430.538.2]© 2016, IRJET ISO 9001:2008 Certified Journal Page 456 The entire set of descriptors extracted from the
image database. This cluster is divided into two sub-clusters using the hierarchical clustering algorithm PDDP. Each of the two sub clusters is divided into two partitions recursively and arranged into binary tree. Descriptors of each obtained sub-clusters are gathered by hyper-rectangles directed according to the main leading principal component to ensure the non-overlapping between the two bounding forms.
3. ALGORITHM-
K-NN Search (K Nearest Neighbour’s search) -
4. WORKING-
4.1 Generating VSRRs
The retrieval unit in partial-duplicate image retrieval is nothing but VSRRs. The VSRR is the combination of rich visual content and visual saliency. There are different phases of VSRR process first is construction of perceptive unit. After development of perceptive unit the saliency map is generated then the original VSRR is constructed and the last step is selection of ultimate VSRR. At the last final stage the set of VSRRs is generated by decomposing the image.
4.2 Saliency map generation
In most of the cases the human attention is attracted by the images which have the strong contrast according to their surroundings.
The contrast, spatial regions also play an important role in visual attention. The highly contrasts region with its near regions usually has a more powerful effect for its saliency than one with a high contrast with its farther regions. Depend on unit of perceptive, we calculate the saliency map by incorporating spatial relationship with the highly contrast regions. This approach is the bottom-up saliency-detection strategy. The object is separated from its background. The case in which the color histogram for each perceptive unit is first built in the L*a*b* color space. By measuring its color contrast while considering other perceptive units in image the saliency value is calculated. We can maximize the effects of nearest regions and also minimizes the effect of for regions.
4.3 VSRR generation
The next step after generation of the saliency map, we compute the saliency regions by saliency segmentation and then by filtering the regions with inferior saliency we can obtain the original VSRRs. Finally, we select the ultimate VSRRs that contain abundant visual content. We divide the saliency map into background and initial saliency regions by conducting binarization the saliency map using a fixed threshold. Then, we iteratively apply Grabcut11 to refine the segmentation outcomes. The initial saliency regions are used to direct initialize Grab cut. Once initialized, Grab cut is iteratively performed to improve the saliency cut result until the region is convergent. Finally, a set of regions are obtained, which are regarded as the original VSRRs.
4.4 Relative Saliency Ordering Constraint
© 2016, IRJET ISO 9001:2008 Certified Journal Page 457 SRM is defined by comparing the saliency values αi and αj of
visual word v i and vj in one VSRR. Each visual word in the VSRR is compared with other visual words. The SRM is an antisymmetric Boolean matrix that preserves the relative saliency order among visual words.
Figure: Proposed partial-duplicate image-retrieval scheme.)
5. FEATURE
EXTRACTION-In CBIR, each image that is stored in the database has its features extracted such as color, texture, shape and compared to the features of the query image.
Some Feature Extraction techniques are – 1. Color Feature Extraction
2. Texture Feature Extraction 3. Shape Feature Extraction
5.1 Color Feature Extraction
DCT Coefficient Transformation
The Discrete cosine transform is a very fast transform. It has efficient compaction for highly correlated data. By using DCT, it minimizes the number of bits required to represent the information in an image, by removing the replication between neighboring pixel values.
Where,
- u is the horizontal spatial frequency, - v is the vertical spatial frequency,
- f(x, y) is the pixel value at coordinates (x, y), - C(u, v) is the DCT coefficient at coordinates (u, v).
YcbCr represents color as bright and difference between two color signals. In YCbCr, the Y is the brightness (luma), Cb is blue minus luma (B-Y) and Cr is red minus luma (R-Y). The transformation of RGB to YCbCr color model can be derived as a linear transformation
Y = 0.299R + 0.587G + 0.114B Cb = -0.1687R - 0.3313G + 0.5B Cr = 0.5R - 0.4187G - 0.0813B
In order to reduce the computational performance load and it decouples intensity and color information this conversion is carried out. DCT transformed image is quantized by lowering the high frequency pixels simply by dividing it by a constant quantization matrix and then making round of it. A lot of the values will become very small. Every quantized DCT coefficients are stored in an array of feature vector.
5.2 Texture Feature Extraction
The images are segmented, into sub image. Each sub image is transformed using a 2D-DFT transformation. After Discrete Coefficient Transformation only coefficient matrices with magnitude are used for texture characterization. All the 128x128-pixel sub images obtained from image partition are transformed via a 2D-DFT according to equation.
Where,
- u is the horizontal spatial frequency, - v is the vertical spatial frequency,
- f(x, y) is the pixel value at coordinates (x, y), - (u, v) is the DCT coefficient at coordinates (u, v).
5.3 Shape Feature Extraction
Shape representations can be generally divided into two categories:
5.3.1 Boundary based 5.3.2 Region based
© 2016, IRJET ISO 9001:2008 Certified Journal Page 458
Boundary Based Region based
6. INDEXING-
Indexing is sorting based on the value given to the image after finding the similar values of each images. It is used to give acceleration to the query performance in the search method and plays a leading role in supporting effective and efficient retrieval of sequences of image. Indexing makes the search process easy and efficient.
6.1 Indexing using Hierarchical Grid Based Technique:
In this method the image is converted into the YUV color space and the feature vector derived from the DCT coefficients through vector quantization, each image corresponds to a grid code and visually similar patterns.
6.2 Indexing techniques:
The data-partitioning The space-partitioning
When the nearest neighbors search is applied on a data partitioning index, additional other clusters are visited due to the overlapping between the bounding forms. By using NOHIS (Non Overlapping Hierarchical Index Structure) tree the overlapping is avoided and the quality of clusters is maintained.
6.3 Indexing using NOHIS tree:
The complete set of descriptors extracted from the image dataset. This cluster is segmented into two sub-clusters by making use of the hierarchical clustering algorithm PDDP.
Each of the two sub clusters is divided into two partitions recursively and arranged into binary tree. Descriptors of each gained sub-clusters are collected by hyper-rectangles directed according to the main principal component to ensure the non-overlapping between the two bounding forms.
7. FUTURE WORK:
For future work of this project we believe that investigating more sophisticated techniques for image retrieval, including robust color or structure distance measures, will be very beneficial. Mostly our proposed
filter-based formulation is very efficient to serve as an expendable platform. In the upcoming future, we plan to research not only visual attention analysis but also visual content analysis and develop a practical partial-duplicate image retrieval system.
8. CONCLUSION-
We have presented the global contrast based saliency computation methods, namely Histogram based Contrast (HC) and spatial information-enhanced Region based Contrast (RC).The HC method is very fast and generates results with fine details in efficient manner, the RC method generates spatially consistent high quality saliency maps at the cost of reduced computational efficiency. We have evaluated our methods on the largest publicly available dataset and compared our scheme with eight other state-of-the-art methods. We presented Saliency Filters, a method for saliency computation based on an image abstraction into structural representative elements and contrast-based saliency measures, which can be consistently formulated as high dimensional Gaussian filters. Our filter-based formulation allows for efficient computation and produces per-pixel saliency maps, with the available best performance in a ground truth comparison to various state-of-the-art works.
9.
REFERENCES-[1] Z. Wu et al., Adding Affine Invariant Geometric Constraint for Partial-Duplicate Image Retrieval, Proc. 20th IEEE Conf. Pattern Recognition (ICPR), IEEE CS, 2010, pp. 842-845.
[2] J. Sivic and A. Zisserman, Video Google: A Text Retrieval Approach to Object Matching in Videos, Proc. 2003 IEEE Conf. Computer Vision (ICCV), vol. 2, IEEE CS, 2003, pp. 1470-1477.
[3] H. Jegou et al., Aggregating Local Descriptors into a Compact Image Representation, Proc. 2010 IEEE Conf. Computer Vision and Pattern Recognition (CVPR), IEEE CS, 2010, pp. 3304-3331.
[4] F. Perronnin et al., Large-Scale Image Retrieval with Compressed Fisher Vectors, Proc. 2010 IEEE Conf. Computer Vision and Pattern Recognition (CVPR), IEEE CS, 2010, pp. 3384-3391.
[5] W. Zhou et al., Spatial Coding for Large Scale Partial-Duplicate Web Image Search, Proc. Intl Conf. Multimedia, ACM, 2010, pp. 510-520.
© 2016, IRJET ISO 9001:2008 Certified Journal Page 459 [7] J. Philbin et al., Lost in Quantization: Improving Particular
Object Retrieval in Large Scale Image Databases, Proc. IEEE Conf. Computer Vision and Pattern Recognition (CVPR 08), IEEE CS, 2008.
[8] M. Chen et al., Global Contrast Based Salient Region Detection, Proc. 2011 IEEE Conf. Computer Vision and Pattern Recognition (CVPR), IEEE CS, 2011, pp. 409-416. 35
[9] H. Wu et al., Resizing by Symmetry-Summarization, ACM Trans. Graphics, vol.29, no. 6, 2010, article no. 159.
[10] P. Felzenszwalb and D. Huttenlocher, Efficient Graph-Based Image Segmentation, Intl J. Computer Vision, vol. 59, no. 2, 2004, pp. 197-181.
[11] C. Rother, V. Kolmogorov, and A. Blake, Grab cut: Interactive Foreground Extraction Using Iterated Graph Cuts, ACM Trans. Graphics, vol. 23, no. 3, 2004
[12] D.G. Lowe, “Distinctive Image Features from Scale Invariant Key-points" Computer Vision,vol.60,no. 2, 2004,pp. 91-110.
[13] X. Wang et al., “Contextual Weighting for Vocabulary Tree Based Image Retrieval,” Proc. 2011, IEEE Conf. Computer Vision (ICCV), IEEE CS, 2011, pp. 209-216.