ISSN 2250-3153
Internet of Things (IoT) Communication for Refuse
Monitoring System
*Ifeoma B. Asianuba, Eneh Daniel Aniete
Department of Electrical/Electronic Engineering, University of Port Harcourt, Choba, Nigeria *ifeomaasianuba@gmail.com
DOI: 10.29322/IJSRP.9.08.2019.p9249 http://dx.doi.org/10.29322/IJSRP.9.08.2019.p9249
ABSTRACT: Increase in population around the globe today has brought about significant increase in the amount of waste generated. In other words, detection, monitoring and management of waste have become a challenge in developing countries. Due to the indiscriminate disposal of solid waste at dump sites and the environmental pollution posed by this activity, this paper proffers a solution to tackle this menace. The solution adopts an innovative approach by the application of Internet of Things (IoT) to implement a smart refuse (garbage) monitoring system. This application will tackle challenges of untimely and inefficient waste management by designated agencies. To achieve this work, ultrasonic sensors were used to detect instantaneous level of waste in trash bin at various dump sites. These sensors give feedback via a Wi-Fi module to the web application of the waste management authorities for consistent monitoring thereby curbing the over flow of refuse dumps at sites. A significant contribution in this work involves the use of an interlock mechanism that will not allow further dumping of waste once the trash bin is full. Implementing this application using a Wi-Fi module is cost effective, readily accessible, reliable and an efficient approach. This system when implemented will ensure a cleaner and healthier environment with human computer interface communication system.
Keywords: Internet of things, wireless network, sensors, microcontrollers.
I INTRODUCTION
Due to the rate of population growth, garbage management has become a global issue. Inadequate and untimely information on the
conditions and state of dump sites has led to the menace of overflowing garbage bins located at strategic positions (Kanchan and
Chitode 2014). This poor situation ought to be alleviated by the government and concerned authorities by implementing viable and
feasible methods to overcome this challenges. This work therefore explores options, strategies, and practical way to tackle this issue.
Internet and its applications have become a fundamental and essential part of everyday life. Due to the tremendous demand in
innovative ideas, researchers have gone beyond connecting just computers into the web. Internet communication over the years has
widely grown from user-to-user interaction to device-to-device interactions. The IoT concepts were proposed few years back but can
be applied to provide an effective and reliable platform for smart garbage management system. Some of the commonly used methods
were implemented using sensors and microcontrollers. The details of each bin are monitored by the waste management authority with
the help of Graphic user Interface (GUI). The implementation of smart garbage management system using sensors, microcontrollers
and WI-FI module ensures waste bins are clean as soon as the garbage level reaches its maximum. If the dustbin is not cleaned in
specific time, then the details is sent to the higher authority to take appropriate action against the designated contractor. This system
also helps to monitor falsified reports about the condition of dump sites and reduce incessant trips by garbage collection vehicles.
Implementing this scheme will help to reduce cost of waste collection and ultimately help to maintain a healthy and clean
environment.
Vikrant et al, Narayan et al and Sinha et al 2015 proposed a smart garbage management system for smart cities. In the work, the level
of garbage is detected with ultrasonic sensors and communicated to the authorized control room using a GSM module. A GUI was
also developed to monitor the desired information related to the garbage for different selected locations. A major drawback of this
system lies on the fact that it was powered with DC supply only, requiring recharging of batteries on a timely basis.
In Navghane et al 2016, a dustbin was interfaced with microcontroller based system having IR wireless systems along with central
system showing current status of garbage. This was actualized on mobile web browser with html page by Wi-Fi, Such that the
information on the status of the bin will be updated on to the html page using a Wi-Fi module. But weight sensors were used to detect
the amount of garbage rather the level of garbage in dustbin. Such information can be misleading as the weight may at times not
imply that the waste in the bin has reached full capacity.
Shaficul et al 2012 provided an overview on solid waste monitoring system. Guerrero et al 2014 presented an extensive survey on the
challenges associated with collection and control of waste in developing countries between 2005 to 2011. The models in the survey
were tested on real time data. The outcome presented systemic approach for solid waste collection in developing countries. Although
IoT based approaches were not considered at this time. But advanced scheduling and routing via exploiting modern ICT algorithms
were considered. In Alexey et al 2014, a novel cloud based system was presented for data sharing and dynamic route optimization for
waste management in inaccessible areas. The goal was to provide software as a service (SaaS) for customers and develop a beneficial
communication between all stakeholders in the waste management system.
In Meghana and Nataraj 2015, a multipurpose infrared sensor was used to detect the level of garbage in a dump site. The sensors
sense and carry signals which are distinguished by their connector names. The GUI gives the output level of the garbage, location,
date and time the bin got filled. A major drawback of this system is that the latter does not ensure whether garbage is cleaned up or
not.
In Mustafa and Ku Azir 2017, an IoT device which uses yet an arm controller together with ultrasonic sensors to detect the level of
garbage was implemented. In Alice et al, the weight and toxic condition of the waste inside the bin was used to ascertain if the bin is
due for discard by the concerned agencies. In Asima and Sumanth 2017, Zig bee approach was sought to implement the transfer of
information of the bin through a mesh network. This approach suffered the limitation of low data rate applications however,
Information concerning the status of the bin can be obtained anywhere in real time. In Akash et al, apart from the monitoring and
detecting features of the garbage bin, additional feature like fire sensors was added to the device to detect fire outburst as a result of
waste reaction within the bin. This work is therefore geared towards solving the problem of spillage of waste in refuse dump by
adopting an interlock mechanism that will prevent further dump of refuse in the dumpsite as well as giving information to the relevant
authorities on the condition of the site.
III METHODOLOGY
Power Supply Unit
Input Unit (Ultrasonic Module)
Control Unit
Microcontroller
ISSN 2250-3153
Figure 1: Block Diagram of the circuit component of the IoT based garbage monitoring system.
The circuit is divided into four sections; each section performs a specific task. The block diagram in figure 1 shows the basic parts of
the circuit components.
The input unit is made of the ultrasonic module with the control unit made up of the ATMEGA328 controller. The controller has a
memory space of 2 kilobyte RAMand 32 kilobyte ROM. The controller uses operating voltage of 5-volt dc. The output unit is made
up of the light emitting diode, the liquid crystal display and the WIFI module (ESP8266).
The input unit consists of two HC-SR04 ultrasonic (sensor) modules which fetches the depth of the container (trash bin). It is a four
terminal device with pins: Vcc, Gnd, Echo and trigger. The Vcc and the Gnd pin-outs are connected to the 5V and the Gnd of the
voltage regulator respectively. The ultrasonic sensor uses the two fundamental pins: Trigger and Echo, which are used for calculating
the level of the waste in the bin by generating sound waves and thus calculating the time duration of the echo. The Ultrasonic Sensor
sends out a high-frequency sound pulse and then determines how long it takes for the echo of the sound to reflect. The sensor has 2
openings on its front. One opening transmits ultrasonic waves, (like a tiny speaker), the other receives them, (like a tiny
microphone).The ultrasonic sensor uses this information along with the time difference between sending and receiving the sound
pulse to determine the distance to an object.
The trigger pin is used to send a sound wave; this is triggered by sending a 10µs signal to the trigger terminal from the unit. The
sound is reflected from the intruder body. The depth of the trash bin from the device is measured by the duration of the signal times
the velocity of sound wave. The duration of high level as received by the control unit is at the echo terminal connected to the control
unit.
The ARDUINO ATMEGA328 microcontroller gets information from sensors and processes it. The microcontroller further compares
the received data with the threshold level set to generate the required outputThe Atmega328 microcontroller pin-outs are connected to
the ultrasonic module, the led indicator, ESP8266 and the liquid crystal display. It receives signal from the input unit and sends it to
the output unit. The sensor signal is sent to the control unit where calibration is done and the information displayed on the LCD.Pin 2
to 4 of the controller (U4) is connected to the ultrasonic module, the ultrasonic module measures the depth of the container and sends
the signal to the microcontroller, the program written is used in calibrating the depth of the container. The controller sends data to the
The Atmega328 has an on-chip oscillator that requires an external clock to run it. Therefore, a quartz crystal oscillator (X1) is
connected to pin 9 and pin 10 of the Atmega328 controller (U5). The crystal is used to control the processing speed of the
microcontroller. The speed of the microcontroller refers to the maximum oscillator frequency connected to the crystal pins. The
ESP8266 module is connected to the pin 15 and 16 of the control unit. The microcontroller communicates with the ESP8266 via the
use of its serial port. The microcontroller and the WIFI (ESP8266) module communicate with the baud rate of transmission (9600 bits
per second).
The output unit consist the LCD, LED indicator and the WIFI module (ESP8266).The WI-FI modem has a powerful on-board
processing ability with storage capability that allows it to be integrated with the sensors and other devices. The ESP8266 has
self-calibrated Radio frequency which allows it function effectively under all operating conditions. The WIFI module is used to transfer
the data (level of dirt in the trash bin) to a web app, to notify the authorities in charge of cleaning the dirt, about the level of dirt in the
bin. The LED indicator is arrayed in four steps, step 1; indicates that the trash can is empty, step 2; indicates the trash can is 25
ISSN 2250-3153
Figure 2: Circuit diagram of the IoT based garbage monitoring system
SYSTEM ALGORITHM
Step 1: Start Process.
Step 2: Initialize the System
Step 3: Check for the level of dirty in trash can.
Step 4: Check if level of trash can is empty, 25%, 50%, or full
Step 5: If step 3 is untrue go back to step 2
Step 7: Send the level of Trash to web page.
Step 8: Repeat process by going to step 3.
Step 9: Stop process.
[image:6.612.59.436.132.697.2]
Figure 3: Flow chart showing the step-wise operation of the IoT based refuse system START
j INITALIZE THE SYSTEM
j CHECK LEVEL OF DIRTY
TRASH
IS LEVEL 0%, 25%, 50% OR
100%?
j LCD DISPLAYS LEVEL
j SEND LEVEL OF TRASH TO WEB PAGE
STOP NO
ISSN 2250-3153
IV RESULTS/DISCUSSION
Some part of the circuit diagram was simulated in the integrated environment called Proteus version 8.6 Professional. This was done
to ascertain the fact that the circuit is realizable. The ultrasonic sensor senses and receives the signal which is displayed on the LCD
[image:7.612.99.513.188.306.2]including the garbage level indication on the bin.
Table 1: Signal Voltage during Reception, indicating the bin capacity and the corresponding display level.
Garbage bin Action
Container is empty Liquid crystal display shows Level 1.
Container is 25% full Display shows Level 2.
Container is 50% full Display shows Level 3
Container 100% full Display shows Level 4.
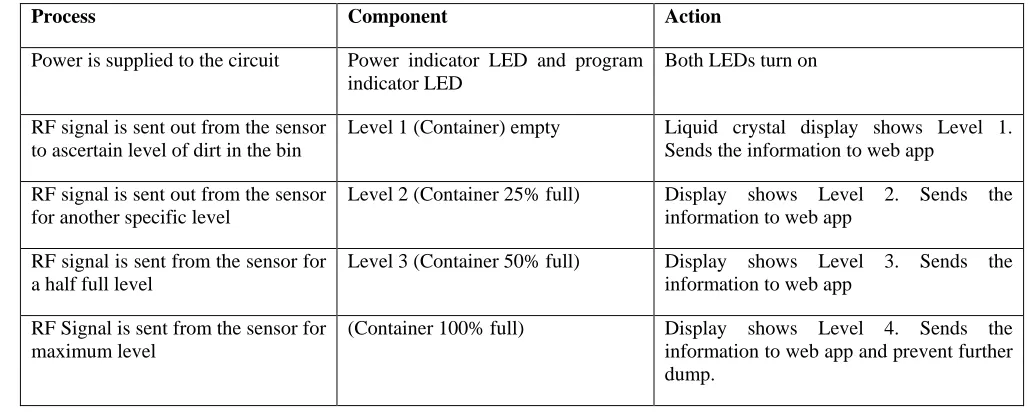
Table 2: Results obtained on testing the Circuit
Process Component Action
Power is supplied to the circuit Power indicator LED and program
indicator LED
Both LEDs turn on
RF signal is sent out from the sensor to ascertain level of dirt in the bin
Level 1 (Container) empty Liquid crystal display shows Level 1.
Sends the information to web app
RF signal is sent out from the sensor for another specific level
Level 2 (Container 25% full) Display shows Level 2. Sends the
information to web app
RF signal is sent from the sensor for a half full level
Level 3 (Container 50% full) Display shows Level 3. Sends the
information to web app
RF Signal is sent from the sensor for maximum level
(Container 100% full) Display shows Level 4. Sends the
information to web app and prevent further dump.
5.0 CONCLUSION
The design and implementation of the ARDUINO based internet of things (IoT) Refuse monitoring system was achieved and its
performance met expectation. The circuit was able to detect the level of garbage and transmit information concerning the state of the
system using WIFI module to a web app. The liquid crystal display helped to visualize the state of the system. The state and condition
of the site can be viewed on the web app from any internet enabled device.
The system when implemented will prevent environmental pollution. Other advantages of the system include the fact that; it involves
[image:7.612.45.559.369.579.2]REFERENCES
Alice Mary K, Perreddy M, Surrunisa A, Chathala S and Pavan G. IoT Based Garbage Monitoring System. International Journal of Scientific &Engineering Research Volume 8, issue 4, April 2017 ISSN 2229-5518.
Akash K. T, Dineshchoudhari S. Y, Sandeep C. U, Prof Rashmi P. M. IoT Based Garbage Monitoring System. International Journal of Advanced Research in Computer Engineering &Technology (IJARCET) Volume 6, Issue 4, April 2017, ISSN: 2278-1323.
Ashima B. and Sumanth R. Garbage Monitoring System Using IoT. International Journal of Pure and Applied Mathematics, Volume 114, No 14, 2017 Pg 155-161.
S.S. Navghane, M.S. Killedar, Dr.V.M. Rohokale (May 2016),"IoT Based Garbage and Waste Collection Bin".
Guerrero, L.A., Maas, G., Hogland. "Solid waste management challenges for cities in developing countries". Journal of Waste Management
Alexey Medvedev, Petr Fedchenkov, Arkady Zaslavsky, Theodoros, Anagnostopoulos Sergey Khoruzhnikov (2014),"Waste Management as an IoT-Enabled Service in Smart Cities".
Meghana K C, Dr. K R Nataraj, " IOT Based Intelligent Bin for Smart Cities".
Vidyasagar, K., M. Sumalatha, K. Swathi and M. Rambabu, (2015). “Eco-friendly Environment with RFID Communication Imparted Waste Collecting Robot”, Journal of Academia and Industrial Research (JAIR) Volume 4, Issue 2, pp.43- 47.
Vikrant Bhor, Pankaj Morajkar, Maheshwar Gurav, Dishant Pandya, (2015). “Smart Garbage Management System”, International Journal of Engineering Research & Technology, Mumbai, India, Vol. 4 Issue 03, pp.1117-1119.
Narayan Sharma, Nirman Singha, Tanmoy Dutta, (2015). “Smart Bin Implementation for Smart Cities”, International Journal of Scientific & Engineering Research, Volume 6, Issue 9, pp.787-791.
Kanchan Mahajan, Prof. J. S. Chitode (July 2014), “Waste Bin Monitoring System Using Integrated Technologies”, International Journal of Innovative Research in Science, Engineering and Technology (An ISO 3297: 2007 Certified Organization) Vol. 3, Issue 7.
Md. Shafiqul Islam, M.A. Hannan, Maher Arebey (February 2012) , Hasan Basri , “An Overview For Solid Waste Bin Monitoring System”, Journal of Applied Sciences Research, ISSN 181-544X, vol.5, lssue4.
Sinha Twinkle, K. Mugesh Kumar, P. Saisharan (May2015), “SMART DUSTBIN”, International Journal of Industrial Electronics and Electrical Engineering, ISSN: 2347-6982 Volume-3, Issue-5 and Advanced Technology (IJEAT) ISSN: 2249 – 8958, Volume-3, Issue-4