PNEUMONIA IDENTIFICATION USING ORGANIZING MAP ALGORITHM
Moh’d Rasoul A. Al-Hadidi, O. Dorgham and Rami Salim Razouq
Al-Balqa'Applied University, Salt, Jordan E-Mail: mohammad [email protected]
ABSTRACT
This paper aims to diagnose Pneumonia infection using image processing algorithms and artificial neural network. A group of infected and normal x-ray images are prepared using segmentation and feature extraction using many processes then using Self Organizing Map algorithm to classified them. Also, artificial neural network is used to build a database of different cases of pneumonia infected and normal x-ray images, training the network to detect the infected image; the used network was the Learning Vector Quantization network, which has a high performance in classification and determination processes. This system shows a good performance in processing, comparing, and d e t e c t i n g the infected images that reached 97.45%.
Keywords: pneumonia, organizing map algorithm, X-ray images, learning vector organization network.
1. INTRODUCTION
Pneumonia is one of the most dangerous diseases in the world, especially for children. As mentioned in [5], there are two million children die every year because of pneumonia.
Pneumonia can not be detected by clinical examination because of the specificity of its symptoms. So, to expose this disease, it is important to use the chest radiography for pneumonia detection and make a clinical decision depending on the result.
To get fast detection and determination of this disease according to the x-ray images, it is important to do image enhancement besides the artificial intelligence algorithms.
In this work, we enhanced the images using extracting features, removing margins, creating a mask, and getting the main features of the image to use it in the neural network training and detecting processes.
Artificial Neural Network (ANN) has an image processing toolbox, which is used to enhance our images to be classified and mapped t o their related class. In this work we used Self-Organizing Map (SOM) neural network because it is effectual for low dimensional input samples of the network [9] [8]. This type of network is unsupervised learning because it depends on the information and does not need a supervisor in its work.
Another important algorithm which is used in our system is Learning Vector Quantization (LVQ) which is a netowrk that comes before SOM network. This type of network intiates the protypes by this equation: w= (w (i),..., w(n)) that are more easy to illustrating by the experts as in [16] [13]. So, LVQ presents a great help in classification process in multi-class [14].
This paper begins with introduction, then the related works of the pneumonia detection are presented, the experiment and methodology are briefly explained, finally the conclusion is illustrated.
2. RELATED WORKS
In Pneumonia detection field there are many studies with many concepts and methods were used to be a useful methods. Many researchers present many methods and algorithms to detect the Pneumonia with a good performance; here we briefly discussed some of them.
Bejan et al. [3] presented a natural language processing system to identify pneumonia disease. This system depends on a narrative reports associated with a patient. Also, aims to detect if the patient is positive for pneumonia or not. They used two categories of pneumonia in their system. Good performance has been shown, which could be improved by extracting the assertion value for pneumonia expressions.
Oliveiraa et al. [12] used wavelet transform on radio graph images. Images were classified into presence of pneumonia (PP) or absence of pneumonia (PA). Identification process shows a high performance especially after using Haar wavelet transform.
Kumar et al. [7] proposed a method to improve the performance of detecting process. In their study, they made enhancement and filtering for the vessel tree using second order structure and use 3D co-occurrence matrix to tie textures. After that, the classification process was done using SVM classifier with adding a fuzzy membership. This method reduces noises and enhances the performance of classification process.
Norliza et al. [11] presented a study to detect pneumonia using graphical method on selected texture measures. This study gives a good result in detecting diseases using the chest graphics.
Ada and Kaur [2] used a method to detect lung cancer using CT scan images. This method used image processing and enhancement and gave a good result to detect this disease in a short period of time.
were to identify whether or not the patient is positive for pneumonia. They designed a binary classifier which employed to identify pneumonia from a dataset of multiple types of clinical notes. Results showed t h a t a s t a t i s t i c a l feature selection a p p r o a c h would allow the feature extractor to consider only the most informative features. Also, extracting the assertion value for pneumonia expressions further will improve the system performance.
Chapman et al. [1] compared the performance of expert-crafted rules, a Bayesian network, and a decision tree at automatically identifying chest X-ray reports that support acute bacterial pneumonia. They encoded reports using their natural language processor and then m a n u a l l y corrected f o r mistakes. They used McNemar’s test to determine statistical significance for binary output and univariate z-tests for probabilistic output. Results showed that their system performed similarly to physicians.
Li et al. [10] evaluated radiologists ability to detect focal pneumonia by use of standard chest radiographs alone compared with standard plus bone-suppressed chest radiographs. They included standard chest radiographs without focal opacities. Also, they applied a system for bone suppression to the selected radiographs to create corresponding bone suppression images. Results showed that the use of bone suppression images improved radiologists performance for detection of focal Pneumonia on chest radiographs.
Corradi et al. [6] compared the diagnostic performance of a new method for quantitative analysis of lung ultrasonography with bedside chest X-ray and visual lung ultrasonography for detection of community-acquired pneumonia, using thoracic computed tomography as a gold standard. Results using quantitative ultrasonography showed higher sensitivity, specificity, and diagnostic accuracy than chest X-ray, visual ultrasonography, or their combination.
3. EXPERIMENT AND METHODOLOGY
In this paper we proposed a novel methodology to solve the diagnoses of pneumonia infection problem.
We used image processing and computer vision in order to analyze the X-Ray images and extract the features from them. Initially we collected soft copies of chest X-rays from different hospitals, these images contains different types of pneumonia in addition to healthy images. These images built a categorized Database, then we applied a segmentation process and image histogram process on these images. Then the neural network built and was trained to detect the infected images when the user ask this system to determine if the patient has a pneumonia or not in just a few seconds.
3.1 Pre-processing
We collected 140 images to store in our database, in order to enhance the performance of our system and ensure that it contains most of the pneumonia cases besides to the healthy chest x-ray images. This allows our system to diagnose almost any chest x-ray image, and find if the image is normal or has a pneumonia infection, and also the infection level. All of these images are soft copies of chest x -ray i m a g e s , infected and normal, w e r e exported d i r e c t l y f r o m x-ray machines from different hospitals around our country.
3.2 Image classification
After building our database, it is necessary now to classify into categories; according to either the image is infected or not, and in which infection level. This was done by coordinating a specialist doctor. Figure-1 shows a sample of x-ray images classified, by the specialist. Moreover, the categorization took into account the six medical parameters of diagnosing the infection, but as we mentioned previously, we designed this system, to find an initial diagnose to the patient. Thus, the specialist categorized the images into four categories: level one (not critical), level two (critical), l e v e l three (advanced) or level four (Normal).
From F igure-1, we can notice that it is difficult for a non-specialist person to differentiate between the images and classify them. However, for specialists, they have some criteria, in addition to their experience. They can classify the images, even though the classification will not be accu- rate without the required tests. However, for some cases, like children it will be a quick decision for them to classify their images in the critical level, due to their age, which appears easily in the images.
We differentiated between these classes using
Figure-1. Chest x-ray images: From top left, clockwise.
category of the newly entered image in the Post-Processing phase.
3.3 Removing margins
The next important step is to find the region of interest in the image, which is in our case, the lungs, where pneumonia infection exists. How- ever, when viewing the images, we noticed that all the images contain some information, related to the patient and the test, written on each side of the image. A sample of these writings can be noticed in Figure-2. These writings will affect the process of analyzing and feature extraction of the image, because these are useless information to our system existing on the image. Thus, the second step of the preprocessing phase is to remove these writings from all the images in our database. By viewing all the imaged in our database, we found that the writings exist within 50 pixels on each side. Moreover, we found that no valuable information exist within 50 pixels on each side of any image in our database. Thus, it is a straight- forward solution to the margins problem is to re move 50 pixels from each side of each image and store them again in the database. The previous images w i t h o u t t h e m a r g i n s a r e found in F igure-3. We may notice from the figure below that there still some writings on the top left side of the im- age, but this will be neglected in relation to other useful objects of the image, as will be discussed later in this section.
Figure-2. Chest x-ray image, without margins on each side.
3.4 Creating a mask
To find a region of interest, we first need to create a mask for the lungs. This mask should be variable and able to be applied on each image in our database. Having information about the dimensions and shape of the lungs differ from person to another and from age to another. This step was done using many steps:
The first step was extracting the pixels from the gray scale pixels of the chest x-ray image. We used the auto-tuned threshold value and by using the
correlation of the image Euler numbers, the binary values of the lungs are different from the rest of the images. We benefited from Wong et al. work, published in [15]. The image in the p r e v i o u s figure, after this extraction, is found in F igure-3.
Figure-3. Binary image extraction.
As shown, we need a connected line around the lungs in order to create a variable mask.
Two complete lungs are presented in the previous step; however, for object detection which is the lung in our case, the contrasts of the lungs are different from the contrast of the background image. This difference can be easily detected by finding the gradient of the image. This gradient can be found, in addition to the threshold that can be applied to create a binary mask containing the segmented lungs. Initially, w e apply edge and Sobel MATLAB operators to find the threshold value. Then, after tuning the threshold, we use edge again to get a binary mask that contains the segmented lungs. See Figure-4.
Figure-4. Binary gradient mask.
points of high contrast of the image. However, they do not draw initial shape of the lung, because there are other lines appeared in the image, which are not related to the lungs. Moreover, we can easily notice the gabs in the lines surrounding the lungs in the mask. To solve this problem, we dilated the previous image using linear structuring elements using the vertical and horizontal structuring elements of strel MATLAB function. The output of this dilation is shown in F igure-5.
Figure-5. Dilated gradient mask.
The mask in the previous image shows the lungs better than the previous image. However, there are still holes within the lungs. We used imfill function to fill these holes. The resulted image is shown in the following Figure.
Figure-6. Binary mask with filled holes
The lungs have been nearly segmented, but as we can notice in the previous F igure, there are also other objects exist in addition to the lungs. We removed the useless objects using imclear boarder MATLAB function. This is usually used to clear the useless objects on the boarders of the objects of interest. However, we benefited from this function to re move the useless objects, by setting the connectivity o f this
function to (4), to remove the diagonal connections. The resulted image is shown in the Figure-7.
Figure-7. Binary mask without most of the useless objects.
To enhance the shape of the objects, and make them look natural, we smoothed the objects, by eroding the image two times with a diamond structuring element, using strel MATLAB function as shown in the next F ig ure.
Figure-8. Smoothed objects.
Now we need to draw a connected line around the boarders of the mask, we used the principle of connected object, with threshold of 5.5, after noting that in most of our images the distance of the connected objects that constitute the lungs is less than or equal to 5.5 pixels. Finally, we need to remove any useless object, and keep the two boarders of the lungs alone in the image. To solve this problem we extracted the largest connected components from the image. From the previous figure, it is clear that t h e two largest connected components are the two lungs.
Figure-9. Largest three connected objects.
3.5 Lungs-only sub-image
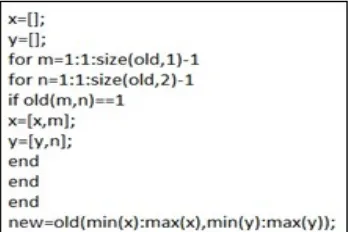
[image:5.612.92.277.95.206.2]In order to reduce the number of the objects in the images, we make it easy for the neural network to classify them. We need to extract a sub image from original image, which contains o n l y the regions of interest (the lungs in our case). In order to obtain that, we benefited from the output of the previous figure, which contains the three largest connected components; this explains the reason of making the boarders around the lungs and keeping the three largest connected components in the final image. The process took many factors to be completed, such as: the third object in the Figure will be neglected, using the binary Figure (black color is represented by 0 and the white color is represented by 1), finding the first pixel of the first object to find the last pixel in the last object, Figure-10, where F igure- 11 shows our object after this process.
[image:5.612.319.537.411.546.2]Figure-10. Sub-image extraction code.
Figure-11. Lungs-only sub-image.
3.6 Processing phase
To classify the images and find the category of the new x-ray image, in order to diagnose it, we will use Artificial Neural Network (ANN) algorithm. However, we first need to determine the best ANN algorithm for our project, considering that we do not have data for the input layer and data for the output layer, the only data we have are the images in our database.
Our method to solve this problem is to build classes for the images and then to classify the images based on their features. We obtained that by finding the histogram of each image, then using Self-Organizing Map (SOM) algorithm as a un- supervised neural network, to build the classes. Then using these classes together w i t h the features as input and output to the Learning Vector Quantization Neural Network (LVQnet) as a supervised neural network. By doing this, we will train the LVQnet on the histograms of the images in our database.
3.7 Image histogram
The first step of this phase is to take the histogram of each image; our code began by searching the directory of our database for all files with. jpg extension, which is the extension of our images, resulted from the previous phase.
Figure-12. Lungs-only sub-image histogram.
[image:5.612.98.272.440.556.2] [image:5.612.97.273.591.707.2]Figure-13. Self-organizing map neural network.
3.8 Self-Organizing Map (SOM) neural network We used a 10 x 10 SOM network to build classes for the images based on their histograms. We used the default values of SOM network, as the only thing we need from it, is to build classes for the images based on their histograms. The following figure shows the SOM neural network for our histogram matrix.
The training algorithm for this network is Batch Weight/Bias Rules. The performance function is Mean Square Error, and 200 epochs. Which are the default values for this network? The resulted plots for this SOM network, with the histogram matrix of our images as input, are given in our system.
In addition to the 10 x 10 SOM topology, we have the neighborhood distances, which represent the classes for our input histogram and the distances between these classes. The neighborhood function hits to preserve the topological proper- ties of the input space which is represented in the hits subfigure. Moreover, the weights position and distances from each other is represented in the weights sub-figure.
Figure-14. SOM weights positions.
The results from this SOM network is not accurate hundred percent, which means that the classes does not accurately represent the variety of our images. However, this result will be enough for the LVQnet to be trained successfully.
The SOM plots show the SOM topology, SOM neighbor connections, SOM neighbor weights and distances, SOM weights positions, SOM sample hits and SOM input planes.
Figure-15. SOM topology.
3.9 Learning Vector Quantization Network (LVQnet) After taking the histograms of the images in our database, which represent the features of the images, and then after building the classes for the histograms. The features matrix and the classes, which are the histograms and the SOM output, will be used as input and output to train the LVQnet. We built our LVQnet with the following parameters: 30 hidden layers, 0.001 for the performance goal, and kept the other parameters on the default values. We reached these values by trial and error, considering the performance of the LVQnet and the training time. Using these parameters, we reached the following training results after the completion of 1000 epochs (the default value). The plots for the training results of the third cycle are shown in following Table.
Table-1. LVQnet training results.
Training cycle Time Goal
1 04:03 0.0196
2 04:07 0.00925
3 04:09 0.00701
Figure-16. LVQnet plots for the first training cycle with 3000 epochs.
Figure-17. LVQnet plots for the third training cycle with 1000 epochs.
For the second network, it took 12 minutes and 50 seconds to reach 0.00755 performance goal. Moreover, by comparing the two previous figures, we can easily notice the similarity between the two results. However, we kept the epochs for our LVQnet on the default value. Because we found it worthless to spend that relatively long time waiting the network to learn. While sometimes, we may get acceptable results with shorter time or fewer cycles.
4. CONCLUSIONS
Each image to be processed using computer algorithm or Artificial Intelligent Algorithm needs to be prepared for this process initially. From our pre-processing phase, we reached a concluding that in order to be able to extract the features from our images, we followed these processes in addition to the connected components functions, to build a variable mask The images best classified based on their features, using SOM neural network, followed by LVQnet. Which are the best types of neural network for image classification, which is the
problem of our processing? Moreover, SOM uses unsupervised training method, which is suitable for problems like ours where the system does not have images for the output.
And also, X-ray images are relatively difficult for feature extraction, because they do not have noticeable edges or color variations. In addition, the best way to extract features from x-ray images is to use Euler number correlation, which extracts the binary image from the gray-scale image. Then to find the connected components of the resulted image.
Training the ANN several times, or summing the number of epochs for all of them and training the ANN with the new number of epochs, will reach similar performance goal and error values. However, training the network with lower number of epochs sometimes reduces the entire training time, because the ANN may begin with good values of weights.
We found that the performance goal remains constant without any variation after 300 epochs. However, our system have been tested by many doctors and this system give a right result of all the x-ray images except two x-ray images that didn’t match the data base samples we then add these images to our data base, and now our sys- tem can work efficiently with a high performance which is 97.45%.
ACKNOWLEDGEMENT
I would like to thank Dr. Haitham Al-Azzam for his help in collecting the x-ray images. Moreover, I would like to thank Dr. Ahmed Khayyat from Al Zraqa hospital for his help and support.
REFERENCES
[1] 2001. A comparison of classification algorithms to automatically identify chest x-ray reports that support pneumonia. Journal of Biomedical Informatics. 3 4 (1): 4-14.
[2] Ada and Rajneet Kaur. 2013. Feature extraction and principal component analysis for lung cancer detection in ctscan images. International Journal of Advanced Research in Computer Science and Software Engineering. p. 3.
[3] C. Bejan, F. Xia, L. Vanderwende, M. Wurfel and M. Yetisgen-Yildiz. 2012. Pneumonia identification using statistical feature selection. American Medical Informatics Association.
selection. Journal of the American Medical Informatics Association. 19(5): 817-823.
[5] R.E. Black, S.S. Morris and J. Bryce. 2003. Where and why are 10 million children dying every year? Lancet. pp. 2226-2234.
[6] Alessandro Garlaschi Francesco Corradi, Claudia Brusasco. 2015. Quantitative analysis of lung ultrasonography for the detection of community-acquired pneumonia: A pilot study. BioMed Research International.
[7] Indu.V.Kumar, S.Jeyanthi, Dr. N. Uma Maheswari, and Dr. R. Venkatesh. 2012. Ascular segmentation of interstitial pneumonia patterns in lung using mdct. International Journal of Computer Science and Information Technology and Security. p . 2.
[8] Kohonen and Teuvo. 1982. Self-organized formation of topology correct feature maps. Biological Cybernetics. p. 43.
[9] Kohonen and Teuvo. 2007. Kohonen network. Scholarpedia.
[10]Feng Li, Roger Engelmann, Lorenzo Pesce, III Armato, SamuelG and Heber Mac Mahon. 2012. Improved detection of focal pneumonia by chest radiography with bone suppression imaging. European Radiology. 22(12): 2729-2735.
[11]Norliza Mohd. Noor, Omar Mohd. Rijal, S. A. R. Abu-Bakar, Mohd. Iqbal, and Gan Chew Peng. 2009. A graphical method of detecting pneumonia using chest radiograph. WSEAS Transactions on Information science and application. p. 6.
[12]L. Lus Oliveiraa, S. Silvaa, L. Ribeirob, R. Oliveiraa, C. Coelhoc and A. Andrade. 2008. Computer-aided diagnosis in chest radiography for detection of childhood pneumonia. International journal o f medical informatic. p. 77.
[13]C.E. Pedreira. 2006. Learning vector quantization with training data selection. Pattern Analysis and Machine Intelligence, IEEE Transactions on. 28(1): 157-162.
[14]P.Schneider, B. Hammer and M.Biehl. 2009. Adaptive relevance matrices in learning vector quantization. Neural C o m p u t a t i o n . p. 21.
[15]L.P Wong and H.T Ewe. 2005. A study of lung cancer detection using chest x-ray images. APT Telemedicine Workshop. pp. 210-214.