ISSN: 1992-8645 www.jatit.org E-ISSN: 1817-3195
APPLICATION OF NEURO-FUZZY METHOD FOR
PREDICTION OF VEHICLE FUEL CONSUMPTION
RAMADONI SYAHPUTRA
Department of Electrical Engineering, Faculty of Engineering,
Universitas Muhammadiyah Yogyakarta
Jl. Ringroad Barat Tamantirto, Kasihan, Yogyakarta
INDONESIA 55183
E-mail: [email protected]
ABSTRACT
This paper presents the application of neuro-fuzzy method for prediction of vehicle fuel consumption prediction. Prediction motor vehicle fuel consumption has become a strategic issue, because it is not only related to the issue of availability of fuel but also the problem of the environmental impact caused. This study used automobile data, i.e. number of cylinders, displacement, horsepower, weight, acceleration, and model year, while the output variable to be predicted is the fuel consumption in MPG (miles per gallon). 'Weight' and 'Year' are selected as the best two input variables. The training and checking errors are getting distinguished, indicating the outset of overfitting. The results of this research are expressed in three dimension input-output surface graph of the best two-input ANFIS model for MPG prediction. It is a nonlinear and monotonic surface, in which the predicted MPG increases with the increase in 'Weight' and decrease in 'Year'. The training RMSE is 2.767; the checking RMSE is 2.996. The greater the weight of the motor vehicle, the greater the amount of fuel needed to travel the same distance. In comparison, a simple linear regression using all input candidates results in a training RMSE of 3.453, and a checking RMSE of 3.445.
Keywords: ANFIS, Fuel Consumption, Fuel Prediction, RMSE.
1. INTRODUCTION
The availability of fuels the less, requires us to think of anticipatory steps that must be done. Some anticipatory measures that have been done is to produce a vehicle that is fuel-efficient and use alternative fuels such as biodiesel, bioethanol, hydrogen gas, and others. One of the measures related to fuel savings is to manage well the use of motor vehicle fuel [1]. Management of fuel use is needed, especially for each individual vehicle owners. In order to manage the use of fuel properly, the necessary information regarding motor vehicle fuel consumption and vehicle characteristics concerned. This information is useful for use as a foothold in predicting the fuel consumption of motor vehicles.
Prediction motor vehicle fuel consumption has become a strategic issue, because it is not only related to the issue of availability of fuel but also the problem of the environmental impact caused.
Some methods to predict the fuel consumption of motor vehicles have been developed include methods based on data speeds and vehicle acceleration [2], a method based on the characteristics of multidimensional engine [3], and methods based on statistical models [4]. These methods can be categorized as conventional methods. Since the introduction of the concept of fuzzy logic in the mid-1960s, then this concept has become a new discourse in applications in various fields [5] – [6]. The next development was the emergence of artificial neural network method, which is one of intelligent methods.
ISSN: 1992-8645 www.jatit.org E-ISSN: 1817-3195 interesting issue. Therefore, this study will try to
apply the concept of artificial neural networks and fuzzy logic, which is often also known as the method of ANFIS (Adaptive Neuro Fuzzy Inference System) to predict the fuel consumption of motor vehicles.
The purpose of this study was to learn more profound method through concepts ANFIS adaptive network and fuzzy logic inference systems and to create a device-prediction software motor vehicle fuel consumption accurately using ANFIS method, which was developed in Matlab software devices. The main contribution of this study is to the world of education and research or other community (industry, banks, and companies) that have a great interest or interest, directly or indirectly. More concretely, these contributions are detailed as follows: 1) Using the model to be made in this study, users can learn the concepts and workings ANFIS on intelligent systems especially in the prediction problem, 2) With accurate prediction method, the use of fuel for motor vehicles can be more efficient, and 3) From the results of this study are expected to be useful in growing new
inspirations for ANFIS application and
development.
Neuro-fuzzy method is a combination of artificial neural network method and the method based on fuzzy logic. Adaptive neuro-fuzzy method has been widely used in various applications in various fields [8] – [9]. Applications neuro-fuzzy methods are including for the purposes of control, estimation and prediction [10]. In the current control system has been applying the principles of fuzzy logic called FLC (fuzzy logic controller). How it works is similar to the control of an operator control, do not pay attention to the internal structure of the plant, and just observe the error as the difference between the set-point outputs and change system settings control panel to minimize the error.
The subsequent development of an artificial intelligence system was integrating the artificial neural network with fuzzy logic, which is known as the ANFIS. Adaptive Neuro Fuzzy Inference System (ANFIS) has been accepted as a reliable method and is believed to continue to evolve in order to address the need for an intelligent system. ANFIS is a fuzzy logic inference systems are implemented on a system of adaptive network [11].
Understanding of the ANFIS can be started from the basic principles of fuzzy logic system [12], artificial neural networks [13], a network of neuro fuzzy [10, 12], to the concept of ANFIS and its
applications [10, 11]. Neuro-fuzzy system is a multi-layered network of connections that realize the basic elements and functions of the control system / traditional fuzzy logic decision. Because neuro fuzzy system is an universe approach operator then neuro fuzzy control system is also universe approach operator, because of its functions constitute a form (isomorphic) with traditional fuzzy logic control system. There are several kinds of neuro fuzzy networks including FALCON, GARIC, and other variations [7].
By leveraging the network architectures and learning algorithms associated, neuro-fuzzy system has been successfully applied to a variety of [14] – [21]. Applications of neuro-fuzzy method can also be developed by combining it with other artificial intelligence methods likely PSO [22] – [25]. However, most of the neuro-fuzzy system shows some major deficiencies, namely the emergence of a decrease in performance. These deficiencies due to the number of fuzzy rules and incapacity gain knowledge of a given set of training data. With success in various fields, draw ANFIS method to be applied in an intelligent system that is for the purposes of prediction of the fuel consumption of motor vehicles.
2. FUNDAMENTAL THEORY
2.1. Vehicle Fuel Consumption Model
The technological advances that accompanied rapid economic development make the energy becoming key issues for the world community. Car as a mode of transportation today and the future also continues to progress both in terms of quantity and quality. The size of the current car quality is not only located the engine capability and ride comfort, but also on its fuel consumption. The cars produced today are required to use fuel economically, or even have developed the car with fuel is also non-fuel such as electric cars, cars with hydrogen fuel, and others. These steps are carried out because of the depletion of the availability of fuel.
ISSN: 1992-8645 www.jatit.org E-ISSN: 1817-3195 a great influence in threatening the availability of
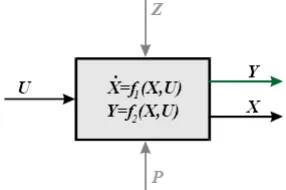
[image:3.612.124.267.184.279.2]oxygen in the air, because it will be replaced by CO2. Therefore it is the duty of the Engineer to think of anticipatory steps in addressing this issue. Related to this issue, there is a method of prediction of fuel consumption is based on a multi-dimensional engine characteristic.
Figure 1. Schematic of a causal model in the form of state equation
The multidimensional engine characteristics defined using dynamic relationships commonly used in the graphic theory Bond and Equal Circumstances [3], which is in the form of the state equation expressed by:
X = f1 (X, U) (1)
Y = f2 (X, U) (2)
Machine parameters that are important to note in this method is the angular velocity, torque, fluid temperature, oil temperature, CO2 emissions, emissions of HC and NO2 emissions. Related to the impact caused by the oil-fueled vehicles in the form of exhaust emissions endanger human health and the environment, the use of fuel for vehicles need to be managed properly. One step fuel management is to know clearly the needs of the fuel consumption. For this reason in this study predicted vehicle fuel consumption.
2.2. ANFIS Method
ANFIS method has been became a popular method in many application. A brief description of the principles of Adaptive neuro-fuzzy inference system (ANFIS) which are referred to [11] is described in this section. The basic fundamental structure of the type of fuzzy inference system could be seen as a model that maps input characteristics to input membership functions. Then it maps input membership function to rules and rules to a set of output characteristics. Finally it maps output characteristics to output membership functions, and the output membership function to a single valued output or a decision associated with
the output.
The neuro-adaptive learning method works similarly to that of neural networks. Neuro-adaptive learning techniques provide a method for the fuzzy modeling procedure to learn information about a data set. It computes the membership function parameters that best allow the associated fuzzy inference system to track the given input/output data. A network-type structure similar to that of a neural network can be used to interpret the input/output map so it maps inputs through input membership functions and associated parameters, and then through output membership functions and associated parameters to outputs,. The parameters associated with the membership functions changes through the learning process. The computation of these parameters (or their adjustment) is facilitated by a gradient vector. This gradient vector provides a measure of how well the fuzzy inference system is modeling the input/output data for a given set of parameters. When the gradient vector is obtained, any of several optimization routines can be applied in order to adjust the parameters to reduce some error measure (performance index). This error measure is usually defined by the sum of the squared difference between actual and desired outputs. ANFIS uses a combination of least squares estimation and back propagation for membership function parameter estimation.
The suggested ANFIS has several properties:
1. The output of ANFIS is zero-th order
Sugeno-type system.
2. ANFIS has a single output, obtained using
defuzzification of weighted average.
3. ANFIS has no rule for sharing. Different rules
do not share for output membership function that has the same value.
4. ANFIS has unity weight for each rule.
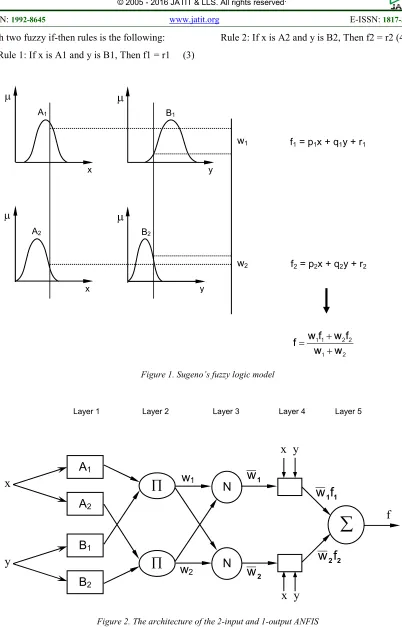
ISSN: 1992-8645 www.jatit.org E-ISSN: 1817-3195 with two fuzzy if-then rules is the following:
Rule 1: If x is A1 and y is B1, Then f1 = r1 (3)
Rule 2: If x is A2 and y is B2, Then f2 = r2 (4)
[image:4.612.104.506.62.689.2]Figure 1. Sugeno’s fuzzy logic model
Figure 2. The architecture of the 2-input and 1-output ANFIS
A
1A
2B
1B
2∏
∏
x
y
N
N
∑
f
x y
x y
2
w
1
w
w
1w
21 1
f
w
2 2
f
w
Layer 1 Layer 2 Layer 3 Layer 4 Layer 5
µ
µ
µ
µ
A1
A2
B1
B2 x
x
y
y
w1
w2
f1 = p1x + q1y + r1
f2 = p2x + q2y + r2
ISSN: 1992-8645 www.jatit.org E-ISSN: 1817-3195 The output of the node i-th in layer n is denoted
as On,i:
Layer 1. Every node i in this layer is a square node with a node function:
O
= µAi(x), for i = 1, 2, (5)
or,
O
= µBi-2(y), for i = 3, 4 (6)
where x is the input to node-i, and Ai is the linguistic label (small , large, etc.) associated with
this node function. In other words,
O
is themembership function of Ai and it specifies the degree to which the given x satisfies the quantifier
Ai. Usually µAi(x) is chosen to be bell-shaped with
maximum equal to 1 and minimum equal to 0, such as the generalized bell function:
i i i A
2b
a
c
x
1
1
(x)
μ
−
+
=
(7)The parameters are referred to as premise parameters.
Layer 2. Every node in this layer is a circle node labelled Π which multiplies the incoming signals and sends the product out. For instance,
= wi = µAi(x) x µB(y), i = 1, 2. (8)
Each node output represents the firing strength of a rule. (In fact, other T-norm operators that performs generalized AND can be used as the node function in this layer.)
Layer 3. Every node in this layer is a circle node labeled N. The i-th node calculates the ratio of the i-th rule’s firing strength to the sum of all rules firing strengths: 2 1 i 3 i
w
w
w
w
O
+
=
=
, i = 1, 2. (9)For convenience, outputs of this layer will be called normalized firing strengths.
Layer 4. Every node i in this layer is a square node with a node function:
)
i i i i i i 4i
w
f
w
(p
x
q
y
r
O
=
=
+
+
(10)where
w
i is the output of layer 3, and {pi, qi, ri} is the parameter set. Parameters in this layer will be referred to as consequent parameters.Layer 5. The single node in this layer is a circle node labeled Σ that computes the overall output as the summation of all incoming signals, i.e.,
∑
=
i i5
i
w
f
O
(11)3. METHODOLOGY
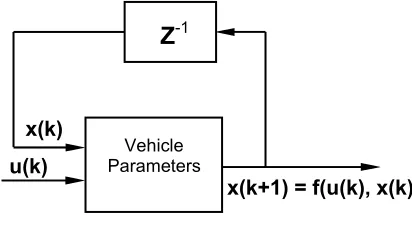
[image:5.612.320.526.441.560.2]Intelligent systems design model for the prediction of the fuel consumption of motor vehicles generally consist of three stages, namely the collection of training data (Figure 4), ANFIS training process (Figure 5), and the use of predictors ANFIS (Figure 6). In the process of data collection training, data collected in the form of fuel oil consumption for a wide range of vehicle brands with regard six input attributes that the number of cylinders, displacement, power, weight, acceleration, and the year of manufacture. Variable output fuel consumption of vehicles is concerned, the architectural design of ANFIS in this study, based on Figure 2 that can use Sugeno ANFIS models.
Figure 4. Block Diagram Of The Input And Output Of Data Collection
In Figure 4, the value of x (x + 1) is the output of a function that has the input u (k) and x (k). So in this case a motor vehicle is a function that depends on the previous output. The next training is on ANFIS to the data inputs and outputs. The training structure is shown in Figure 5.
Z
-1Vehicle Parameters
x(k+1) = f(u(k), x(k) x(k)
ISSN: 1992-8645 www.jatit.org E-ISSN: 1817-3195
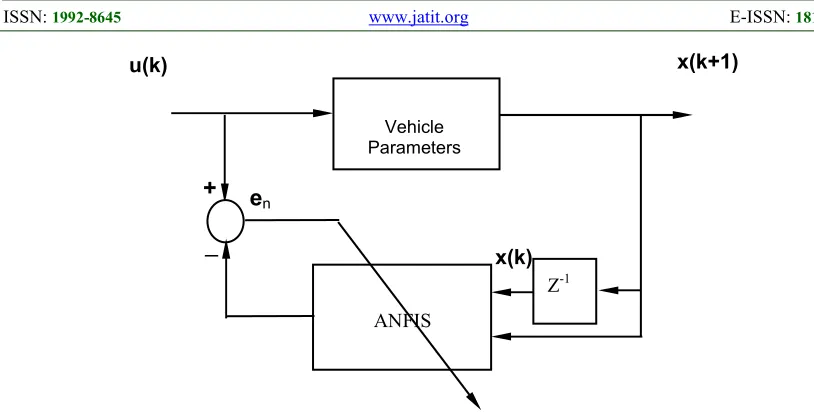
Figure 5. ANFIS Training Process
Training data used in the plant according Figure 5 has the following format:
[x(k), x(k+1), u(k)]
The first two columns of data is the data being input ANFIS last column is the data output of the ANFIS. Training data is obtained by inserting a random value with a magnitude of between -1 and 1 to obtain x (k) and x (k + 1). Training is done by
entering the value x (k) and x (k + 1) which have been obtained ANFIS then ANFIS output compared with the value u (k). Once the data is obtained and ANFIS training has been trained, then ANFIS training results are used to predict the consumption of fuel for motor vehicles, as shown in Figure 6.
Figure 6. Aplication Process Of ANFIS Predictor
4. RESULTS AND DISCUSSION
4.1 General
In this study addressed the use of methods ANFIS (Adaptive Neuro Fuzzy Inference Systems) to predict the fuel consumption of motor vehicles, especially cars. ANFIS method in this study utilizing the toolbox contained in the software MATLAB, the Fuzzy Logic Toolbox. In this case the function used is ANFIS function. Prediction fuel is needed in order to plan for the car especially for the purpose of the trip with a very far distance.
Prediction fuel often referred to as a prediction MPG (miles per gallon), a prediction measure how far that can be reached by a car for every one gallon of fuel.
4.2 ANFIS Training
Prediction MPG (miles per gallon) is a problem that is nonlinear regression, in which some of the completeness of the information profiles of a car is needed to predict the fuel consumption in MPG. Therefore, a relevant data is pertaining to the use of the fuel of a car, and also for the cars of other ANFIS
x(k+1) x(k)
u(k)
Vehicle
model
Z-1
xd(k+1)
ANFIS
x(k+1)
x(k) u(k)
Vehicle Parameters
Z-1
e
n+
[image:6.612.117.496.448.555.2]ISSN: 1992-8645 www.jatit.org E-ISSN: 1817-3195 products. In this study, used for ANFIS training
data obtained from data provided by the UCI (Univ. of California at Irvine) Machine Learning Repository. The address contained in the data collected from the cars with different models and brands, as shown in Table 1. The table shows some tuple of the data set MPG (miles per gallon). Six attribute input consists of a number of cylinders,
displacement, power (HP), weight (kg),
acceleration, and model year. Furthermore, the output variables to be predicted are the fuel consumption in MPG (miles per gallon). Brands
[image:7.612.85.512.264.496.2]and models of cars are shown in the first column of Table 1 is not used in this prediction, and is shown only for the supporting information. The set of data obtained from the original data file 'auto-gas.dat'. Then the data set is partitioned into a training set (tuple indexed odd) and the set of checks (tuple indexed even), and use the function 'exhsrch' to find the input attributes that have better predictive power for ANFIS modelling.
Table 1. Technical Data Of Cars Of Different Brands
Automobile Name
Input Data Output
Data Number
of Cylinders
Displace-ment
Power
(HP) Weight Acceleration Years MPG
Chevrolet Chevelle Malibu
8 307 130 3504 12 1970 18
Plymouth
Duster 6 198 95 2803 15.5 1970 22
Fiat 128 4 90 75 2108 15.5 1974 24
Oldsmobile Cutlass Supreme
8 260 110 4050 19 1977 17
Toyota 4 89 62 2050 17.3 1981 37.7
Honda
Accord 4 107 75 2205 14.5 1982 36
Ford
Ranger 4 120 79 2625 18.6 1982 28
To select the best input attributes, 'Exarch' construct six ANFIS, each with a single input attribute. In this case the results after execution exhsrch are (1, trn_data, chk_data, input_name). It can be seen that 'Weight' is the most influential input attribute, then the attributes most influential input two numbers is 'disp', and so on. Error training and checking than its size, which implies that there is no overfitting and can be selected more input variables. Based on intuition, it can be simplified with selecting 'Weight' and 'disp' directly. But not required two-ANFIS models with minimal training error. To prove this, it can be done by activating the command exhsrch (2 trn_data, chk_data, input_name) to select the two best entries of all combinations.
exhsrch(1, trn_data, chk_data, input_name);
win1 = gcf;
Furthermore trained 6 ANFIS models, each with 1 input elected from 6 candidates, resulting in the following data:
ANFIS model 1: Cylinder --> trn=4.6400, chk=4.7255
ANFIS model 2: Disp --> trn=4.3106, chk=4.4316
ANFIS model 3: Power --> trn=4.5399,
chk=4.1713
ANFIS model 4: Weight --> trn=4.2577,
chk=4.0863
ANFIS model 5: Acceler --> trn=6.9789, chk=6.9317
ISSN: 1992-8645 www.jatit.org E-ISSN: 1817-3195
Figure 7. Training error and checking of 6 ANFIS model
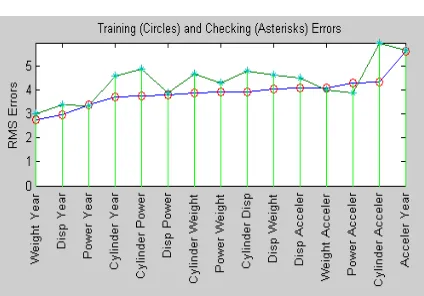
To demonstrate the results of the two inputs is selected. It can be done by selecting the 'Weight' and 'Year' as the best two input variables. Error training direct inspection can be distinguished, which indicates the beginning of overfitting. As a comparison, it can be used exhsrch to choose three inputs, namely:
input_index = exhsrch(2, trn_data, chk_data, input_name);
new_trn_data = trn_data(:, [input_index,
size(trn_data,2)]);
new_chk_data = chk_data(:, [input_index, size(chk_data,2)]);
win2 = gcf;
Furthermore, the training of 15 ANFIS models, each with two inputs selected from six candidates, namely:
ANFIS model 1: Cylinder Disp --> trn=3.9320, chk=4.7920
ANFIS model 2: Cylinder Power --> trn=3.7364, chk=4.8683
ANFIS model 3: Cylinder Weight -->
trn=3.8741, chk=4.6763
ANFIS model 4: Cylinder Acceler -->
trn=4.3287, chk=5.9625
ANFIS model 5: Cylinder Year --> trn=3.7129, chk=4.5946
ANFIS model 6: Disp Power --> trn=3.8087, chk=3.8594
ANFIS model 7: Disp Weight --> trn=4.0271, chk=4.6350
ANFIS model 8: Disp Acceler --> trn=4.0782, chk=4.4890
ANFIS model 9: Disp Year --> trn=2.9565, chk=3.3905
ANFIS model 10: Power Weight --> trn=3.9310, chk=4.2976
ANFIS model 11: Power Acceler --> trn=4.2740, chk=3.8738
ANFIS model 12: Power Year --> trn=3.3796, chk=3.3505
ANFIS model 13: Weight Acceler -->
trn=4.0875, chk=4.0095
ANFIS model 14: Weight Year --> trn=2.7657, chk=2.9953
ANFIS model 15: Acceler Year --> trn=5.6242, chk=5.6481
Figure 8 shows the results of the election of three entries, with 'Weight', 'Year' and 'Acceler' were chosen as the best three input variables. It can be seen that the minimum training error (and checks) is not significantly reduced from 2-input models best, indicating that the addition of new attributes 'Acceler' not able to improve significantly predicted outcome. For better generalization, then it was preferably a model with a simple structure. Therefore in this case will be applied two ANFIS inputs for further exploration, namely:
exhsrch(3, trn_data, chk_data, input_name);
[image:8.612.314.526.470.618.2]in3 = gcf;
Figure 8. Training Error And Checking Of 15 ANFIS Model
Furthermore, trained 20 ANFIS models, each with 3 inputs selected from six candidates as follows:
ISSN: 1992-8645 www.jatit.org E-ISSN: 1817-3195 ANFIS model 2: Cylinder Disp Weight -->
trn=3.6686, chk=4.8922
ANFIS model 3: Cylinder Disp Acceler --> trn=3.6610, chk=5.2384
ANFIS model 4: Cylinder Disp Year --> trn=2.5463, chk=4.9001
ANFIS model 5: Cylinder Power Weight --> trn=3.4797, chk=9.3761
ANFIS model 6: Cylinder Power Acceler --> trn=3.5432, chk=4.4804
ANFIS model 7: Cylinder Power Year --> trn=2.6300, chk=3.6300
ANFIS model 8: Cylinder Weight Acceler --> trn=3.5708, chk=4.8378
ANFIS model 9: Cylinder Weight Year --> trn=2.4951, chk=4.0435
ANFIS model 10: Cylinder Acceler Year --> trn=3.2698, chk=6.2616
ANFIS model 11: Disp Power Weight --> trn=3.5879, chk=7.4948
ANFIS model 12: Disp Power Acceler --> trn=3.5395, chk=3.9953
ANFIS model 13: Disp Power Year --> trn=2.4607, chk=3.3563
ANFIS model 14: Disp Weight Acceler --> trn=3.6075, chk=4.2318
ANFIS model 15: Disp Weight Year --> trn=2.5617, chk=3.7865
ANFIS model 16: Disp Acceler Year --> trn=2.4149, chk=3.2480
ANFIS model 17: Power Weight Acceler --> trn=3.7884, chk=4.0480
ANFIS model 18: Power Weight Year --> trn=2.4371, chk=3.2852
ANFIS model 19: Power Acceler Year --> trn=2.7276, chk=3.2580
[image:9.612.307.522.74.251.2]ANFIS model 20: Weight Acceler Year --> trn=2.3603, chk=2.9152
Figure 8. Training Error And Checking Of 20 ANFIS Model
In Figure 9 is shown the surface of the input-output model of the two-input ANFIS best for prediction MPG. In the picture it is shown that the model is nonlinear and monotonous surface, with the predictable increase MPG in the event of an increase in 'Weight' dam drop in 'Year'. Value RMSE (root mean squared error) is training 2,767 and RMSE check is 2,996. As a comparison, performed by simple linear regression using all the candidates input produces training RMSE is 3.4527, and the checking RMSE is 3.4444.
4.3 Vehicle Fuel Prediction
ISSN: 1992-8645 www.jatit.org E-ISSN: 1817-3195
Figure 10. MPG Chart Predicted Results Based On The Weight Of Motor Vehicles
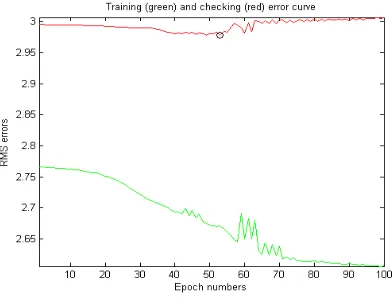
[image:10.612.301.516.71.249.2]Exhsrch function is only ANFIS to train every single epoch in order to find the correct input briefly. Once the input is set, it will take longer for ANFIS training. Plot in Figure 11 shows the error curve for 100 epoch ANFIS training. Green curve shows the error of training, while the red curve shows the error-checking. Minimal error checking occurs during epoch 45, characterized by circle. Notice that the curve of error checking to rise after 50 epochs, indicating that further training will occur overfitting the data and produce a poor generalization.
[image:10.612.96.292.472.624.2]Figure 11. Error Curve For 100 Epochs Of ANFIS Training
Figure 12. Graph The Results Predicted MPG Vehicles Based On Two-Input
ISSN: 1992-8645 www.jatit.org E-ISSN: 1817-3195
Figure 13. Distribution Of Training Data And Checking Of ANFIS
5. CONCLUSION
Based on the results of the training and checking ANFIS, the chosen model of a two-input ANFIS best for prediction MPG, i.e. “Weight” and “Year”, has a minimum value of both training RMSE and RMSE checking. The training RMSE is 2,767 and checking RMSE check is 2,996. The greater the weight of the motor vehicle, the greater the amount of fuel needed to travel the same distance. Year car output also affects fuel efficiency, i.e. the higher the output, the higher fuel efficiency. For example predicted results, for car output in 1970 with a weight of 2000 kg, the fuel consumption is 25 miles per gallon, while the car to output the same year with a weight of 4000 kg, the fuel consumption of 10 miles per gallon. In comparison, for the car output in 1982 with a weight of 2000 kg, the fuel consumption is 38 miles per gallon, while the car to output the same year with a weight of 4500 kg, the fuel consumption of 22 miles per gallon.
REFRENCES:
[1] R. Syahputra, (2012), “Distributed
Generation: State of the Arts dalam Penyediaan Energi Listrik”. LP3M UMY, Yogyakarta, 2012.
[2] K. Ahn, H. Rakha, A. Trani, M. Van-Aerde,
(2001), “Estimating Vehicle Fuel
Consumption and Emissions Based on
Instantaneous Speed and Acceleration
Levels”, IEEE Pappers, New York.
[3] J. Kropiwnicki, (2002), “The Possibilities of
Using of The Engine Multidimensional
Characteristic in Fuel Consumption
Prediction”,
Journal of KONES Internal Combustion Engi nes 2002 No. 1-2.
[4] A. Cappiello, I. Chabini, E.K. Nam, (2003),
“A Statistical Model of Vehicle Emissions and Fuel Consumption”, MIT Papers, Massachusetts.
[5] R. Syahputra, (2013), “A Neuro-Fuzzy
Approach For the Fault Location Estimation
of Unsynchronized Two-Terminal
Transmission Lines”, IJCSIT, Vol. 5, No. 1, pp. 23-37.
[6] A. Jamal, R. Syahputra, (2011), “Model
Power System Stabilizer Berbasis Neuro-Fuzzy Adaptif”, Jurnal Ilmiah Semesta Teknika, Vol. 14, No. 2, 139-149, 2011, pp. 139-149.
[7] J.S. Wang, C.S.G. Lee, (2002),
"Self-Adaptive Neuro-Fuzzy Inference Systems for Classification Applications", IEEE Trans. on Fuzzy Systems, 10, 6, Dec, 2002.
[8] R. Syahputra, (2012), “Fuzzy Multi-Objective
Approach for the Improvement of
Distribution Network Efficiency by
Considering DG”, IJCSIT, Vol. 4, No. 2, pp. 57-68.
[9] R. Syahputra, I. Robandi, M. Ashari, (2012),
“Reconfiguration of Distribution Network with DG Using Fuzzy Multi-objective
Method”, International Conference on
Innovation, Management and Technology Research (ICIMTR), May 21-22, 2012, Melacca, Malaysia.
[10] M. Brown, C. Harris, (1994), “Neurofuzzy
Adaptive Modelling and Control”, Prentice-Hall International, Inc., UK.
[11] J.S.R. Jang, (1993), "ANFIS:
Adaptive-Network-based Fuzzy Inference System", IEEE Trans. Syst., Man, Cybern., 23, 665-685, June.
[12] Kartalopoulos S.V.,1996, Understanding
Neural Networks and Fuzzy Logic, IEEE Press, New York.
[13] R. Syahputra, I. Robandi, M. Ashari, (2014),
“Distribution Network Efficiency
Improvement Based on Fuzzy Multi-objective Method”. IPTEK Journal of Proceedings Series. 2014; 1(1): pp. 224-229.
[14] R. Syahputra, M. Ashari, I. Robandi, (2011),
ISSN: 1992-8645 www.jatit.org E-ISSN: 1817-3195
[15] R. Syahputra, I. Robandi, M. Ashari, (2011),
“Control of Doubly-Fed Induction Generator
in Distributed Generation UnitsUsing
Adaptive Neuro-Fuzzy Approach”.
International Seminar on Applied
Technology, Science and Arts (APTECS). 2011; pp. 493-501.
[16] R. Syahputra, (2012), “Distributed
Generation: State of the Arts dalam Penyediaan Energi Listrik”. LP3M UMY, Yogyakarta, 2012.
[17] H. Afrisal, M. Faris, G.P. Utomo, L.
Grezelda, I Soesanti, M.F. Andri, (2013), ”Portable smart sorting and grading machine
for fruits using computer vision”, Proceeding
- 2013 International Conference on Computer, Control, Informatics and Its Applications: "Recent Challenges in Computer, Control and Informatics", IC3INA 2013.
[18] A. Jamal, S. Suripto, R. Syahputra, (2015),
“Multi-Band Power System Stabilizer Model for Power Flow Optimization in Order to Improve Power System Stability”, Journal of
Theoretical and Applied Information
Technology (JATIT), Vol. 80, No. 1, 2015; pp. 116-123.
[19] R. Syahputra, I. Robandi, M. Ashari, (2014),
“Optimization of Distribution Network
Configuration with Integration of Distributed Energy Resources Using Extended Fuzzy
Multi-objective Method”, International
Review of Electrical Engineering (IREE), vol.9, no.3, 2014, pp. 629-639.
[20] R. Syahputra, I. Robandi, M. Ashari, (2014),
“Optimal Distribution Network
Reconfiguration with Penetration of
Distributed Energy Resources”, in Proceeding of ICITACEE 2014, Semarang, Indonesia.
[21] R. Syahputra, I. Robandi, M. Ashari, (2014),
“Performance Analysis of Wind Turbine as a Distributed Generation Unit in Distribution System”, IJCSIT, Vol. 6, No. 3, pp. 39-56.
[22] R. Syahputra, I. Robandi, M. Ashari, (2015),
“Performance Improvement of Radial
Distribution Network with Distributed
Generation Integration Using Extended
Particle Swarm Optimization Algorithm”,
International Review of Electrical
Engineering (IREE), vol.10, no.2, 2015. pp.293-304.
[23] R. Syahputra, I. Robandi, M. Ashari, (2015),
“Reconfiguration of Distribution Network with DER Integration Using PSO Algorithm”,
TELKOMNIKA, vol.13, no.3, 2015. pp.759-766.
[24] R. Syahputra, I. Robandi, M. Ashari, (2015),
“PSO Based Multi-objective Optimization for
Reconfiguration of Radial Distribution
Network”, International Journal of Applied Engineering Research (IJAER), vol.10, no.6, 2015. pp. 14573-14586.
[25] I. Soesanti, A. Susanto, R. Syahputra, (2015),
“Application of Particle Swarm Optimization Method for Batik Production Process”, Proceeding of International Conference on
Vocational Education and Electrical