RESEARCH AND APPLICATION ON VISUALIZATION
SYSTEM OF SPATIAL ELECTROMAGNETIC
ENVIRONMENT
1LI YUFANG
1
Teachers’ College of Beijing Union University, Beijing, China
ABSTRACT
A visualization system of spatial electromagnetic environment was designed and realized. The system realized 2D and 3D visualization of electromagnetic field with electromagnetic distribution situation, isograms, and propagation direction and path. The application result shows that the prototype system can provide the user an efficient visualization tool of spatial electromagnetic environment. This paper solve the model analysis based on the PE method, the establishment of a data visualization mapping model of the geomagnetic field; design space geomagnetic environment visualization system architecture, the design of which the main part of: Geomagnetic set of environmental parameters, unified modeling data analytic mapping drawn rendering, human-computer interaction, and modules; research and the geomagnetic environment visualization of key technologies, including unified model of the space the geomagnetic environmental data, to parse mapping and space method of generating a visual structure, as well as the geomagnetic environment rendering method.
Key words: Geomagnetic Field Simulation; Computer Simulation; Visualization; Electromagnetic
Situation; Electromagnetic Propagation Path
1. INTRODUCTION
Electronic warfare has become the main form and means of modern warfare, regardless of battlefield communications, operational command or battlefield direct confrontation, the ground magnetic waves play an important role. However, the current measurement of the intensity of the geomagnetic field mostly rely on special reception or detection equipment for a wide range of magnetic field detection coverage, the vast difficult to achieve even engineering. Moreover, to the magnetic field itself is not visible has greatly increased the difficulty of its analysis. Therefore, the space the geomagnetic environment simulation and its visualization research has a very important significance for modern electronic warfare, current research focus [1-4].
Geomagnetic field simulation and visualization analysis and decision-making in order to assist users, which requires visual processing multiple dimensions from two-dimensional, three-dimensional space of the geomagnetic field and provide intuitive visual form of auxiliary situational the user insight spatially magnetic field distribution, the geomagnetic direction of
Journal of Theoretical and Applied Information Technology 28th February 2013. Vol. 48 No.3
© 2005 - 2013 JATIT & LLS. All rights reserved.
ISSN: 1992-8645 www.jatit.org E-ISSN: 1817-3195
1712 indicate the strength of the geomagnetic energy; literature [11, 12] to achieve a geomagnetic environment visualization system, using direct volume rendering, surface rendering, slicing drawn geomagnetic data visualization. But neither is does not reflect the ground wave propagation direction and the propagation path. [13] Marked on the radar with five colors to represent the battlefield geomagnetic threat level, but did not exhibit space geomagnetic environment geomagnetic distribution trend. [14] Constructed complex geomagnetic environment for maritime battlefield visualization system, the use of multimedia technology to generate inter-frame animation geomagnetic trend of deduction and operational plan deployment and simulation. [15] Using VTK the geomagnetic scalar field and the geomagnetic vector field 3D visualization. [16] The plane interpolation color mapping to represent the geomagnetic distribution trend. However, there is still a lack of integration of space geomagnetic environment visualization system to fully support the two-dimensional and three-dimensional visualization of the geomagnetic field, as well as full support for visualization of geomagnetic distribution trend, the contour propagation direction path algorithm.
To solve the above problem, this paper studies and achieves space geomagnetic environment visualization systems. The system is mainly based on the PE geomagnetic field to solve the model, data visualization mapping model of the geomagnetic field; system architecture and key technologies; finally, the application examples of the system through application examples illustrate the function of the system and visual effects.
2. GEOMAGNETIC ENVIRONMENT
VISUALIZATION MODEL
2.1 Geomagnetic Field Solving Model
Parabolic equations (Parabolic Equation, PE) parabolic approximation of the geomagnetic field wave equation to calculate the radio wave propagation method [17] given parabolic equation model.
2.1.1 The two-dimensional problem
Consider arbitrary magnetic field component in the three-dimensional wave equation ψ and coordinate y in the Cartesian coordinate system independent, two-dimensional wave equation:
2 2
2 2
0
2 2 k n 0
x z
ψ ψ ψ
∂ +∂ + =
∂ ∂ (1)
Where k0 isthewaveconstantvacuum, n isthe mediumrefractive index.
Harmonic function is usually used to solve the wave equation fore−ik x0
form, can be defined alongthex-axisforward propagationof thewave function:
0
( , ) ik x ( , )
u x z =e− ψ x z (2)
The formula (2) issubstituted into theformula (1)isobtained:
2 2
2 2
0 0
2 2 2 ( 1) 0
u u u
ik k n
x x z
∂ + ∂ +∂ + − =
∂ ∂ ∂ (3)
Assume that the radio wave propagation process, the medium refractive index n hardly changeswith distancex
2
(n ) / x 0
∂ ∂ ≈ (4)
The formula (3) can be decomposed into:
0(1 ) 0(1 ) 0
ik Q ik Q u
x x
∂ ∂
+ − + + =
∂ ∂
(5)
Where Q is calledapseudo-differential operator,
and:
2 2
2 2
0
1
( , )
Q n x z
k z ∂
= +
∂
(6) Therefore twoparabolic equationswith respect to x:
0(1 )
ik Q u x
∂ = − −
∂ (7)
0(1 )
ik Q u x
∂ = − +
∂ (8)
The formula (7) is a Cartesian coordinate system, ground wave prior to propagation parabolic equation; the backward propagation of formula (8) is ignored in the PE method. Q for different approximate form can be obtained by different calculation elevation angle, the different precision two-dimensional parabolic equation model.
2.1.2 The three-dimensional problem
Cartesian coordinate system, the local magnetic field harmonic factore−i tω , uniform passive region of three-dimensional scalar wave equation
2 2 2
0 0
k n
ψ ψ
Still the set ground wave energy along the x-axis forward propagation, field harmonic functionisexpressed as
0
( , , ) ik x ( , , )
u x y z =e− ψ x y z (10)
Be substituted into (9), we obtain:
2
2 2 2
0 0
2 2 t ( 1) 0
u u
ik u k n u
x x
∂ + ∂ + ∇ + − =
∂ ∂ (11)
(11), the transverse Laplace operator is
2 2
2
2 2
t
y z
∂ ∂
∇ = +
∂ ∂ (12)
Still assumethatthemediumrefractive index n in the radio wave propagation process almost does not vary with distance x changes, i.e.
equation (4), then the formula (11) can be decomposed into:
0 0
( ik(1 Q))( ik(1 Q u)) 0
x x
∂ ∂
+ − + + =
∂ ∂ (13)
The pseudo-differential operator Q is
2 2 0
1
1 t 1
Q n
k
= + ∇ + −
[image:3.612.102.290.461.627.2](14) Formula (13) back and forth inthetwoproduct terms denotes the front of the radio wave propagation andaftertransmission.
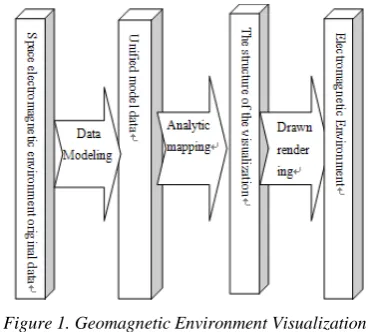
Figure 1. Geomagnetic Environment Visualization Mapping Model
2.2 Geomagnetic Field Mapping Model
Visualization
The geomagnetic environment data visualization to achieve the main include: of geomagnetic environment data modeling, geomagnetic unified model data analytic mapping, geomagnetic environment drawn rendering.
The geomagnetic environment data flow shown in Figure 1, the Unified Modeling geomagnetic visualization process the raw data of the geomagnetic environment first, and then after analytic mapping and rendering render the raw data into easy to understand or accept the image data is displayed; Meanwhile, the user can, according to the results of the analysis of the visualization process with each module of the entire visualization process interactive operation.
3. SYSTEM ARCHITECTURE AND KEY TECHNOLOGIES
Space geomagnetic environment visualization system is set by the geomagnetic environment parameters, and geomagnetic data solving, Unified Modeling data, analytical mapping, drawn rendering modules such as human-computer interaction. On modeling of geomagnetic environmental data parsed and visual mapping to generate visual structure, and be drawn rendering, visualization of the to achieve space geomagnetic environment.
NET framework, space geomagnetic visualization system based three-tier design, system applications from bottom to top: the data access layer, business logic, presentation layer. Geomagnetic environment visualization system in space first space geomagnetic environment parameter setting to calculate the geomagnetic data, and then the topographical data and the geomagnetic data read into the mapping transformation is generated through the data modeling the unified space geomagnetic environmental data model, comprising a rectangular grid data model, the triangular grid data model, and curve control point data model, and then generate its parsed and visual mapping space structure of the geomagnetic environment visualization, drawing and rendering and visualization structure geomagnetic field intensity distribution trend, geomagnetic contours, ground wave propagation paths to the performance of the geomagnetic distribution in the environment, users can also interact according to the displayed image and system operations such as scaling, rotation, translation, rendered image from perspective geomagnetic field distribution.
3.2 Space The Geomagnetic Environment Data Unified Model
Journal of Theoretical and Applied Information Technology 28th February 2013. Vol. 48 No.3
© 2005 - 2013 JATIT & LLS. All rights reserved.
ISSN: 1992-8645 www.jatit.org E-ISSN: 1817-3195
1714 topography, geomorphology. The system currently visualization of data, including topographic data, the energy distribution of the data of the receiving point of the geomagnetic field and wave propagation path of the control point data.
From modeling data format is divided, the geomagnetic environmental data modeling and data modeling is divided into rectangular grid data modeling, triangular mesh data modeling and curve control points. Rectangular grid data including terrain rectangular grid data and magnetic energy of a rectangular grid data; triangular mesh data including terrain triangle mesh data; curve control point data, including the data of the control point of the propagation path of the geomagnetic field and geomagnetic field contour data.
The rectangular grid data model Grid the by terrain mesh TerrainGrid, and geomagnetic energy grid PowerGrid that the Grid = <TerrainGrid, PowerGrid> the definition TerrainGrid = <TerrainNodeSet> TerrainNodeSet is the the topographical data points TerrainNode collection, TerrainNode = <xLocation, yLocation, zLocation>. xLocation, yLocation, zLocation of the point x-axis, y-axis, z-axis coordinate; Similarly, define PowerGrid = <PowerNodeSet> PowerNodeSet energy data point PowerNode collection, PowerNode = <xLocation, yLocation, zLocation, Power>, Power geomagnetic energy value of the point.
Curve control point data model Line by the geomagnetic field propagation path and the geomagnetic field contours Isoline constitute Line = <Path, Isoline>. Path = <PathNodeSet>, PathNode = <xLocation, yLocation, zLocation, Power>; Isoline = <IsolineNodeSet>, Isoline Node = <xLocation, yLocation, zLocation, Power>. With mesh data model, xLocation, yLocation, zLocation respectively the point of the x-axis, y-axis and z-axis coordinates of the point of, Power geomagnetic energy value.
3.3 Parse Structure Mapping And Spatial Visualization Method Of Generating
For a different model rendering, 3D model vertices to define by PositionColored, PositionNormalColored, PositionTextured, PositionNormalTextured structure, the structure of
the "Position", "Color", "Normal", "Texture" field denote the structure including vertex position, vertex colors, normal vectors, and texture coordinates, the of graphics vertex format the VertexFormat = <PositionColored PositionNormalColored PositionTextured
PositionNormalTextured>. Contains the structure of the position coordinates and color PositionColored = <Position, Color>; contains the location coordinates, the structure of the normal vectors and colors PositionNormalColored = <Position, Color, the Normal>; contains the structure of the position coordinates and texture coordinates PositionTextured = <Position, and Tu , Tv>; contains position coordinates, texture coordinates, and the structure of the normal vector PositionNormalTextured = <Position, Tu, Tv, the Normal>. Wherein the position coordinates of the Position = <x, y, and z> the Vertex Color = <A, R, G, B>, Tu and Tv on the application of 2D Cartesian coordinate positioning the respective pixel positions of the rectangular texture image x and y, the point the plane where the normal vector Normal = <Nx, Ny, the Nz>.
Representing geomagnetic energy situation, the contours of the geomagnetic field, ground wave propagation path vertex color used to the size of the performance of geomagnetic energy. The system in accordance with the maximum energy value and the minimum energy value for each of the vertex colors R, G, and B of each component assigned proportionally to reflect the size of the energy. Geomagnetic energy calculated threshold value is set, when less than a threshold value Fu certain minimum, and therefore when the display energy less than or equal to the minimum value point is that no geomagnetic energy reaches, so that it is not visible, is set to transparent visible point of the energy The opacity of the color set by the user interaction.
3.4 Drawn Rendering Method
Drawing and rendering of space geomagnetic environment vertex processing and pixel processing is divided into two main functional modules perform. Vertex processing is the attributes of all the vertices of the three-dimensional geomagnetic environment through the world transform observe the transformation, projection transformation of the computer display window on vertex, vertex position coordinates attribute generated according to the setting of the light source and material color. Vertex color pixel processing algorithm gradual transition to color mixing, filling the entire plane, in order to achieve the draw of the geomagnetic environment rendering.
The system uses high-level shading language HLSL defined processing vertex shader and pixel shader is written to the file, the conversion is complete 3D graphics rendering code that can be run in the graphics card GPU programmable pipeline to enhance the vertex processing and pixel processing capacity.
In order to not only show the low terrain changes, and more realistic terrain, the system uses the terrain the mixed textures texture mapping method based on terrain height and tilt. First, based on terrain height and tilt were calculated in each point in the texture blending proportion, according to the texture mixing ratio calculated per point color values after mixing, calculated the point of a variety of materials, textures proportion, material corresponding point at the R, B, G value is multiplied by the proportion of the respective texture can calculate the point of rendering the texture colors R, B, G value, so that the texture to cover the surface of the three-dimensional terrain model, terrain texture rendering.
The system also apply rules rectangular grid automatically draw the contours of principle, the energy value of the energy model of rectangular grid points interpolation especially network edge equivalents and equivalent points are connected in order to generate with the terrain changes on the surfaces of the earth's magnetic field distribution or magnetic energy in the space cross-sectional xz coordinate plane f (x, y) = c the trajectory distribution line. Where c is the energy value of the energy contours of a point on the visualization system, according to the contours energy value different from the size of the energy of c, also different contour colors, from red to blue, indicating that the geomagnetic energy gradually reduced.
4 .APPLICATION EXAMPLES
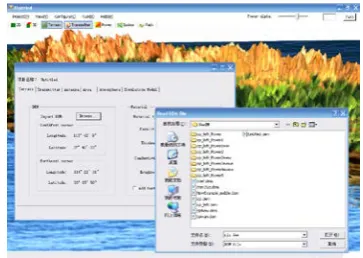
[image:5.612.320.502.236.365.2]In this paper, the design of space geomagnetic environment visualization system to achieve the geomagnetic energy distribution trend geomagnetic field contours, ground wave propagation path display space geomagnetic environment visualization system operation interface is shown in Figure 2. Geomagnetic environment of a region of space visualization, for example, the rules grid digital elevation model data size used in the region 63810 * 59850, a resolution of 90 meters.
Figure 2. Geomagnetic Environment Visualization System Running Interface
Journal of Theoretical and Applied Information Technology 28th February 2013. Vol. 48 No.3
© 2005 - 2013 JATIT & LLS. All rights reserved.
ISSN: 1992-8645 www.jatit.org E-ISSN: 1817-3195
[image:6.612.91.524.70.239.2]1716
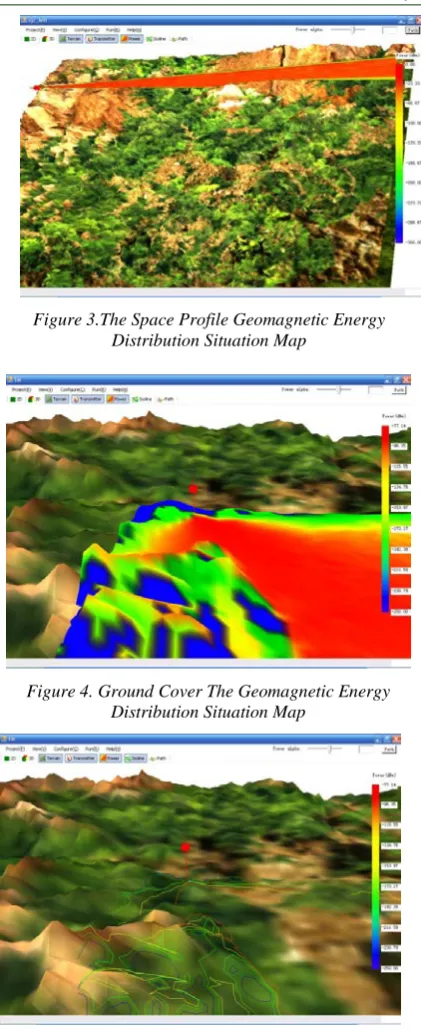
Figure 3.The Space Profile Geomagnetic Energy Distribution Situation Map
Figure 4. Ground Cover The Geomagnetic Energy Distribution Situation Map
Figure 5 Magnetic Field Isolin
Figure 6. Wave Propagation Path Diagram
Figure 5 is a ground covering Figure 4 in accordance with the geomagnetic energy distribution draw the contour map of the earth's magnetic field. Described by contour density level to determine the trend of the geomagnetic energy contours of geomagnetic energy data, allows users a more intuitive and convenient observation and analysis of geomagnetic distribution.
Figure 6 is a display portion to wave propagation path of the reception point. Visualization system to achieve the emission point, the receiving point, intermediate transfer point, the propagation path, each receiving point receives energy size, propagation path of energy display, combined with terrain generation, reached the ground wave propagation of three-dimensional simulation of realistic display for easy analysis the influence of the geomagnetic environment on the energy loss.
5 .CONCLUSIONS
Application examples experiments, indicating that the system is capable of multiple dimensions from two-dimensional, three-dimensional space of the geomagnetic field visualization, visualization of the distribution of geomagnetic environment situation maps, contour maps, the direction of propagation path diagram a variety of visualization methods, the system is able to provide users with a more efficient space geomagnetic environment visual analysis tools.
[image:6.612.90.301.86.602.2]REFERENCES:
[1] Wu Ying nian, Zhang Lin. Zhang Lifang,The geomagnetic environmental simulation and visualization study [J] Journal of System Simulation, 2009, 21 (20): 6332-6338
[2] Zhang Lifang, The geomagnetic field data visualization system design and implementation of [D]. Beijing: Beijing University of Science and Technology, 2006. [3] Sreedevi B, Harischandra Rao N S. Role of
EMC in Packaging of Electronic Warfare Systems [C]// International Conference on Electromagnetic Interference and Compatibility. USA: IEEE, 2003: 15- 22.
[4] Spezio A E. Electronic Warfare Systems [J]. IEEE Transactions on Microwave Theory and Techniques (S0018-9480), 2002, 50(3): 633-644.
[5] Brookner E, Cornely P R, Lok Y F. AREPS and TEMPER-Getting Familiar with these Powerful Propagation Software Tools [C]// IEEE Radar Conference (S1097-5659). USA: IEEE, 2007: 1034-1043.
[6] Bartsch M, Clemens M, Hippler T. Advanced Electromagnetic Field Visualization Using the Virtual Reality Modeling Language Standard [J]. IEEE Transactions on Magnetics (S0018-9464), 2001, 37(5): 3604-3607.
[7] Zhou Guoxiang, Wang Chunyan. Based on the OpenGL 3D non-uniform FDTD grid pattern blanking process [J]. Application Research of Computers, 2008, 25 (1): 285-287.
[8] Yang Chao, Chen Peng, Wei Yingmeiradar maximum detection range of
three-dimensional visualization and
realization [J]. Computer Engineering and Applications, 2007, 43 (11): 245-248.
[9] Zhou Qiao, Xu Qing, LI Jiansheng.
Geomagnetic environment the design and development of the visual system [J]
Microcomputer Information, 2008, 24 (2):
249-251.
[10] Zhou Qiao, Xu Qing, Chen Jingwei
geomagnetic environment modeling and
three-dimensional visualization [J]
Geomatics Science and Technology, 2008, 25 (2): 112-115.
[11] YangYuFang Guangyou, Yang Mei aradar geomagneticenvironment simulation, design
and realization [J]. Microcomputer
Information,2008, 24(4): 194-196.
[12] Chao Yang, Jiangbin Xu, Hanchen Song, Lingda Wu. Interactive Volume Visualization for Electromagnetic Environment on 3D Globe [C]// International Symposium on Computer Network and Multimedia Technology. USA: IEEE, 2009: 1-4.
[13] Patterson W L. Advanced Refractive Effects Prediction System (AREPS) [C]// IEEE Radar Conference (S1097-5659). USA: IEEE, 2007: 891-895.
[14] Yaoming Yang, Xiaoan Tang, Hong Chen, Huan Li. Study on Visualization Simulation of Complex Electromagnetic Environment for Tactics Application [C]// International Conference on Information and Automation. USA: IEEE, 2008: 1823-1827.
[15] Xiao He, Heming Yun, Bai Zhongjian based on the VTK 3D visualization of the geomagnetic fieldand[J] Computer Science and EngineeringApplications, 2007, 27(11):
2773-2775.
[16] Wang Chun SONG Wen-wu, Zhang Chuandong equipment based the triangular mesh geomagnetic data interpolation and visualization method [J]. Environmental Engineering, 2008, 5(1): 24-27.
[17] M F Levy. Parabolic Equation Methods for Electromagnetic Wave Propagation [M]. London, UK: IEE Press, 2000.
[18] Hu G.P., Wang H.Y, Research on Similarity between Generalized Molecular Graphs, IEIT Journal of Adaptive & Dynamic Computing, 2012(1), Jan 2012, pp:22-27. DOI=10.5813/www.ieit-web.org/IJADC/201 2.1.5
[19] Chen L., Zhao S.G., ZhangL.J., Zhang W.B, Real-time Large-deformation Cloth Simulation, IEIT Journal of Adaptive & Dynamic Computing, 2012(1), Jan 2012, pp:28-34.