PREDICTION OF SOFTWARE RELIABILITY USING
COBB-DOUGLAS MODEL IN SRGM
B.ANNIPRINCY1, Dr.S.SRIDHAR2
1Research Scholar, Sathyabama University, Chennai
2Dean-Cognitive & Central Computing Facility, RV College of Engineering, Bangalore-560059
E-mail: [email protected] , [email protected] , [email protected]
ABSTRACT
Software reliability refers to the likelihood of software to function without failure for a specified duration of time under few conditions. Software testing indicates the process that identifies the faults in totality and worth of developed computer software. Yet, running software testing for a longer period will not result in bug free software and high reliability. Further, good quality software will be ensured with an optimum amount of code. The amount of faults eradicated will not depend on testing time alone. Hence, a two dimensional software reliability growth model is being proposed, which makes use of Cobb- Douglas production function that includes testing time and testing coverage effects on the number of faults removed in the software system. Complete elimination of faults from software is impossible because of software complexity and nature of testing team. This event is termed as imperfect debugging. Error generation is defined as the process in which the faults are imperfectly removed and additional faults emerge from these existing faults. An S-shaped model with imperfect debugging and fault generation is being developed in this paper to provide solutions for the problems associated with software testing.
Keywords: Software Reliability, Two Dimensional, Non-Homogeneous Poisson Process (NHPP), Testing Coverage (TC), Cobb-Douglas Model, Imperfect Debugging, S-Shaped Model.
1. INTRODUCTION
Software is experiencing a quick progress in the current world. Thus, quality, reliability and customer satisfaction have turned out to be the chief objectives for software engineers and most significant care for software developing industries. The main key for controlling quality during software development is testing [7]. The quality features of the software system may include maintainability, portability, usability, security, reliability, availability and many more. Software reliability is the most active attribute that help in assessing and envisaging the operational quality of the product [3]. Software Reliability is defined as the chances of software to operate with no failure for a known period of time under specified conditions. Software reliability aspires to increase the possibility of the designed program to function properly as directed by the customers [1]. The entire reliability of the software depends on the precise modeling of software reliability and prediction of its feasible trends. SRGMs support well to resolve several important metrics like time period, number of remaining faults, mean time between failures (MTBF) and mean time to failure (MTTF) in an easy way [6].
Predicting the future action from the past knowledge is one among the major aims of system analysis. This goal can be accomplished with the construction of statistical model that allows quantification of uncertainties and learning from data. More studies have been concentrated in software reliability engineering for the past thirty years and several software reliability growth models (SRGM) have been introduced [2]. The random nature of the software failure occurrence or the software fault detection phenomenon gets modified with the alterations in fault-target, the difference in the fault density for each module and many other aspects [4, 5]. Software is one among the safety issues that is vital in digital system safety measurement. During the utilization of safety-critical software, several processes like formal verification and validation is highly essential to illustrate the acquiescence with several regulatory needs [8].
considering the software failure-occurrence or the soft-ware fault-detection phenomenon to be random variables [5]. The testing effort and the effectiveness of the test cases are the chief elements from the software testing point of view. Several models that were so far known either believe the consumption rate of testing resource to be unvarying or do not take the testing effort or its testing effectiveness into account plainly [1]. At the time of software testing, enormous testing-effort will be used up and this specifies the effective way of detecting errors in software. The testing-effort consumed can be altered by various distributions [6]. When the software reliability growth models are applied to a safety- critical software system, few of its drawbacks has to be kept in mind as well. The expected total number of inherent software faults computed through the software reliability growth models that show large response to time-to-failure data is one among the severe shortcomings of it [8] [14].
Predictive models and assessment models are the two key classifications found within these models. Predictive models concentrates on the software reliability in the earlier phase of life cycle like at the requirements, at the beginning stage of design, at the deeper design level in a waterfall life cycle process and in the initial spiral of a spiral software development process. Predictive models help in bringing out the hazards that would be encountered during the development of software under a given set of prerequisites and for particular personnel prior to actual beginning of project. Assessment models use the failure data collected during the initiation of software integration to compute the present and upcoming project software reliability.
The ability of few of the system’s characteristics to undergo expansion or modifications over time is an essential aspect of many of the systems and this has to be considered during the construction of a statistical model for the system. For instance, the statistical model may be a usual method to compute software reliability. The parameters of this model are estimated in common from the data existing on software failures and the model may be acquired by monitoring the overall trend of increase in reliability during the debugging process. Speaking in another way, a software reliability growth model dictates the way the examination of failures and correction of the faults that lay beneath influence the software reliability [10]. These faults are similar to the faults that arise during the testing and debugging of software in a software development process. Analytical tractability can be guaranteed in
majority of the models by assuming that a software fault is instantly fixed upon detection, thereby causing no new faults to emerge at the time of debugging. In reality, the duration taken to debug a fault has a limit or end and straightly affects the residual number of faults, which in turn affects the reliability of software application [16].
Software reliability is accepted extensively as one of the most essential features of software quality and it has initiated a good deal of research for producing approaches that quantify it. The SRGM is developed with the final intention of producing better reliability inference and prediction methods, which can be employed for software development process [17]. The residual faults in the software system frankly donate to the failure rate and lead to software unreliability. Hence, the issue associated with the measuring of software reliability takes the residual number of faults in the software into account to produce a solution. While organizing maintenance activities, the number of faults that is resident in the code also serves as a significant measure for the software developer [18]. Analysis have depicted that majority of the faults experienced by customers are replicated again during the debugging of faults detected at the time of testing. As a consequence of imperfect debugging, the residual number of faults in the software gets affected and sometimes become the main reason for unreliability, leading to customer disappointment.
2. RELATED WORKS
A wide range of researches have been presented in the literature for developing software reliability growth models in the presence of imperfect debugging and error generation. The aim behind such studies is to enhance the software performance. These studies can be placed in one of the two categories. The first category highlights the empirical analysis of data gathered from software projects. The second category deals with the developments of models for quantitative evaluation of software performance. A concise review of some recent researches is presented here.
holds well on the empirical system test data available, when changes in values of stability and curve fit are accomplished. This implies that the method was appropriate to be applied in an environment that was different from the original. With the application of the SRGMs to failures during functional testing, predictions with low relative error has been obtained. This has made SRGMs to be a valuable method for yielding good estimates of the total number of failures expected during functional testing.
During the past few years, plenty of Software Reliability Growth Models (SRGM) has been introduced to greatly assist the engineers and managers in tracking and measuring the growth of reliability as improvements in software is being made. Yet, some studies have shown that the delayed S-shaped model may fail to finely fit the software failure data as the testing-effort used up for fault detection varies. Chin-Yu Huang et al. [1] have first reviewed the logistic testing-effort function that helps in expressing the amount of testing-effort spent on software testing. They have explained the way of incorporating the logistic testing-effort function into both exponential type and S-shaped software reliability models. In addition, the proposed models are elucidated under both ideal and imperfect debugging conditions. The proposed models were applied to two real data sets and the results were compared with those obtained from conventional SRGM. The experimentation results have proved that the predictions obtained with the proposed models were better and the logistic testing-effort function was more appropriate for direct incorporation into both exponential-type and S-shaped software reliability models.
V. B. Singh et al. [9] have made an analysis on how the development of various software reliability growth models, where the fault detection process rely on both the number of residual fault and testing time, have been made. In addition, they have seen that how these models can be deduced as the delayed fault detection model by using a delay effect factor. They have proposed four new SRGMs, which depend on the power function of the testing time concept with the assumption that two kinds of faults were present in the software. These faults were the leading faults and the dependent faults. Leading faults can be eradicated immediately after a failure is being detected. The dependent faults on the other hand are masked by leading faults and hence to eliminate the depending faults, their related leading faults are to be got rid
first with a debugging time lag. Real software error data have been utilized to test these models for obtaining their goodness of fit, predictive validity and applicability.
Lev V. Utkin et al. [10] have given an outline for combining imprecise Bayesian methods with likelihood inference and it is presented based on the reliability growth models. The central theme behind this approach is to partition a set of concerned model parameters into two sub-sets that are connected to various basic features of the overall model and then, the Walley’s idea of imprecise Bayesian models that are associated with one of the sub-sets of the model parameters is combined with maximum likelihood estimation of the remaining sub-set. The Bayesian model is developed according to the first subset and statistical data, which then offers lower and upper predictive probability distributions based on the second set of parameters. Estimation of these additional parameters are then done using a maximum likelihood method, which depends on a new proposition for maximum likelihood estimation over sets of distributions following from imprecise Bayesian models for the other subset of parameters. The application of this hybrid method to reliability growth models and regression models is being demonstrated along with the discussion of topics that are necessary to validate and promote the framework.
N. Ahmad et al. [4] have presented a paper that makes a comparison on the predictive ability of the two familiar software reliability growth models (SRGM), namely, the exponential growth model and inflection S-shaped growth model. They have analyzed the exponentiated Weibull (EW) testing-effort functions initially and have conferred about the exponential type and inflection S-shaped type SRGM with EW testing-effort. Later on, an analysis on the actual data applications was made and the predictive capability of both the SRGMs was compared graphically. Results have shown that the prediction capability of the inflection s-shaped type SRGM is far better than the exponential type SRGM.
extended to cases where differentiation exists between both the failure observation and fault elimination testing processes.
S. M. K. Quadri et al. [6] have presented an approach to build software reliability growth model depending on Non-Homogenous Poisson Process. Here, the time dependent behaviors of testing-effort expenditures that are explained by Generalized Exponential Distribution (GED) have been taken into account. Software Reliability Growth Models (SRGM) that works on the basis of NHPP are developed to incorporate the (GED) testing-effort expenditure at the time of software testing. An assumption was made that the error detection rate to the amount of testing-effort used up during the testing phase is proportional to the existing error content. Least Square and the Maximum Likelihood estimation approaches are used to estimate the model parameters and numerical experiments were carried out on real data from variety of software projects to examine the software measures. The analysis and the comparison on the results of evaluation have proved that the proposed SRGM with (GED) testing effort has a reasonably improved fault prediction capability than the other prevailing techniques and it is moderately suitable for real time applications. The model is applicable to a large community of software systems. The optimal release policy for this model on the basis of cost-reliability principle is discussed as well.
Testing-time observed at the instant while a stochastic characteristic of the software failure-occurrence time or software failure-failure-occurrence time-interval changes is termed as change-point. The change-point on the software reliability growth process has a greater effect on the accuracy of software reliability evaluation that relies on software reliability growth model (SRGM). Shinji Inoue and Shigeru Yamada [5] have proposed an SRGM with the effect of the change-point based on a bivariate SRGM. To conduct an accurate software reliability evaluation, they have considered the software reliability growth process to rely on the testing-time and testing-effort factors at the same time. Additionally, they have explained an optimal software release problem for obtaining optimal testing-effort expenditures depending on our model. Moreover, they have numerically illustrated the software reliability assessment based on their bivariate SRGM and have utilized real data to estimate the optimal testing-effort expenditures.
R. Satya Prasad et al. [11] have suggested that the software reliability may be treated as a measure of how accurately a software system operates.
Enhancing software processes will lead to the achievement of a reliable software product. Software process improvement involves steps that watch software development practices and energetically looks for the means of increasing value, decreasing errors, raising productivity and improving the developer’s working atmosphere. Statistical process control (SPC) was one of the most excellent methods that exist to monitor and control the software process. SPC apply proper statistical tools to processes for providing uninterrupted enhancements in quality, reliability of software products and services and productivity in the labor force. Here, they have proposed a control method, which relies on time between failure observations using half logistic distribution, with Modified Maximum likelihood Estimation (MMLE) that depends on Non Homogenous Poisson Process (NHPP).
3. SOFTWARE RELIABILITY GROWTH MODELS WITH TWO TYPES OF IMPERFECT DEBUGGING
This paper deals with the development of a two-dimensional model that combines the effect of both the testing time and testing coverage to get rid of the unreliable faults latent in the software. It is assumed that the number of faults removed from the software in a given time rely on the entire testing resources available to the testing team. This testing resource will be a combination of both the testing time and testing coverage. The cobb-douglas production function has been employed here to develop the two dimensional model that includes the effect of both the testing time and the testing coverage on the number of faults eliminated from the software system. The faults in the software may not be eradicated ideally and this imperfect removal of faults would cause additional faults to be generated. In this paper, an s shaped model with imperfect debugging and fault generation is being developed. The proposed method is implemented using JAVA and it is validated on real data sets.
Time Dependent Model
process
{
N
(
t
);
t
≥
0
}
is defined that represents the cumulative number of software faults detected by testing timet
. The SRGM based on NHPP isformulated as:
! )) ( exp( ) ( } ) ( Pr{
n t m t
m n t N
n − ⋅ =
= (1)
Where
=
n
0, 1, 2, 3….)
(
t
m
is the mean value function of thecounting process
N
(
t
)
Testing Coverage Based Modeling
The testing coverage based software reliability growth model can be formulated as in eqn. (2)
( )
( )
t(
N m( )
t)
ct c dt
t dm
− − =
1 ' )
( (2)
Where,
)
(
t
m
is the expected number of faults detectedin the time interval
(
0
,
t
]
)
(
t
c
is the testing coverage as a function oftime
t
.N
is the constant that indicates the number of faults lying dormant in the software at the initial stage of testing.Here
c
(
t
)
defines the percentage of the coded statements that has been observed until time t. So,)
(
1
c
t
−
defines the percentage of the codedstatements which has not yet been covered until time
t
. Then, the first order derivative ofc
(
t
)
, denoted byc
'
(
t
)
, represents the testing coverage rate.Therefore, function
( )
( )
t
c
t
c
−
1
'
can be taken as ameasure of the fault detection rate. In one dimensional SRGM with testing coverage we need to define coverage function
c
(
t
)
. But, in a two dimensional modeling approach a coverage function is not required to be defined and it can be estimated directly from the data.S-Shaped Flexible Model
In 1992, Kapur and Garg developed an S-shaped model with an assumption that a few extra faults could be eliminated without really affecting the system, upon the removal of various faults from the software. The improved Kapur garg model is
derived by employing a logistic rate as the detection rate to capture the effect of both the imperfect debugging and fault generation. This model assumes a Non-Homogeneous Poisson Process. The basic assumptions of the model are as follows:
1. Failure /fault removal phenomenon is modeled by NHPP.
2. During execution, software is subject to failures caused by residual faults in the software.
3. Failure rate is uniformly affected by all the faults remaining in the software.
4. Fault detection / removal rate may vary at any time instant.
The differential equation representing the rate of change of cumulative number of faults detected in time
t
is given in Eq. (3)( )
(
)
(
())
exp 1
' N m t
bt b t
m −
− − =
β (3)
The Eq. (4) gives the mean value function of the number of faults detected in time
t
( )
(
)
(
τ)
β
τ τ
b b N
m
− +
− − =
exp 1
) exp( 1
(4)
Where,
b
is the rate at which a fault is detected/removed in the software.m
is the mean number of faults detected/ corrected corresponding to testing timet
.β
is the constant.x
is the rate of error generation.p
is the probability of imperfect debugging.Two-Dimensional Modeling
A software reliability growth model is highly necessary to obtain high precision software reliability. This software reliability growth model should provide solution to problems associated with both testing time and testing coverage (the percentage of code covered of the software). For this reason, a two dimensional software reliability growth model that considers the joint effect of testing time and testing effort on the number of faults removed in the software is being developed. This two dimensional model depends on the Cobb Douglas production function.
Cobb Douglas Production Function
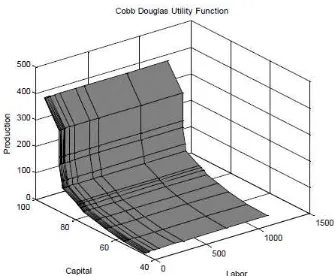
The Cobb–Douglas functional form of production functions is generally employed to indicate the relationship of an output to its inputs. It was proposed by Knut Wicksell (1851–1926) and tested against statistical data by Charles Cobb and Paul Douglas in 1900–1928. The Cobb-Douglas function has taken an easy view of the economy in which production output depends on the amount of labor engaged and the amount of capital invested. Despite the presence of several factors that influence economic performance, their model was shown to be extremely accurate.
The mathematical form of the production function is given as in eqn. (5).
ν ν
K
AL
Y
−=
1 (5)Where,
Y
is the total production per year.L
is the labor input.K
is the capital input.A
is the total factor productivity.ν
is the elasticity of labor which is constant and determined by available technology. [image:6.595.107.275.592.730.2]Figure. 1 graphically show the total production influenced due to change in the proportion of labor and capital.
Figure.1 Two-input Cobb-Douglas production function.
The following assumptions were made by Cobb and Douglas.
1. If labor or capital extinct, then production will extinct as well.
2. The marginal productivity of labor is proportional to the amount of production per unit of labor.
3. The marginal productivity of capital is proportional to the amount of production per unit of capital.
Cobb Douglas Model
Software Testing operates system or application under organized situations and evaluate the results. The controlled conditions should incorporate both normal and abnormal conditions. Testing should purposely try to make things fail for determining whether things occur when they shouldn't occur or things don't take place when they should. It is oriented to detection. The testing team possesses several resources of testing to ensure that software developed is of high quality. These include software testing man hours, CPU time, testing effort testing coverage etc.
α
α
τ
≅
s
u
1
−
0
≤
α
≤
1
(6)Where,
τ
is the testing resourcess
is the testing timeu
is the testing coverageα
is the Effect of testing timeLet
{
N(s,u),s≥0,u≥0}
be a two-dimensional stochastic process that describes the cumulative number of software failures by times
and testingcoverage
u
. A two-dimensional NHPP with amean value function
m
(
s
,
u
)
is formulated as(
)
(
)
(
(
)
)
exp(
(
,)
)
, 0,1,2... !, ,
Pr = = −msu n=
n n u s m n u s
N (7)
(
su)
λ(
ζ ξ)
dζdξm
s u
∫∫
=
0 0 ,
, (8)
Two-Dimensional S-Shaped Model
( )
(
τ)
(
( )
τ)
β
τ N m
b b m − − + = exp 1
' (9)
The mean value function of the number of faults detected with testing resources x using the initial condition
x
( )
0
=
0
is given as in eqn. (10).( )
(
)
(
τ)
β τ τ b b N m − + − − = exp 1 ) exp( 1 (10)Now the testing resource of one dimensional S-shaped model is extended to a two dimensional problem. Using the cobb-douglas production, the corresponding mean value function is given by eqn. (11).
( )
(
(
)
)
(
α α)
α α β τ − − − + − − = 1 1 exp 1 exp 1 u bs u bs N
m (11)
In the above two-dimensional mean value function, if
α
=
1
, the above mean value functioncan be viewed as a traditional one dimensional time dependent SRGM and if
α
=
0
, it becomes a testing coverage dependent SRGM.Two-Dimensional S-Shaped Model with Imperfect Debugging
In practice, debugging process will be imperfect. Two possibilities may happen at the time of fault removal process. The first possibility may be that the fault may be considered to be perfectly removed. But in reality, the fault is not repaired clearly and hence results in similar kind of failure yet again. The second possibility may be the introduction of new faults during correction. This is of high risk because in the first case, the total fault content remains unchanged. While in the second case, error generation would cause a raise in fault content. The effects of both sort of imperfect debugging that occurs during testing phase are included in our proposed model. The rate equation for flexible model with imperfect debugging and error generation can be written as in eqn. (12).
( )
[
( )
τ( )
τ]
β τ
τ N xm m
bp m
dt d
b + −
+ =
−
exp
1 (12)
Logistic function is being employed to incorporate the effect of imperfect debugging and error generation. By solving the above equation using initial conditionN(0)=0, we get
( ) ( ) ( ) ( ) + + − − = − − − − x p b x p bp x N t N 1 1 exp exp 1 1 1 1 τ τ β
β (13)
Reliability Evaluation
Software evaluation is a most important event in quantitative software reliability assessment. The software reliability function signifies the probability that a software failure does not occur in time-interval
(
t,t+x)(
t≥0,x≥0)
, provided that thetesting team or the user operation has been going up to time
t
. In two dimensional SRGM, softwarereliability can be evaluated in an operation phase where it is assumed that the testing coverage is not expanded. We can derive the probability that the software failure does not occur in time-interval
[
, +ω]
(
>0,ω>0)
π π π s s
s that testing has
been going up to
s
π and the value of testingcoverage has been attained up to
u
π by testingtermination time
s
π as:(
s u)
{
[
m(
(
s)
u k)
m(
s u k)
]
}
Rω/ π, π =exp− π +ω, π / − π, π /
(14) Where
k
indicates the set of parameter estimatesof a two dimension SRGM
4. RESULTS AND DISCUSSION
SRGM is termed as a tool that can be used to assess the software quantitatively, develop test status, schedule status and observe the changes in reliability performance. Software reliability assessment and prediction is essential for assessing the performance of software system. In this paper, an effective software reliability growth model with two kinds of imperfect debugging is being developed. In this segment, the sample outputs that are produced during the execution of program are being described well.
Here, the reliability of the software is recognized through the S-shaped Cobb-Douglas function. This paper utilizes both the testing time and testing coverage to identify the reliability of the software. A data set with failure number, failure interval and also day of failure is given as the input to the SRGM tool. The tool identifies the faults and gives the reliability parameters as output as shown in Fig.2.
Comparative Analysis
Using the proposed imperfect-debugging model, we now show a real numerical illustration for software reliability measurement. Here, in order to validate the imperfect-debugging model, the AE and MSF are selected as the evaluation criteria.
The Accuracy of Estimate (AE) is defined as in eqn. (15).
a a
M a M
AE= − (15)
Where
M
a is the actual cumulative number of detected errors after the test, anda
is the estimated number of initial errors. For practical purposes,a
M
is obtained from software error tracking after software testing.The mean of Squaraed Errors (Long-term predictions) is defined as in eqn. (16).
( )
[
]
∑
=− =
k
i
i i m t m k MSE
1
2 1
(16)
Where
m
( )
t
i is the expected number of errors attime
t
iestimated by a model andm
iis theobserved number of errors at time
t
i. MSE givesthe qualitative comparison for long-term predictions. A smaller MSE denotes a minimum fitting error and better performance.
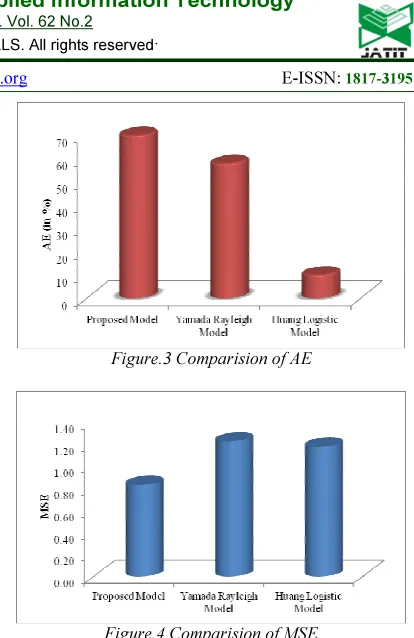
The proposed method is compared with Yamada Rayleigh Model and Huang Logistic Model. The comparison values of the proposed method, Yamada Rayleigh model and Huang Logistic Model are given in Table 1.
Table 1: Comparative results of different SRGM Model a r AE(%) MSE
Proposed Model 628.87 0.0824 69.97 0.83 Yamada Rayleigh Model 565.35 0.0196 57.91 1.23 Huang Logistic Model 394.08 0.0427 10.06 1.18
[image:8.595.79.510.67.417.2]The graphical representation of MSE and AE for the proposed method, Yamada Rayleigh model and Huang Logistic Model are shown in Fig. 3 and Fig.4 respectively.
Figure.3 Comparision of AE
Figure.4 Comparision of MSE
It is evident from the tables and graphs that the proposed method is more effective and achieves improved AE and reduced MSE than the other existing methods of comparison.
5. CONCLUSION
In this paper, common methods have been developed to obtain new generalized models, which is based on uncomplicated assumptions and unvarying with the basic software reliability growth modeling that rely on NHPP. The proposed model establishes an extensive theoretical framework to account for the interaction between diverse dimensions of software reliability metrics. The dynamics of testing time of the software and the testing coverage has been incorporated to yield a two dimensional framework. The Cobb Douglas production function is being employed to capture the joint effect of testing time and testing coverage. Validation of the proposed model is carried out on real data sets and analyses are made using goodness of fit criterion. The proposed SRGM is proved to have improved performance than other SRGMs and offer a reasonable predictive capability for the actual software failure data. Hence, this model can be applied to a broader classification of software.
REFERENCES
[image:8.595.301.508.76.395.2]Dependent Software Reliability Growth Models," IEEE Transactions on Reliability, Vol. 56, No. 2, pp. 198-211, Jun 2007.
[2] P. K. Kapur, H. Pham, Sameer Anand and Kalpana Yadav, "A Unified Approach for Developing Software Reliability Growth Models in the Presence of Imperfect Debugging and Error Generation," IEEE Transactions on Reliability, Vol. 60, No. 1, pp. 331-340, Mar 2011.
[3] Khurshid Ahmad Mir, "A Software Reliability Growth Model," Journal of Modern Mathematics and Statistics, Vol. 5, No. 1, pp. 13-16, 2011.
[4] N. Ahmad, S. M. K Quadri and Razeef Mohd, "Comparison of Predictive Capability of Software Reliability Growth Models with Exponentiated Weibull Distribution,"
International Journal of Computer Applications, Vol. 15, No. 6, pp. 40-43, Feb 2011.
[5] Shinji Inoue and Shigeru Yamada, "A Bivariate Software Reliability Model with Change-Point and Its Applications," American Journal of Operations Research, Vol. 1, No. 1, pp. 1-7, Mar 2011.
[6] S. M. K. Quadri, N. Ahmad and Sheikh Umar Farooq, "Software Reliability Growth modeling with Generalized Exponential testing –effort and optimal Software Release policy," Global Journal of Computer Science and Technology, Vol. 11, No. 2, pp. 27-42, Feb 2011.
[7] Carina Andersson, "A replicated empirical study of a selection method for software reliability growth models," Journal of Empirical Software Engineering, Vol. 12, No. 2, pp. 161– 182, Apr 2007.
[8] Han Seong Son, Hyun Gook Kang and Seung Cheol Chang, "Procedure for Application of Software Reliability Growth Models to NPP PSA," Journal of Nuclear Engineering and Technology, Vol. 41 No. 8,pp. 1065-1072, Oct 2009.
[9] V. B. Singh1; Kalpana Yadav, Reecha Kapur and V. S. S. Yadavalli, "Considering the Fault Dependency Concept with Debugging Time Lag in Software Reliability Growth Modeling Using a Power Function of Testing Time,"
International Journal of Automation and Computing, Vol. 4, No. 4, pp. 359-368, Oct 2007.
[10]Lev V. Utkin, Svetlana I. Zatenko and Frank P.A. Coolen, "Combining imprecise Bayesian and maximum likelihood estimation for
reliability growth models," In Proc. of the Sixth International Symposium on Imprecise Probability: Theories and Applications, Durham, UK, 2009.
[11]Dr. R. Satya Prasad, K. Ramchand H Rao and Dr. R.R.L. Kantha, "Software Reliability Measuring using Modified Maximum Likelihood Estimation and SPC," International Journal of Computer Applications, Vol. 21, No.7, pp. 1-5, May 2011.
[12]Andy Ozment, "Software Security Growth Modeling: Examining Vulnerabilities with Reliability Growth Models," Journal of Advances in Information Security, Vol. 23, No. 2, pp. 25-36, 2006.
[13]Martin Baumer, Patrick Seidler, Richard Torkar and Robert Feldt, "Predicting Fault Inflow in Highly Iterative Software Development Processes: An Industrial Evaluation," In Proc. of the 19th IEEE International Symposium on Software Reliability Engineering, Seattle, USA, 2008.
[14]Man Cheol Kim, Seung Cheol Jang and Jae Joo Ha, "Possibilities And Limitations of Applying Software Reliability Growth Models To Safetycritical Software," Journal of Nuclear Engineering and Technology, Vol. 39, No. 2, pp. 145-148, Apr 2007.
[15]Chin-Yu Huang, Jung-Hua Lo, Sy-Yen Kuo and Michael R. Lyu, "Software Reliability Modeling and Cost Estimation Incorporating Testing-Effort and Efficiency," In Proc. of the 10th International Symposium on Software Reliability Engineering, Boca Raton, FL, pp. 62-72, Nov 1999.
[16]Swapna S. Gokhale, Michael R. Lyu, and Kishor S. Trivedi, "Incorporating Fault Debugging Activities Into Software ReliabilityModels: A Simulation Approach," IEEE Transactions on Reliability, Vol. 55, No. 2, pp. 281-292, Jun 2006.