EVALUATION FOR ASSOCIATION OF CRIME RISK
ATTRIBUTES FOR DECISION SUPPORT SYSTEM
1
NOOR MAIZURA MOHAMAD NOOR, 2AHMAD FAIZ GHAZALI, 3ROSMAYATI
MOHEMAD, 4MD YAZID MOHD SAMAN
1,2,3,4
School of Informatics and Applied Mathematics, Universiti Malaysia Terengganu (UMT), 21030
Kuala Terengganu, MALAYSIA
E-mail: [email protected], [email protected], [email protected],
4
ABSTRACT
The aim of this paper is to evaluate the association between attributes for house breaking crimes identified from police reports. Data collected from the house breaking (HB) crime cases reported can be initially analyzed using statistical methods in several tests. The purpose of conducting the test is to ensure the significant attributes to be utilized in the development of a decision support system based on the proposed generic framework. The result of analysis shows the association between the identified attributes in HB crime reports in terms of its significance using several statistical methods.
Keywords: Association, Crime Attributes, Decision Support System, Statistical Methods
1. INTRODUCTION
Crime management involves many attributes for a sound decision-making. Decision support for crime management is essential for decision makers in analyzing crime cases reported. Decision support system (DSS) can be developed in order to assist decision maker in decision-making processes but not to make solid decisions for them. Risk can be considered in these decision-making processes in order to contribute for a broader view in decision alternatives by considering the possible negative causes and effects. In this study, the reports are obtained from domain experts that handling the house breaking (HB) crime cases; police officers.
Measuring association between the attributes can be performed in order to determine values of the strength of the relationship between two attributes [1]. There are many different statistical methods that can be used to study the relationship among attributes. According to [2],"...the strongest and most consistent patterns of relationships for both the crime opportunity and crime motivation effects are found for three property crimes: burglary, larceny, and motor vehicle theft". Burglary is one of the property crimes in residents, or specifically HB crime while larceny is also known as theft or robbery. In this study, HB crime is the case study to be applied with the proposed framework known as decision support system with
risk. The decisions and the risks can be identified from historical data in reports.
Crime reports and the information contained in it are very important to the overall analysis in crime investigations. The problem is the attributes used in reports that can be used as historical data in crime analysis are sometimes arguable in terms of its importance. In statistics, the significance and association between identified attributes can be determined. This knowledge was captured in narrative format of written reports by domain experts. Since information retrieval and semantic analysis is not within the scope of this study, these data that have important information can be analyzed using statistical methods. Statistical methods are beneficial for decision-making and management of case study data for further actions.
2. DECISION SUPPORT SYSTEM
Decision support system (DSS) is commonly used as an umbrella term to describe tools that support decision makers in decision-making processes. The decision-makers range from the high level management of an organization to the leader of a small team. DSS aims to assist decision-makers in making important decisions. They are not meant to replace human, but to give suggestions and recommendations based on the available information from the provided options. DSS initially defines as a system with a purpose to support management decision-makers in semi-structured decision conditions [3].
Decision-making processes involve conscious and unconscious consideration that can be estimated qualitatively or quantitatively. It can be divided into several phases, including before or after making decisions. Research work that involve risk in decision analysis such as studies by [4] has recently emerge. Risk concept can be integrated into decision-making processes in order to provide more evaluation using statistical methods.
2.1 Decisions with Risks
Decisions with risks being considered in analysis has been applied in case studies from various problem domains. Current related research works that can be mentioned are including decision for country risk by [5], decision with risk using Analytical Hierarchy Process (AHP) by [6], risk in financial decision by [7], decision for risk in healthcare by [8] and risk-based group decision-making by [9]. Statistical methods for risk have been employed in many fields including family risk artery disease by [10], patients trauma risk by [11], accidents risk by [12] and fire risk statistics (to be published) by [13]. The statistical methods for risk analysis employed in these researches can also be applied in the flow of information analysis cycle within decision maker, decision-making processes and DSS.
2.2.2 Case Study: Crime Investigations
Associations between risk factors of crime victimizations has been reviewed by Murray et al., [14]. Their study consists of systematically searching for researchers that measured criminal behavior up to the individual levels using crime reports or criminal records. Crime investigations field is chosen as the domain problem in this study. In forensic science for crime investigations, forensic scientists can evaluate and interpret the
evidence that includes the elements of uncertainty using statistical methods [15, 16]. Research has been ongoing to apply decision support system (DSS) into this problem domain, including DSS for DNA analysis and DSS for risk analysis in crime investigations [17-20].
Research for decision support in forensic science as in research work by [21] discussed the relation between decision theory and forensic sampling. The case study for forensic science applications presented is on forensic sampling issues. They address the methodology from decision theory together with Bayesian networks, altogether called Bayesian decision networks. Bayes’ theorem, in fact, is a part of statistical methods. In decision-making processes, belief function theory [22] can also be used as a method in a DSS. They applied belief function theory in an application in forensic entomology. These research works show that decision support play an important roles in field forensic science [21, 22]. Forensic traces can assists forensic scientists to estimate the time when crime occurs [23].
Concept of decision-making in DSS is also important for crime investigation and sometimes focused more in analysis rather than the developed tools if any [24-27]. COPLINK [26, 27] are using knowledge management for the decision support in crime analysis, almost similar concept with the research works by [24, 25]. The difference is on the applied case studies; authors [24, 25] are using knowledge management in police investigations, while authors [26, 27] are using knowledge management in crime analysis and not specifically mentioned for police officers only as domain experts.
3. RESEARCH METHODOLOGY
proposed as the guideline for using DSS with risk
using statistical methods.
The decision-making process as demonstrated in the framework is started by decision maker role in weighting the defined criteria. The criteria can be obtained from the identified variables, available parameters, such as risk factors or any other relevant information that can be obtained from the data either directly or indirectly. Weighting the criteria can be done using probabilities in various way, including assigning values due to its stated relevance by Bruni et al., [15], or weighting the criteria from historical data as by Kengpol et al., [28]. In this study, the data are obtained from historical data that basically contains written domain experts elicitation based on information on HB crime cases rather than verbally extract the information using interviews.
In HB crime cases, the probability refers to the crime probability itself which can be estimated based on frequency of occurrence from historical data. The impacts can be demonstrated through the property loss values in terms of financial loss estimation (thousands of Ringgit Malaysia or RM), time-series analysis, or any other possible variables that can be obtained either from the domain experts or the historical data that have been provided. Regression and multiple regression analysis are among the statistical methods that can be considered for evaluating the identified attributes and its relationships within HB crime cases. These attributes can be quantified and then analyzed using methods in existing computer software.
It is important to select an appropriate method for analysis using PASW. Field [29] mentioned that many researchers argue that the stepwise, forward and backward methods rely on the computer selecting attributes upon mathematical criteria. This takes many important methodological decisions outs of the hands of the researcher, or in this case study, decision makers. Furthermore, the models derived by computer often take advantage of random sampling variation and so decisions about which variables should be included will be based upon slight differences in their semi-partial correlation. It is advisable to cross-validate the model by splitting the data if a stepwise regression must be done [29].
Since there are many different methods to define ‘association’, there are also various kinds of measure. The interpretation of the perfect and
intermediate levels of association could be different [1]. The relationship between two attributes is also known as correlation [29]. The two variables could be positively related, not related at all, or negatively related. According to Field, [29], Pearson’s correlation requires only that data are interval for it to be an accurate measure of the linear relationship between two attributes.
There are various ways of examining relationship between attributes. These are including but not limited to measuring association, linear regression and correlation, testing regression hypotheses, analyzing residuals, building multiple regression models and its diagnostics [1]. Main output is a result of using correlation methods. The significance of decision attributes City, FinancialLoss, Month and Holiday is shown using values of Pearson correlation significant (2-tailed) test [29]. The first (H0) and second hypothesis (H1)
examined whether there is a direct and positive relationship between City attribute with HB crime frequency. It is then followed by Holiday attribute and Month attribute with HB crime frequency. The historical data obtained in this research is carefully studied in case by case manner.
In this study, correlation is significant at 0.05 and highly significant at 0.01. Notation H0 refers to
the first hypothesis while H1 is vice versa. Notation p refers to Pearson correlation values. The steps to obtain these results can be summarized as follows;
Phase 1: Hypothesis is formulated
H0: p = 0 (There is no correlation between two
compared attributes in the historical data of HB crime)
H1: p ≠ 0 (There is correlation between two
compared attributes in the historical data of HB crime)
Phase 2: Significant level is determined
If significant 2-tailed value is less than 0.01, than Pearson Correlation value is referred to, and then the value of R is checked to see the strength of relationship.
Phase 3: Rejection region is determined
In 2-tailed, the area that included and excluded from the value obtained is determined.
Phase 4: Significant value is referred If p<0.05, hence in this case study, reject H0
At the end of this study, overall result is
summarized.
Association between risk factors and crime can be shown using the correlation results of the compared attributes from the collected historical data.
4. RESULT AND DISCUSSIONS
The aim in this study is to evaluate the HB crime risk attributes using statistical methods. A statistical test uses the data obtained from a sample to make a decision about whether the null hypothesis should be rejected. The reason for choosing descriptive statistics method is similar to that justified by [30]. This is because the descriptive statistics tends to describe many important details about the relevant features from the data.
According to [31], correlation can be performed between time and other attribute with the number of crime occurrence. Correlation is used to analyse the collected data. Based on the correlation results, the authors [31] summarize the statistical analysis to explore the relationship between women’s travel plan attributes which consists of ‘time’ and ‘age’ towards the level of safety indication. In one of the table results in [31], the authors indicate the correlation analysis that used to explore the relationship between the time and level of safety. These information can be extracted from the historical data details contain in reports.
Information is extracted from the police reports. City or location has been one of the crime factors as shown in a number of research [32, 33]. As an example, in sexual crimes, place and environmental context contribute to the crime occurrences [34]. Analysis was performed using Statistical Analysis System 9.3 software for Windows. Although HB crime rarely involve sexual assault, the risk of property crime (such as HB crime) turning into violent crime (such as sexual assault and murder) is still exist.
Crime according to certain kind of city which also referred to area attribute was investigated by [35]. The authors found the relations between crime rates with commercial activities, housing, and population size in certain specific area. Data from 2006 and 2007 are used. Correlation matrix is created based on the observation of the data. Realizing its importance, the study of relationships
between crime and area should be included in this research.
Authors [35] suggest that police efforts and public policies regarding planning of a city should take account of the possible location and socio-economic factors to ensure residents safety. Crime-analysis software applications have already been developed. Common software packages for crime-data collection are including Arc-GIS, CrimeStat, Spatial Analysis, Crime View and SpaceStat [36].
Place-based theorem proposed for crime and crash site by [36] shows that location or area attribute is important. Area crime and its changes based on social cohesion studied by [37] also support the importance of area attribute. Causal relationship between area and crime is undeniably crucial by the wide usage of term crime-scene investigation.
Authors [30] mentioned that descriptive statistics was the appropriate method in answering the research questions and hypotheses. This is because descriptive statistics tend to describe every detail with consideration of the relevant features of the data. The descriptions using tables, charts, and figures can be comfortably administered and summarize by researchers based on data of HB crime obtained.
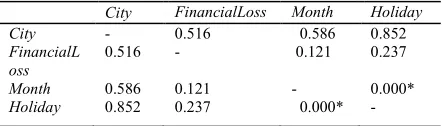
[image:4.612.307.528.622.685.2]Descriptive statistics were also calculated using PASW by [38] in order to describe the study sample. This is including the neighborhood-level characteristics. The authors conducted correlation analysis for all the variables at the aggregated level, and then proceed with multilevel logistic regression analysis using Stata 13. The aim of this study which is to evaluate the association between identified variables in HB crime reports is achieved. Results show that Month and Holiday has a highly significant correlation, as shown in Table 1.
Table 1: Summary for Correlations of HB crime data in 2011
The symbol * signifies the Pearson’s Correlation value where 2-tailed is less than 0.01.
City FinancialLoss Month Holiday
City - 0.516 0.586 0.852
FinancialL oss
0.516 - 0.121 0.237
Month 0.586 0.121 - 0.000*
The dependent variables are Month attribute
and FinancialLoss attribute. The independent variables are Area attribute and Holiday attribute. The study investigate either there are certain area or holiday season that are the significant factors for the frequency of HB crime and FinancialLoss in certain months.
For HB crime cases in 2011, Month and Holiday has a highly significant correlation, but the results for HBC cases in 2012 is different. Table 2 shows that there is no correlation between Month and Holiday for HB crime cases in 2012.
[image:5.612.319.526.77.206.2]This study provides support for a causal relationship between crime with area and crime with holiday season. Holiday season here is according to Malaysia's calendar in the years related to data; 2011 and 2012 respectively. The absence of an effect in 2012 needs to be investigated furthermore using additional control variables and attributes.
Table 2: Summary for Correlations of HB crime data in 2012
No symbol * signifies there is no Pearson’s Correlation value where 2-tailed is less than 0.01 for HB crime data in 2012.
Further investigation is required either using other statistical methods or considering different artificial intelligent mathematical model such as neural networks. Bayesian networks and Markov Chain can also be tested. Besides, the values at-risk can be specified by domain experts or 3-dimensional data presentation of HBC can be considered.
[image:5.612.85.302.399.468.2]The electronic form is proposed in such arrangement as in Figure 1 for prototyping based on required variables for data analysis in HB crime. The data key-in by domain expert (police officers) will be useful where only information based on specified variables is required. The prototype is currently under development stage.
Figure 1: Mock form in the development of prototype to input according to the importance of the associated
attributes to be analyzed in HB crime cases
5. CONCLUSIONS
The final overall result analyzed using correlation method in order to evaluate the association between identified attributes in the house breaking crime reports shows that data in 2011 are significantly correlated with Month attribute and Holiday attribute respectively. These attributes, month and holiday, are in fact can be used as attributes related to time-series analysis. However, the results furthermore for data in 2012 shows that there were no correlations found between all of the attributes; City, FinancialLoss, Month or Holiday.
Hence, further investigation with another attributes from the information that can be retrieved from the reports is suggested. It can be concluded that different statistical methods need to be used in order to test the relationship between the identified attributes from HBC reports. Another attributes can be identified in further research and observations on the data obtained from the police reports of these crime cases. In summary, this research has successfully demonstrate the decision support applicability of crime risk attributes using statistical methods to show the risk associated with house breaking (HB) crimes attributes to assist in police decision-making processes on the allocation of resources.
The main contribution towards the knowledge of decision support system (DSS) in this study is the usage of statistics to represent risk as another component of DSS. The limitations of this paper is the crime risk attributes used in the development of DSS is currently under prototyping phase. The whole concept is expected to be more sophisticated yet practical once fully implemented with a new framework to be proposed and then if possible, applied into several other problem domains.
City FinancialLoss Month Holiday
City - 0.610 0.281 0.313
Financia lLoss
0.610 - 0.672 0.557
Month 0.281 0.672 - 0.861
ACKNOWLEDGEMENTS
The authors would also like to thank Royal Malaysian Police (PDRM), especially Dato’ Rosli Abdul Rah man as the Terengganu Chief Police Officer (Ketua Polis Terengganu, Malaysia) for his support in this research.
REFERENCES:
[1] Norusis, M.J., SPSS 10.0 Guide to Data
Analysis. 2000, Upper Saddle River, New
Jersey: Prentice Hall, Inc.
[2] Willis, H.H. and M.A.R. K., Estimating
terrorism risk. 2005. CA: RAND
Corporation(90).
[3] Turban, E., J.E. Aronson, and T.-P. Liang,
Decision Support Systems and Intelligent
Systems. Seventh Edition ed, ed. B. Horan
and K. Hannon. 2005, International Edition: Pearson Prentice Hall.
[4] Liu, Y., Z.-P. Fan, and Y. Zhang, Risk decision analysis in emergency response: A method based on cumulative prospect
theory. Computers & Operations Research,
2014. 42: p. 75-82.
[5] Li, J., et al., Oil-importing optimal decision considering country risk with
extreme events: A multi-objective
programming approach. Computers &
Operations Research, 2014. 42: p. 108-115.
[6] Ergu, D., et al., Analytic network process in risk assessment and decision analysis.
Computers & Operations Research, 2014. 42: p. 58-74.
[7] Holper, L., M. Wolf, and P.N. Tobler,
Comparison of functional near-infrared spectroscopy and electrodermal activity in assessing objective versus subjective risk
during risky financial decisions.
NeuroImage, 2014. 84: p. 833-842. [8] Bai, X., et al., A decision methodology for
managing operational efficiency and information disclosure risk in healthcare
processes. Decision Support Systems,
2014. 57: p. 406-416.
[9] Chou, J.-S. and C.S. Ongkowijoyo, Risk-based group decision making regarding renewable energy schemes using a
stochastic graphical matrix model.
Automation in Construction, 2014. 37: p. 98-109.
[10] Lamina, C., et al., Correlation between a positive family risk score and peripheral artery disease in one case-control and two
population-based studies. Atherosclerosis,
2014. 237(1): p. 243-250.
[11] Majercik, S., S. Knight, and B.D. Horne,
The intermountain risk score predicts
mortality in trauma patients. Journal of
Critical Care, 2014. 29(5): p. 882.e1-882.e4.
[12] Ma, C., et al., Uncertain risk assessment model for catastrophic accidents in power
system. International Journal of Electrical
Power & Energy Systems, 2014. 62(0): p. 374-382.
[13] Salvati, L. and A. Ferrara, Validation of MEDALUS Fire Risk Index using Forest Fires Statistics through a multivariate
approach. Ecological Indicators, 2015.
48(0): p. 365-369.
[14] Murray, J., D.R.d.C. Cerqueira, and T. Kahn, Crime and violence in Brazil:
Systematic review of time trends,
prevalence rates and risk factors.
Aggression and Violent Behavior, 2013. 18: p. 471-483.
[15] Bruni, A.T., et al., Analysis of the procedures used to evaluate suicide crime scenes in Brazil: A statistical approach to
interpret reports. Journal of Forensic and
Legal Medicine, 2014. 26(0): p. 29-38. [16] Aitken, C. and F. Taroni, Statistics and the
Evaluation of Evidence for Forensic
Scientists. 2nd ed. 2005: Wiley, Chichester
[17] Ghazali, A.F., A Reverse Engineering Approach of a Decision Support System
for Forensic DNA Analysis, in Department
of Computer Science, Faculty of Science
and Technology. 2012, Universiti
Malaysia Terengganu: Kuala Terengganu. [18] Ghazali, A.F., N.M.M. Noor, and M.Y.M.
Saman. Risk Analysis Framework for Evolution of a Decision Support System in
Forensic DNA Analysis in UniSZA
Postgraduate Research Conference. 2013.
Universiti Sultan Zainal Abidin (UniSZA). [19] Noor, N.M.M., A.F. Ghazali, and M.Y.M. Saman, Decision Support Systems for Forensic Science in Crime Investigation.
International Journal of Digital Content Technology and itsApplications (JDTCA), 2013. 7(16): p. 26-37.
[20] Noor, N.M.M., et al. Framework of Risk-based Decision Support System in Crime
Investigation. in 17th IFIP WG 8.3 DSS
2014 Open Conference, DSS 2.0 – Supporting decision making with new
Marie Curie (UPMC), Campus Jussieu,
Paris, France.
[21] Biedermann, A., et al., Decision-theoretic analysis of forensic sampling criteria
using Bayesian decision networks.
Forensic Science International, 2012. 223(1–3): p. 217-227.
[22] Veremme, A., et al., Evidential calibration process of multi-agent based system: An
application to forensic entomology. Expert
Systems with Applications, 2012. 39(3): p. 2361-2374.
[23] Weyermann, C. and O. Ribaux, Situating
forensic traces in time. Science & Justice,
2012. 52(2): p. 68-75.
[24] Gottschalk, P., Expert systems at stage IV of the knowledge management technology
stage model: The case of police
investigations. Expert Systems with
Applications, 2006. 31(3): p. 617-628. [25] Gottschalk, P., Stages of knowledge
management systems in police
investigations. Knowledge-Based Systems,
2006. 19(6): p. 381-387.
[26] Zhao, J.L., et al., Process-driven collaboration support for intra-agency
crime analysis. Decision Support Systems,
2006. 41(3): p. 616-633.
[27] Chen, H., et al., COPLINK Connect: information and knowledge management
for law enforcement. Decision Support
Systems, 2003. 34(3): p. 271-285.
[28] Kengpol, A., W. Meethom, and M. Tuominen, The development of a decision
support system in multimodal
transportation routing within Greater
Mekong sub-region countries.
International Journal of Production Economics, 2012. 140(2): p. 691-701. [29] Field, A., Discovering Statistics Using
SPSS. 3rd Edition ed. 2009: SAGE Publications Ltd.
[30] Hamid, L.A. and N.M.P. Toyong, Rural Area, Elderly People and the House
Breaking Crime. Procedia - Social and
Behavioral Sciences, 2014. 153: p. 443-451.
[31] Sham, R., H.A. Hamid, and R.M. Noah,
Routine Activities and Crime in the City:
Cases of working women. Procedia -
Social and Behavioral Sciences, 2013. 101: p. 345-353.
[32] O' Malley, P., Risk Societies and the
Government of Crime. Dangerous
Offenders: Punishment and Social Order,
ed. M. Brown and J. Pratt. 2000, London: Routledge.
[33] Cole, S., Modernity, Risk, and Contemporary Crime Control Strategies as Risk Management: An Analysis of Sex Offender Statutes and the Shift Toward A
Risk Society in Department of Sociology.
2000, State University of New York. [34] Snedker, K.A., Examining the Dynamics
of Fear of Crime: Crime, Disorder, and
Risk in New York City Neighborhoods, in
Department of Sociology. 2003, New York
University.
[35] Starr, C., Social benefit versus technological risk: What is our society
willing to pay for safety? Science, 1969.
165: p. 1232-1238.
[36] Li, G., et al., Space-time variability in burglary risk: A Bayesian spatio-temporal
modelling approach. Spatial Statistics,
2014. 9: p. 180-191.
[37] Li, S.-y., S.-j. Ni, and S.-f. Shen, Risk Analyzing on Target Type of Arson Attack.
Procedia Engineering, 2014. 71: p. 502-511.
[38] Sprung, M.R., The Association of Neighborhood Crime and Cardiovascular Risk Factors in the Healthy Aging in Neighborhoods of Diversity Across the
Life Span (HANDLS) Study 2012,