http://dx.doi.org/10.4236/jcc.2014.23002
Twitter Sentiment in Data Streams with Perceptron
Nathan Aston, Jacob Liddle, Wei Hu*
Department of Computer Science, Houghton College, Houghton, USA. Email: *wei.hu@houghton.edu
Received January 2nd,2014; revised January 29th, 2014; accepted February 6th, 2014
Copyright © 2014 Nathan Aston et al. This is an open access article distributed under the Creative Commons Attribution License, which permits unrestricted use, distribution, and reproduction in any medium, provided the original work is properly cited. In accor-dance of the Creative Commons Attribution License all Copyrights © 2014 are reserved for SCIRP and the owner of the intellectual property Nathan Aston et al. All Copyright © 2014 are guarded by law and by SCIRP as a guardian.
ABSTRACT
With the huge increase in popularity of Twitter in recent years, the ability to draw information regarding public sentiment from Twitter data has become an area of immense interest. Numerous methods of determining the sentiment of tweets, both in general and in regard to a specific topic, have been developed, however most of these functions are in a batch learning environment where instances may be passed over multiple times. Since Twitter data in real world situations are far similar to a stream environment, we proposed several algorithms which classify the sentiment of tweets in a data stream. We were able to determine whether a tweet was subjective or objective with an error rate as low as 0.24 and an F-score as high as 0.85. For the determination of positive or negative sentiment in subjective tweets, an error rate as low as 0.23 and an F-score as high as 0.78 were achieved.
KEYWORDS
Sentiment Analysis; Twitter; Grams; Perceptron; Data Stream
1. Introduction
In recent years, Twitter has become one of the most im- portant sources of public sentiment on numerous topics including newly released products, politics, movies and television, and many others. On a regular basis people take to twitter in order to express their opinions very candidly on such topics. As a result, the collection and analysis of this collective sentiment has become an area of great interest for companies and individuals wishing to know the reaction of the public to their products, announ- cements, etc. However, this is not as simple as it might sound. While the sentiment of individual tweets can be determined easily enough manually, the sheer volume of tweets makes the manual determination of sentiment for tweets unrealistic. According to Twitter’s recent IPO filing, there are approximately 500 million tweets daily worldwide. Therefore it is necessary to develop methods by which twitter sentiment can be determined both quickly and accurately on such a large scale.
1.1. Related Work in Sentiment Analysis
Many sentiment analysis techniques have arisen in recent
years for determining the sentiment of tweets and other forms of feedback, predicting either a positive, negative, or neutral sentiment for the tweet as a whole [1,2], or in relation to a specific topic [3,4]. One popular approach is to analyze tweets according to the words which they con- tain. This is known as the lexicon based approach [1,3-7]. This method uses a dictionary of words or n-grams la- beled as positive or negative to determine a weight ac- cording to the frequency of these key words or n-grams. This weight is then used to predict the label (positive or negative) of the tweet.
As a result of the development of language in tweets, the lexicon based approach alone is not always effective in accurately determining sentiment. The introduction of various abbreviations, slang, emoticons, and other non- traditional elements in tweets makes it difficult to have a constantly updated dictionary from which to determine sentiment. For this reason, many methods of determining Twitter sentiment employ machine learning techniques such as Naïve Bayes [1,8,9], SVM [1,6], Linear Classifi- er [1], and Maximum Entropy [1]. This allows the model to learn the significance of unique twitter elements in predicting sentiment, even as new elements arise.
1.2. Twitter Data as a Data Stream
Because of the high volume of tweets, the rate at which they are created, and the constantly changing nature of the tweets, twitter data are best modeled as a data stream [5,10]. This presents a number of different challenges since many of the traditional batch learning methods fail when applied to a data stream since we have a number of limitations which are not faced in batch learning [11]. First, because the stream of tweets is potentially un- bounded in size, algorithms in this environment have restrictions on memory usage. Since new tweets are con- stantly coming in, the algorithm can only make a single pass for each instance, and it must process this instance quickly enough to avoid holding up the rest of the stream. As a result of these challenges when evaluating senti- ment in a data stream, the accuracy is slightly reduced. However we are willing to accept this tradeoff since the evaluation environment is more realistic, closer to a real time inflow of Twitter data.
1.3. Research Purpose
The purpose of our research is to examine methods of de- termining sentiment within a stream environment, where batch learning methods are ineffective. The goal is to examine algorithms with limitations on memory and pro- cessing time, which retain a high level of accuracy pre- dicting sentiment. We also examine the effect of analyz- ing tweets based only on the top features, rather than the entire tweet.
2. Materials and Methods
In our research several different algorithms were used for classification. These algorithms are Perceptron, Percep- tron with best learning rate, and voted Perceptron [12]. In addition to this, feature reduction was performed in order to speed up the runtime without loss of accuracy. A sin- gle data set was used for this study, but was split into two subsets. It is the publicly available Sanders Corpus which is intended for training and testing sentiment analysis algorithms.
(http://www.sananalytics.com/lab/twitter-sentiment/) The set is manually labeled in order to provide a reliable sen- timent label.
2.1. Sanders Corpus Data Set
This data set consists of 5513 hand-classified tweets with regard to one of four topics (Apple, Google, Microsoft, and Twitter). Because the Twitter API terms of service do allow tweets to be directly distributed, a Python script was used to retrieve the tweets directly from twitter. Since a number of the tweets were no longer publicly available the data set was pared down. In addition to this, many of the tweets had been given the label “irrelevant”.
These tweets were useless to us since we only wanted those with a sentiment of “positive”, “negative”, or “neu- tral”. Thus, removing these “irrelevant” tweets, we fur- ther reduced the number of tweets. The data set was then further trimmed by removing any tweets which were not in English, leaving 3320 tweets which suited our purposes.
2.2. Subset 1: Objective/Subjective
From the reduced Sanders Corpus data set we created a subset which included all of the tweets, but relabeled them as either “Subjective” if they were previously “pos- itive” or “negative”, or “Objective” if they had previous- ly been labeled “neutral”.
2.3. Subset 2: Positive/Negative
A second subset of the Sanders Corpus was created by removing all of the “neutral” labeled tweets, leaving a much smaller set of 1068 positive and negative tweets.
2.4. Grams
To use tweets as data that we can process and analyse, we incorporated the technique of grams to process the text of tweets. The n grams of a text are all sets of cha- racters of length n that appear in the text. For an example the text “Twitter” would have the 2 grams of {“Tw”, “wi”, “it”, “tt”, “te”, “er”}. We also combined a range of grams into one set, which we called the 1-n grams. We restricted the character range down to a size of 95 of the most commonly used characters
2.5. Feature Reduction
The number of possible grams exponentially increases by a factor of 95n as the gram size n increases. This expo- nential growth makes it infeasible to calculate all the features of a sample in a limited amount of time. Many features do not significantly impact the classification of a sample, so the removal of them will reduce the size tre- mendously for a speed increase. We select the top N fea- tures of a gram and use only them to classify samples. Our selection of the top features involved 6 different evaluation algorithms: Chi Squared, Filtered Feature, Gain Ratio, Info Gain, One R, and Relief. We used the results of each evaluation technique and weighted each feature by its index from each returned list. The feature with the lowest sum across all results will be the top fea- ture, and from there we computed a sorted list of all fea- tures by their weights. From this sorted list of features we can select an N for the number of top features to use. But
features significantly increases the speed of training and prediction with limited, if any, decrease in accuracy.
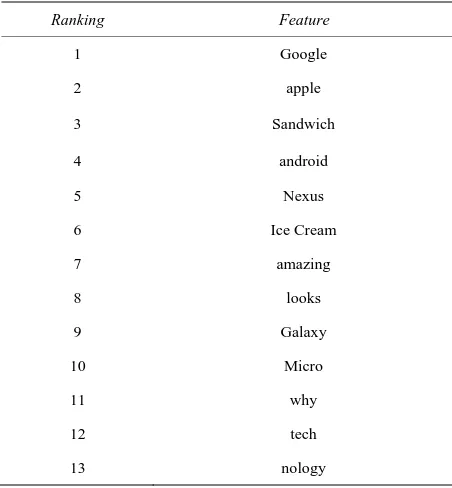
[image:3.595.58.285.256.465.2]In [9], the top 20 features were given from two Naïve Bayes classifiers on the Sanders Corpus Dataset. Top features for subjective and objective, as well as positive and negative, were given. Our top features are displayed in Tables 1 and 2; revealing several similar features be-tween the top features of [9] and ours. Due to the Sanders Tweets being about Apple, Google, Microsoft, and Twit-ter; there is similarity in features of these four companies. Topics like the iPhone, Ice Cream Sandwich, and iOS are seen in the top features of [9] and ours. Then there are
Table 1. Top Features: Objective/Subjective.
Ranking Feature
1 apple
2 issue
3 follow
4 Twit
5 http
6 shit
7 iOS5
8 fuck
9 iPh
10 fix
11 Micro
Table 2. Top Features: Positive/Negative.
Ranking Feature
1 Google
2 apple
3 Sandwich
4 android
5 Nexus
6 Ice Cream
7 amazing
8 looks
9 Galaxy
10 Micro
11 why
12 tech
13 nology
other words such as “issue” and other profanity that ap-peared in both our lists due to them bringing subjective labels to a tweet.
2.6. Perceptron with Best Learning Rate
The perceptron algorithm requires a learning rate on which to weight the rate of learning for each sample trained upon. The learning rate is crucial in the training, and different learning rates may product more efficient classifiers for different representations of data. The pro- blem with this idea is deciding what learning rate to use for certain representations. Our approach, during the ini- tial phase, is to train upon a fraction r of the samples multiple times with different learning rates and use the average of the runs as the final learning rate for the training and prediction phase.
Algorithm 1: Stream Perceptron With Best Learning Rate
Input: stream of tweets, r fraction of tweets to calculate learning rate
Output: prediction of tweets (subjective, objective) or (posi-tive, negative)
Initial Phase:
• Calculate best learning rate from first r tweets
• Generate random classifier W
Training/Prediction Phase:
• for each T in stream o y = prediction of T from W
o if y ! = true label of T
train W on T
2.7. Voted Perceptron
Perceptron can also be used to vote on a sample [12]. When a sample is trained, instead of updating the clas- sifier when an incorrect prediction is observed, a new classifier is created from the updating of the current clas- sifier and the sample. All previous classifiers are kept with a count of how many samples they correctly classi- fied. To predict a sample, each classifier predicts on the sample and is weighted by its count. The sample is final- ly labeled with the majority of all classifiers votes.
Algorithm 2: Stream Voted Perceptron
Input: stream of tweets, r fraction of tweets to calculate learning rate
Output: prediction of tweets (subjective, objective) or (posi-tive, negative)
Initial Phase:
• Generate random classifier W1, k = 1 Training/Prediction Phase:
• for each T in stream
o y = prediction of T from W1 thru Wk o if y ! = true label of T
[image:3.595.58.284.493.737.2]2.8. Ensemble Method
An ensemble technique can be incorporated with the conglomeration of the different gram classifiers. Instead of classifying with a single gram size, classifying with multiple gram sizes can help with predicting tweets that might fail for certain classifiers. Our approach to this idea predicts a tweet’s sentiment on the majority of the classifiers.
3. Results and Analysis
By implementing feature selection we were able to sig-nificantly reduce the runtime of the algorithms which we used to predict sentiment in a data stream environment. For this reason we were able to limit both the memory usage and run time of the algorithms, providing an effec-tive method for sentiment analysis in data streams.
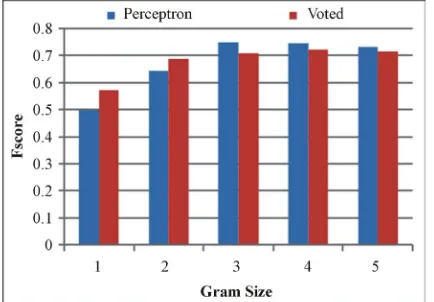
3.1. Voted Perceptron
Shown in Figure 1, the voted perceptron performs com- parably, if not slightly more efficiently than the original perceptron on the subjective/objective classifiers. It pro-duced more stable results across all classifiers, whereas the original perceptron drops in performance with the 1 gram. Similar results, in Figure 2, also appeared in the positive/negative classifier.
3.2. Ensemble Technique
Our ensemble technique performed better than the origi-nal perceptron and vote perceptron with a cost to run time. As shown in Figure 3, the subjective/objective classifier performed significantly over the positive/nega- tive classifier.
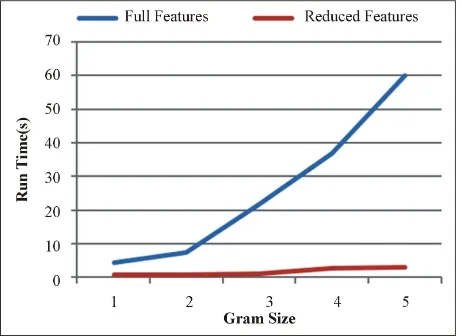
3.3. Feature Reduction
Reducing features significantly increases the performan-
[image:4.595.318.528.84.241.2]Figure 1. Perceptron and Voted Perceptron on Subjective and Objective—Voted perceptron produces more stable results than the original perceptron algorithm.
[image:4.595.316.532.301.455.2]Figure 2. Perceptron and Voted Perceptron on Positive and Negative—Voted perceptron performs comparably similar to the original perceptron with slight improvement to the original perceptron.
Figure 3. Sentiment Prediction on Subjective and Objective with Ensemble Perceptron—The ensemble perceptron per-forms significantly better on subjective/objective than on positive/negative. The ensemble classifier does produce bet-ter results than each classifier individually.
ce time of perceptron as shown in Figure 4 while kee- ping comparable, if not slightly improved, results overall, in Figure 5. The use of just the important features of a tweet appears to help the classifier to predict more accu- rate results, without the overhead of insignificant features interfering with results. For the Perceptron algorithm on objective/subjective tweets using 5-grams, it can be seen that the runtime of the algorithm is reduced from over a full minute when using the full features, down to just over 3 seconds when using the reduced feature set. Not only this, but the F-score increases and the error rate de-creases for the reduced feature set. Similar results can be seen for the tweets classified as positive/negative as well.
3.4. Best Learning Rate
[image:4.595.66.283.547.698.2]Figure 4. Runtime of Perceptron on Subjective and Objec-tive with Full Features and Reduced—The use of reduced features of a classifier significantly decreases the runtime of the classifier.
Figure 5. Perceptron on Subjective and Objective with Full Features and Reduced—The use of reduced features in a classifier performs comparably to the full features of the classifier, if not slightly better on certain classifiers.
Figure 6, and with a significant decrease in time, in
Figure 7. Our Best Learning Rate algorithm does not
suffer from the strain of having to predict upon all ver-sions of the classifier from the beginning, but instead runs as the normal perceptron on just the current classi- fier’s version.
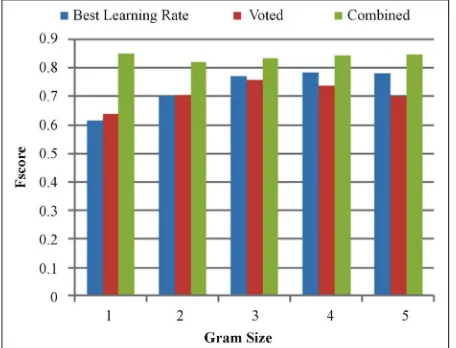
3.5. Best Learning Rate and Voted Perceptron
Now that we have seen the performance of the voted and best learning rate perceptron, each bringing their own performance improvements as well as run time, we de- cided to combine these two techniques. Since the runtime was the highest of all techniques, we tested this approach on the positive/negative classifier and on the positive/ negative reduced classifiers. All classifiers, both in the positive/negative, Figure 8, and in the reduced grams,
[image:5.595.312.536.305.473.2]Figure 6. Perceptron, Voted, Best Learning Rate on Subjec-tive and ObjecSubjec-tive—Compared to the original perceptron and voted perceptron, using the best learning rate percep-tron performs comparably in all classifiers.
Figure 7. Runtime of Voted and Best Learning Rate
Per-ceptron on Subjective and Objective—Using the best learning rate perceptron decreases the runtime drastically from the voted perceptron.
Figure 9, showed improved performance.
3.6. Comparison with Semantria
We chose 100 tweets of positive and negative sentiment to compare with an online sentiment analysis tool called Semantria [13]. For these tweets, the online analysis pre- dicted with an error rate of 0.58 while our Perceptron algorithm predicted with error rate of 0.5. Even though our algorithm was predicting in a stream environment with no prior learning, it was able to predict the senti- ment of the 100 random tweets with a lower error rate than the online analysis.
4. Conclusion
[image:5.595.59.290.312.479.2]Figure 8. Prediction with Voted and Best Learning Rate Combined on Positive and Negative—The combination of the voted perceptron and best learning rate perceptron allows the classifier to produce noticeable improvements across all classifiers.
Figure 9. Prediction with Voted and Best Learning Rate
Combined on Positive and Negative Reduced Features— The combination of the voted perceptron and best learning rate perceptron also produces noticeable improvements over all classifiers using reduced features.
ing feature reduction we were able to make our Percep-tron and Voted PercepPercep-tron algorithms more viable in a stream environment. For the two algorithms we were able to predict with an error rate of 0.24 and an F-score of 0.85 for tweets labeled “subjective” or “objective”. For the determination of positive or negative sentiment in subjective tweets, an error rate of 0.23 and an F-score of 0.78 were achieved. Although a relatively high error rate is to be expected in a stream environment as opposed to a batch environment, our proposed stream algorithms per-form well on such a wide range of tweets.
Acknowledgements
We thank Houghton College for its financial support.
REFERENCES
[1] G. Preslav Nakov, Zornitsa Kozareva, Alan Ritter, Sara Rosenthal, Veselin Stoyanov, Theresa Wilson, “SemEv-al-2013 Task 2: Sentiment Analysis in Twitter,” Second Joint Conference on Lexical and Computational Seman-tics (*SEM), Seventh International Workshop on Seman-tic, Atlanta, 14-15 June 2013, Vol. 2, pp. 312-320. [2] L. Barbosa and J. L. Feng. “Robust Sentiment Detection
on Twitter from Biased and Noisy Data,” Proceedings of the 23rd International Conference on Computational Linguistics (Coling 2010: Posters), Beijing, August 2010 pp. 36-44.
[3] Y. H. Hu, F. Wang and S. Kambhampati, “Listening to the Crowd: Automated Analysis of Events via Aggre-gated Twitter Sentiment,” Proceedings of the Twen-ty-Third International Joint Conference on Artificial In-telligence, pp. 2640-2646.
[4] T. Carpenter and T. Way, “Tracking Sentiment Analysis through Twitter,” Proceedings of the 2012 International Conference on Information and Knowledge Engineering
(IKE 2012), Las Vegas, 16-19 July 2012.
[5] M. Hao, C. Rohrdantz, H. Janetzko, U. Dayal, D. A. Keim, L.-E. Haug and M.-C. Hsu. “Visual Sentiment Analysis on Twitter Data Streams,” IEEE Symposium on Visual Analytics Science and Technology, Providence, 23-28 October 2011.
[6] L. Zhang, R. Ghosh, M. Dekhil, M. C. Hsu and B. Liu. “Combining Lexicon-based and Learning-based Methods for Twitter Sentiment Analysis,” HP Laboratories, 2011, HPL-2011-89.
http://www.hpl.hp.com/techreports/2011/HPL-2011-89.ht ml
[7] J. F. Si, A. Mukherjee, B. Liu, Q. Li, H. Y. Li and X. T. Deng, “Exploiting Topic Based Twitter Sentiment for Stock Prediction,” The 51st Annual Meeting of the Asso-ciation for Computational Linguistics—Short Papers
(ACL Short Papers 2013), Sofia, 4-9 August 2013. [8] G. João, “Knowledge Discovery from Data Streams,”
Chapman & Hall/CRC, Boca Raton, 2010.
[9] W. Deitrick and W. Hu, “Mutually Enhancing Commu-nity Detection and Sentiment Analysis on Twitter Net-works,” Journal of Data Analysis and Information Pro- cessing, Vol. 1 No. 3, 2013, pp. 19-29.
http://dx.doi.org/10.4236/jdaip.2013.13004
[10] H. Saif, Y. L. He and H. Alani, “Semantic Sentiment Analysis of Twitter,” The Semantic Web—ISWC 2012,
Lecture Notes in Computer Science, Vol. 7649, pp. 508- 524. http://dx.doi.org/10.1007/978-3-642-35176-1_32
[11] Z. Miller, B. Dickinson, W. Deitrick, W. Hu and A. H. Wang, “Twitter Spammer Detection Using Data Stream Clustering,” Information Sciences, Vol. 260, 2014, pp. 64-73.
[12] Y. Freund and R.E. Schapire, “Large Margin Classifica-tion Using the Perceptron Algorithm,” Machine Learning, Vol. 37, No. 3, 1999, pp. 277-296.
http://dx.doi.org/10.1023/A:1007662407062
[image:6.595.59.287.321.495.2]