http://dx.doi.org/10.4236/jhrss.2013.14009
Engaging in Social Action at Work: Demographic
Differences in Participation
Aimee Dars Ellis
Ithaca College, Ithaca, USA Email: [email protected]
Received August 7, 2013; revised September 8, 2013; accepted September 16, 2013
Copyright © 2013 Aimee Dars Ellis. This is an open access article distributed under the Creative Commons Attribution License, which permits unrestricted use, distribution, and reproduction in any medium, provided the original work is properly cited. In accor- dance of the Creative Commons Attribution License all Copyrights © 2013 are reserved for SCIRP and the owner of the intellectual property Aimee Dars Ellis. All Copyright © 2013 are guarded by law and by SCIRP as a guardian.
ABSTRACT
Many organizations are utilizing corporate social responsibility initiatives that require employee participation. These initiatives, which involve social action at work (SAW), can be a source of reputational gains, benefit the community, and increase employee organizational identification [1]. Although research has been conducted on employee volunteer programs (EVP), one aspect of SAW, those studies have not identified the characteristics of employees who are most likely to participate in EVP nor have they considered the wide range of SAW programs. In the field of Sociology, ex- tensive research has been conducted to identify characteristics of volunteers, but these volunteer programs are outside the context of CSR initiatives. This research addresses this gap by identifying the characteristics of enployees who en-gage in SAW across a wide range of activities. The results of the study can help hone future research questions and aid practitioners in developing and marketing SAW programs that resonate with employees and maximize participation for the good of the employees, organization, and community as a whole.
Keywords: Corporate Social Responsibility; Employee Engagement; Employee Volunteerism
1. Introduction
As part of their corporate social responsibility programs, many organizations utilize employee efforts to reach out to their communities. They conduct United Way cam- paigns, sponsor blood drives, and organize volunteer programs, to name a few examples. Previous papers [1,2] have provided a typology of these CSR initiatives that require employee involvement and have discussed their impact on employee attitudes and behaviors, finding that participation in these activities can provide benefits be- yond the financial bottom line, including increased or- ganizational identification on the part of employees. These papers did not, however, discuss which employees may be most likely to participate in social action at work (SAW). While others have investigated particular aspects of SAW, such as employee volunteer programs (e.g., [3-6]), knowing the characteristics of the employees who engage in diverse SAW programs will help managers target these programs effectively as well as identify other SAW opportunities that may be more appealing to the groups that do not currently engage in companies’ CSR
initiatives. The results of this research will also help scholars of future studies hone future research questions.
2. Theory and Hypotheses Development
2.1. Social Ties
A social tie is an association between two individuals, A and B, the strength of which depends on the time, intensity, intimacy, and reciprocation which characterizes the tie [7]. Podolny and Baron [8] created a typology of social ties in the workplace, distinguishing between position-to-position and person-to-person ties, the former based on job interdependence and the latter based on interpersonal attraction, or friendship. However, they stress that the distinction is “a matter of degree not kind” and should not be overstated [7, p. 677]. Consequently, I will use the term “social tie” to refer to both formal and informal ties between two coworkers. To illustrate the impact of social ties on SAW, I will discuss social ties in the context of social movements, activism, and volun- teering.
social tie is related to participation in social movements [9-13]. Schussman and Soule [14], in a study investi- gating reasons why people participate in protest activities (defined as a protest, march, or demonstration in res- ponse to a local or national problem) found that being as- ked to take part is the strongest predictor of participation. Social capital, as measured by embeddedness in social networks (e.g., community leadership) and social norms (i.e., social and interracial trust), is also related to volunteerism and charitable giving [15]. Brady and col- leagues [16] found that recruiters for political activism were more successful in gaining positive responses when they knew their target. Close ties predisposed targets to assent to requests; furthermore, recruiters were able to leverage personal information to appeal to the targets’ personal interests, values, and goals. A case study of a la- bor strike at a large university campus revealed that em- ployees were more likely to strike if others in their unit were also participating [9].
Volunteering is more likely when social ties exist, and, conversely, volunteering strengthens social ties [17]. Furthermore, volunteering is strengthened through social interactions [18]. Social ties also affect responses to volunteerism: Kulik [19] demonstrated that volunteers who enjoyed family support enjoyed their volunteer work more and suffered less burnout than those without family support. Wilson and Musick [18] observed that volun- teers with more frequent attendance at meetings of reli- gious or charitable groups were less likely to drop out of volunteer activities.
Non-profit groups have utilized this knowledge of so- cial ties. In its literature for workplace blood drive co- ordinators, the United Blood Services stresses the impor- tance of peer-to-peer recruiting for a successful event [20]. Because of the impact social ties have on a variety of categories of social action, I offer the following:
Hypothesis 1: Employees with social ties to others en- gaged in SAW will be more likely to participate in SAW than employees without social ties.
2.2. Past Volunteering/Donating Experiences
Employees who have volunteered or donated in the past likely will be more likely to repeat their behavior. In a study of blood donors, Lee, Piliavin, and Call [21] found that past behavior was predictive of the giving of time, money, and blood, suggesting that these activities helped form a role identity, and consistency in action helped establish and maintain the identity. Using the Theory of Planned Behavior to analyze charitable giving, Smith and McSweeney [22] uncovered a relationship between past and current donations. Given these results in a general context, I expect the same drive for role identity consistency will be present in the workplace, leading to
the following:
Hypothesis 2: Past experiences volunteering or donat- ing to charities will be related to current volunteering and donating at work.
2.3. Demographic Differences
Individual differences variables also likely play a role in an employee’s decision to participate in SAW. Gender, for example, is related to the likelihood to volunteer with women volunteering at a higher percentage than men [23]. Differences in hope, gratitude, and altruism are also likely related to SAW. To illustrate, a study of 308 white collar employees by Andersson, Giacalone, and Jurkie- wicz [24] demonstrated a relationship between hope and gratitude with concern for CSR. Worldview, particularly the ethics of care (a concern for others based on empathy and need) versus the ethics of justice (a universal perspective), is another individual variable expected to influence SAW. Evidence shows that women are more likely to have an ethics of care which is related to higher levels of volunteerism [25,26]. Together, these findings suggest:
Hypothesis 3: Women will be more likely to partici- pate in SAW than men.
Some studies indicate that in general, older adults volunteer more often than younger adults [27-30]. These results might be explained by the amount of time older adults, often retired, have available to devote to volunteer activities. Within the context of SAW, however, age may not show the same relationship with participation. Age is often viewed as a proxy for tenure, and,usually, the lon- ger the tenure at a job, the more responsibilities one has. At the same time, employees with shorter tenure may feel more pressure to perform and therefore devote more time and energy to on-the-job concerns. Despite the mi- xed findings, because of the strong relationship with age and social action, I propose:
Hypothesis 4: Older employees will be more likely to participate in SAW than younger employees.
Racial differences also emerge when considering participation in volunteerism [31,32]. According to Sun- deen, Garcia, and Raskoff [31], Caucasians volunteer at the highest rate. Wilson [32] suggests this may be due to other racial groups’ access to human capital or because they are not as embedded in social networks and there- fore are not asked to volunteer. As a result, I suggest:
Hypothesis 5: Ethnic and racial groups will show dif-ferent levels of participation in SAW.
3. Methods
3.1. Sample
conducted at a Southwest location of a major semicon- ductor manufacturer which I will call ChipMaker to pro- tect the identity of the sample site. Worldwide, the com- pany has almost 100,000 employees according to their 2006 annual report with over 10,000 of those employees at the sample site. ChipMaker produces microprocessors, motherboards, flash memory, products for network stor- age, and wireless products. For my study, 1000 employ- ees from the selected site were randomly chosen to re- ceive invitations to participate. Of these participants, 314, or 31.4%, completed the survey.
3.2. Procedure
A top-ranking member of ChipMakers’s management team provided a letter of endorsement for the study, send via email, that highlighted the benefits of the survey to the firm, asks employees to fill out the survey, which was available through the commercial web-based program Survey Monkey, and stressed that employee responses will remain confidential. To allay some concerns about socially desirable responding, the instructions also re- minded participants that responses would remain con- fidential and indicated that there were no right or wrong answers; but that we were interested in participants’ ho- nest opinions [33]. A week after the initial invitation was sent, a representative from ChipMaker emailed a second notice to all participants thanking them for participating and asking them to complete the survey if they had not done so. Participants were also asked to complete a follow-up survey two weeks after the initial survey. Of those respondents, 210 (21% of entire sample, 66.8% of Part 1 respondents) completed Part 2. Hence, I had complete data for 210 respondents and used only this matched data in my analyses. A contact from ChipMaker reasoned that the low response rate could be due to a number of factors: low morale due to staff reductions, a sense that the survey didn’t relate to a core business and therefore respondents’ day-to-day activities, and lack of an incentive for completing the survey. Additionally, though the invitation to participate was sent from the Corporate Vice President for Corporate Affairs, that VP may not have been familiar to recipients since he is not in their direct line of command. A few participants res- ponded to the invitation to complete part 2 with messages like, “too long” or “not interested”. Finally, as discussed earlier, the survey was administered during December and January, a time of year when other obligations may take precedence over a voluntary survey. Given the cons- traints with our research design, and the inevitable at- trition in multi-part surveys, a 21% response rate with 210 usable cases seems justifiable.
Though collecting data from a single source, i.e. a self-reported survey, can be a source of common method variance [34], in this study the constructs all reflect indi-
vidual perceptions and cognitions; therefore, no reason- able alternative sources of information exist. To the ex- tent possible, I controlled for common method bias through control variables and study design.
3.3. Sample Characteristics
Two hundred nine participants provided their job category: 165 (78.6%) individual contributors, 28 (13.3%) managers, 12 (5.7%) administrators, and 4 (1.9%) executive managers. A range of tenure categories was present in my sample. Out of the 185 participants who respondents to this question, 7 (3.3%) had worked in their current position at ChipMaker less than 1 year, 13 (6.2%) for 1 year, 12 (5.7%) for 2 years, 19 (9%) for 3, 13 (6.2%) for 4, 22 (10.5%) for 5, 36 (17.1%) for 6, 11 (5.2%) for 7, 18 (8.6%) for 8, 12 (5.7%) for 9, 7 (3.3%) for 10, and 15 (7.1%) for 11 years. Two (1%) of the sample has a high school degree, 42 (20%) some college, 81 (38.6%) a college degree, 59 (28.1%) a master’s degree, 10 (4.8%) a Ph.D. or J.D., and 2 (1%) are current students.
Of the 193 participants providing information about gender, 59 (28.1%) were female and 134 (63.8%) were male. One hundred eighty-five participants provided their age range: 2 (1.0%) 18 - 24 years old, 51 (24.3%) 25 - 34, 72 (34.3%) 35 - 44, 43 (20.5%) 45 - 54, 10 (4.8%) 55 - 64, 5 (2.4%) 65 - 74, and 2 (1%) over 75. One hundred eighty-two respondents offered their race or ethnic background: 12 (5.7%) Black or African-American, 14 (6.7%) Asian, 129 (61.4%) Caucasian, and 18 (8.6%) Hispanic. Six (2.9%) respondents provided multiple categories while 3 (1.4%) specified “other”. One hundred ninety-one participants provided their marital status: 27 (12.9%) single, 142 (67.6%) married, 2 (1%) domestic partnership, and 20 (9.5%) divorced.
3.4. Measures
Social Action at Work. Social action at work (SAW) is directly related to opportunities provided by the partici- pating site, so items were written to reflect the types of charitable and philanthropic opportunities the company provides. A preliminary list based on analysis of ChipMaker’s published material was provided to our focus group who reviewed the items for language and relevance. Participants were asked nine items, “How often do you participate in the following activities?” Activities included items such as “I recycle at work” and “I donate to a charity of choice through my work”. Res- ponses were assessed using a five-item Likert scale with the anchors infrequently and frequently.
charitable giving and volunteerism were included: 1) “I have donated money, property or other assets for cha- ritable purposes in the past 12 months” and 2) “I have performed unpaid work to help people besides my family, friends, or coworkers in the past 12 months.” These were measured on a 5-point Likert scale ranging from strongly agree to strongly disagree. In addition, respondents were asked how important donating and volunteering are to them.
Social Ties. Social ties were measured through three items developed expressly for this study: 1) I am more likely to participate in CSR activities when my cowork- ers attend, 2) I normally volunteer for CSR activities on my own, and 3) I normally volunteer for CSR activities with my coworkers. I had considered asking these ques- tions for each SAW delineated on the survey, but due to the possibility of survey fatigue and on the recommenda- tion of my representatives at ChipMaker, I opted to use fewer items. While this sacrifices some fine-grained data, the possibility of losing a participant at Time 2 was a greater cost.
3.5. Data Analysis
SPSS version 12.0.0 was used for the data analysis. Re- gression analysis was used to test hypotheses involving social ties and past volunteering and charitable donations. ANOVA analyses were utilized to test the hypotheses relating to demographic differences and conduct post hoc tests to probe significant differences among groups. To test the hypotheses, I used an average of the different SAW activities as well as analyzed differences among groups in individual SAW activities.
4. Results
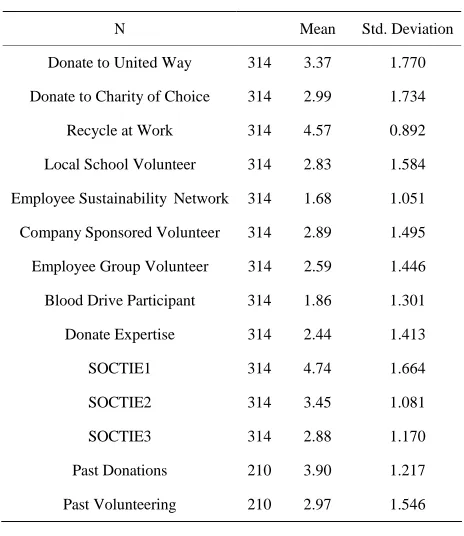
[image:4.595.307.539.96.364.2]Descriptive statistics for the variables are presented in
Table 1 and a summary of the results of the data analysis are presented in Tables 1 through 4. Hypothesis 1 was supported. After controlling for gender, age, and race, employees with more social ties were more likely to participate in SAW, explaining 42.6% of the variance (R2 = 0.426, F(4,241) = 46.501, p < 0.001). Hypothesis 2 was also supported. Employees exhibiting a pattern of participation in volunteering or donating were likely to continue to do so. After controlling for gender, race, and age, this explained 21.5% of variance, R2 = 0.215,
F(5,167) = 10.397, p < 0.001; however, only past vol- unteering was significant (β = 0.308, p < 0.001). Hypo- thesis 3, that women will have higher levels of SAW than men, was supported (see Table 2 for means). On average, women were more likely than men to participate in SAW (F(1,269)=18.487, p < 0.001). Women were more likely to donate to a charity of choice, F(1,269) = 6.315, p = 013,
Table 1. Descriptive Statistics.
N Mean Std. Deviation
Donate to United Way 314 3.37 1.770
Donate to Charity of Choice 314 2.99 1.734
Recycle at Work 314 4.57 0.892
Local School Volunteer 314 2.83 1.584
Employee Sustainability Network 314 1.68 1.051
Company Sponsored Volunteer 314 2.89 1.495
Employee Group Volunteer 314 2.59 1.446
Blood Drive Participant 314 1.86 1.301
Donate Expertise 314 2.44 1.413
SOCTIE1 314 4.74 1.664
SOCTIE2 314 3.45 1.081
SOCTIE3 314 2.88 1.170
Past Donations 210 3.90 1.217
Past Volunteering 210 2.97 1.546
Table 2. SAW by Gender.
Mean—Males N = 190 Mean—Females N = 81
Donate to United Way 3.39 3.67
Donate to Charity of Choice 2.83 3.41
Recycle at Work 4.63 4.58
Local School Volunteer 2.64 3.31
Employee Sustainability Network 2.45 3.09
Company Sponsored Volunteer 2.66 3.65
Employee Group Volunteer 2.45 3.09
Blood Drive Participant 1.78 1.93
Donate Expertise/Skill 2.23 2.93
SAW Average 2.69 3.16
volunteer at a local school, F(1,269) = 10.291, p = 0.001, participate in a sustainability group, F(1,269) = 5.819, p = 0.017, join the ChipMaker sponsored EVP, F(1,269) = 28.452, p < 0.001, volunteer with their employee group,
F(1,269) = 11.401, p < 0.001, or donate their skills or expertise to community organizations, F(1,269) = 14.989,
p < 0.001. There were no significant differences between men and women concerning donating to the United Way,
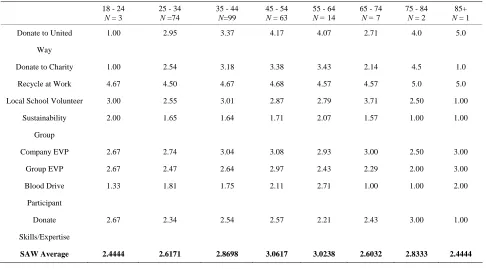
F(1,269) = 1.365, p = n.s., recycling at work F(1,269) = 0.219, p = n.s., or donating blood at work F(1,269) = 0.756, p = n.s. Hypothesis 4, that older employees would be more likely to participate in SAW than employees in ounger age groups was not supported (F(7,255) = 1.630, y
Table 3. SAW by Age.
18 - 24
N = 3
25 - 34
N =74
35 - 44
N=99
45 - 54
N = 63
55 - 64
N = 14
65 - 74
N = 7
75 - 84
N = 2
85+
N = 1
Donate to United 1.00 2.95 3.37 4.17 4.07 2.71 4.0 5.0
Way
Donate to Charity 1.00 2.54 3.18 3.38 3.43 2.14 4.5 1.0
Recycle at Work 4.67 4.50 4.67 4.68 4.57 4.57 5.0 5.0
Local School Volunteer 3.00 2.55 3.01 2.87 2.79 3.71 2.50 1.00
Sustainability 2.00 1.65 1.64 1.71 2.07 1.57 1.00 1.00
Group
Company EVP 2.67 2.74 3.04 3.08 2.93 3.00 2.50 3.00
Group EVP 2.67 2.47 2.64 2.97 2.43 2.29 2.00 3.00
Blood Drive 1.33 1.81 1.75 2.11 2.71 1.00 1.00 2.00
Participant
Donate 2.67 2.34 2.54 2.57 2.21 2.43 3.00 1.00
Skills/Expertise
[image:5.595.56.538.391.571.2]SAW Average 2.4444 2.6171 2.8698 3.0617 3.0238 2.6032 2.8333 2.4444
Table 4. SAW by Race.
Black/African-American N = 14 N Asian = 24 Caucasian N = 179 Hispanic N = 26 Multiple Races N = 7 Other N = 6
Donate to United Way 3.79 3.75 3.37 3.50 2.29 3.33
Donate to Charity 3.00 3.63 2.90 2.69 2.86 2.00
Recycle at Work 4.36 4.25 4.69 4.35 5.00 4.67
Local School Volunteer 3.29 2.54 2.75 3.08 2.86 3.50
Sustainability Group 2.21 1.75 1.61 1.69 2.00 1.50
Company EVP 3.00 2.71 2.94 3.04 3.43 2.67
Group EVP 3.0 2.92 2.60 2.46 3.00 2.67
Blood Drive Participant 1.21 1.88 1.93 1.85 1.57 2.17
Donate Skills/Expertise 3.14 2.75 2.28 2.19 3.29 2.67
SAW Average 3.00 2.90 2.79 2.76 2.91 2.81
p = n.s), nor was Hypothesis 5, that racial and ethnic groups will show different patterns of participation (F(5,250) = 0.268, p = n.s); see Table 4. I did test for differences for each unique SAW initiative. Because the highest age groups had small numbers, I collapsed them into a single category. ANOVA tests showed differences in participation among age groups in United Way dona- tions, F(5,257) = 5.353, p < 0.001, donations to the char- ity of choice, F(5,257) = 3.090, p = 0.01, and giving blood at work F(5,257) = 2.659, p = 0.023. Post-hoc tests, including Tukey, Bonferroni, Scheffe, and LSD reveal that the youngest age groups (18 to 24) are the least likely to en gage in SAW, while employees 45 and older
are the most likely to participate. Even after investigating each SAW individually, no differences among race or ethnic groups in participation levels were observed.
5. Discussion
in the past were also more likely to join SAW initiatives. In terms of demographic differences, women were more likely than men to participate in SAW. In past research, women have exhibited higher tendencies to donate to charitable organizations and to volunteer as well as to display higher levels of ethics of care, which is related to these activities. However, it is important to note that this engenders a crucial question: are women burdened by the expectation to care for others at the expense of activities that might give them more visibility at work or to help promote their career internally. Historically, women have been assigned to “busy work” which can be detrimental to long-term career progression [35]. Additionally, this type of work may involve more emotional labor, and emotional labor requirements of women who have been in positions are more intense [36].
Differences in SAW participation among ethic/racial groups or in age groups were not observed in this study. It is possible due to the small numbers in the population of some of the groups; for example, the two age groups representing the oldest employees contained only four participants. More variance in the sample could produce more robust results. However, it is possible that the cul- tural norms at the sample site overpower the influences that have led to differences among these groups in vol- unteering and donating outside of the work context.
5.1. Limitations
The current study was conducted in the United States and may not be generalizable to other countries. Lee and Chang [37] for example, found different patterns in Ta- wainese citizens’ donating and volunteering behavior from those observed in Western countries. It is reaso- nable to guess that in the context of SAW, national and cultural differences would also emerge.
Due to study constraints at the sample site, it was not possible to collect data regarding some of the dimensions underlying the hypotheses generated here. For example, it would be useful to have been able to measure ethics of care directly rather than using gender as a proxy.
Additionally, some demographic groups had very small populations. Having more evenly distributed group mem- bership would provide more assurance in the pattern of results. Finally, while I attempted to minimize the im- pact of common method bias, it remains a concern.
5.2. Future Research
A number of other characteristics can be identified to investigate as antecedents of SAW. As mentioned, the direct mechanisms such as ethics of care, could be stud- ied to better understand the characteristics of employees who participate in SAW. Future research may be able to incorporate direct, rather than self-reported, measures of
participation in SAW. Additionally, organizational cul- ture likely influences employees in this process. Since the current study was conducted at a single site, it was not possible to investigate this avenue, but I encourage others to compare a single organization at multiple sites as well as multiple organizations to see how the culture affects SAW involvement. In open-ended questions, a handful of participants mentioned they participated in social action outside of work. It would be interesting to see the relationships among the motivations and invol- vement in social action at work and outside of work. Given the study design, I could not investigate the moti- vations to engage in SAW, which is a critical step in the research stream in this area.
5.3. Managerial Implications
Managers can make their SAW programs more suc- cessful if they are able to get more male employees in- volved. Across the board, participation in SAW is low (see Table 1). The most popular SAW programs are recycling at work and donating to the United Way. These programs likely see the highest levels of participation because they are well-established, well-publicized, and easy to use. These programs can serve as a model to im- prove the participation in other SAW initiatives.
Managers should also investigate reasons why women are more likely to participate in these programs and de- velop programs that would gain equal participation among genders. Knowing that social ties aid SAW, ma- nagers can utilize friendship and social networks to pro-mote and carryout CSR initiatives involving employees. They can utilize the information from this paper to help more of their employees participate in enriching SAW activities that provide benefits to the employee him or herself, the company, and the community as a whole.
REFERENCES
[1] A. D. Ellis, “The Impact of Corporate Social Respon- sibility on Employee Attitudes and Behaviors,” The 68th Annual Meeting of the Academy of Management, Chicago, 7-9 August 2009.
[2] A. D. Ellis, “Opportunities for Personal Social Action in the For-Profit Organization,” The 67th Annual Meeting of the Academy of Management, Anaheim, 8-13 August 2008. [3] J. E. Booth, K. W. Park and T. M. Glomb, “Emplo-yer-
Supported Volunteering Benefits: Gift Exchange among Employers, Employees, and Volunteer Organiza- tions,” Human Resource Management, Vol. 48, No. 2, 2009, pp. 227-249.
http://dx.doi.org/10.1002/hrm.20277
http://dx.doi.org/10.1007/s10551-005-7101-x
[5] J. Peloza and D. N. Hassay, “Intra-Organizational Volun- teerism: Good Soldiers, Good Deeds and Good Politics,” Journal of Business Ethics, Vol. 64, No. 4, 2006, pp. 357- 379. http://dx.doi.org/10.1007/s10551-005-5496-z [6] D. K. Peterson, “Benefits of Participation in Corporate
Volunteer Programs: Employees’ Perceptions,” Personnel Review, Vol. 33, No. 6, 2004, pp. 615-627.
http://dx.doi.org/10.1108/00483480410561510
[7] M. S. Granovetter, “Strength of Weak Ties,” American Journal of Sociology, Vol. 78, No. 6, 1973, pp. 1360- 1380. http://dx.doi.org/10.1086/225469
[8] J. M. Podolny and J. N. Baron, “Resources and Rela- tionships: Social Networks and Mobility in the Work- place,” American Sociological Review, Vol. 62, No. 5, 1997, pp. 673-693.
[9] M. Dixon and V. J. Roscigno, “Status, Networks, and Social Movement Participation: The Case of Striking Workers,” American Journal of Sociology, Vol. 108, No. 6, 2003, pp. 1292-1327. http://dx.doi.org/10.1086/375198 [10] D. McAdam and R. Paulsen, “Specifying the Relationship
between Social Ties and Activism,” American Journal of Sociology, Vol. 99, No. 3, 1993, pp. 640-667.
http://dx.doi.org/10.1086/230319
[11] P. Oliver, “If You Don’t Do It, Nobody Else Will: Active and Token Contributors to Local Collective Action,” American Sociological Review, Vol. 49, No. 5, 1984, pp. 601-610. http://dx.doi.org/10.2307/2095418
[12] R. Shemtov, “Social Networks and Sustained Activism in Local NIMBY Campaigns,” Sociological Forum, Vol. 18, No. 2, 2003, pp. 215-244.
[13] E. J. Walsh and R. H. Warland, “Social Movement Involvement in the Wake of a Nuclear Accident: Activists and Free Fiders in the Tmi Area,” American Sociological Review, Vol. 48, No. 6, 1983, pp. 764-780.
http://dx.doi.org/10.2307/2095324
[14] A. Schussman and S. A. Soule, “Process and Protest: Accounting for Individual Protest Participation,” Social Forces, Vol. 84, No. 2, 2005, pp. 1083-1108.
http://dx.doi.org/10.1353/sof.2006.0034
[15] E. Brown and J. M. Ferris, “Social Capital and Philan- thropy: An Analysis of the Impact of Social Capital on Individual Giving and Volunteering,” Nonprofit and Vo- luntary Sector Quarterly, Vol. 36, No. 1, 2007, pp. 85-99. http://dx.doi.org/10.1177/0899764006293178
[16] H. E. Brady, K. L. Schlozman and S. Verba, “Pros- pecting for Participants: Rational Expectations and the Recruitment of Political Activists,” The American Politi- cal Science Review, Vol. 93, No. 1, 1999, pp. 153-168. http://dx.doi.org/10.2307/2585767
[17] K. S. Jones, “Giving and Volunteering as Distinct Forms of Civic Engagement: The Role of Community Integ- ration and Personal Resources in Formal Helping,” Non- profit and Voluntary Sector Quarterly, Vol. 35, No. 2, 2006, pp. 249-266.
http://dx.doi.org/10.1177/0899764006287464
[18] M. A. Musick, J. Wilson, and W. B. Bynum, “Race and Formal Volunteering: The Differential Effects of Class
and Religion,” Social Forces, Vol. 78, No. 4, 2000, pp. 1539-1570.
[19] L. Kulik, “Explaining Responses to Volunteering: An Ecological Model,” Nonprofit and Voluntary Sector Quar- terly, Vol. 36, No. 2, 2007, pp. 239-255.
http://dx.doi.org/10.1177/0899764006295994
[20] United Blood Services, “Blood Drive Success: A Guide for Workplace Blood Drive Coordinators,” 2007. http://www.unitedbloodservices.org/getInvolved.aspx [21] L. C. Lee, J. A. Piliavin and V. R. A. Call, “Giving Time,
Money, and Blood: Similarities and Differences,” Social Psychology Quarterly, Vol. 62, No. 3, 1999, pp. 276-290. http://dx.doi.org/10.2307/2695864
[22] J. R. Smith and A. McSweeney, “Charitable Giving: The Effectiveness of a Revised Theory of Planned Behaviour Model in Predicting Donating Intentions and Behaviour,” Journal of Community & Applied Social Psychology, Vol. 17, No. 5, 2007, pp. 363-386.
http://dx.doi.org/10.1002/casp.906
[23] H. Taniguchi, “Men’s and Women’s Volunteering: Gen-der Differences in the Effects of Employment and Family Characteristics,” Nonprofit and Voluntary Sector Quar-terly, Vol. 35, No. 1, 2006, pp. 83-101.
http://dx.doi.org/10.1177/0899764005282481
[24] L. Andersson, R. Giacalone and C. Jurkiewicz, “On the Relationship of Hope and Gratitude to Corporate Social Responsibility,” Journal of Business Ethics, Vol. 70, No. 4, 2007, pp. 401-409.
http://dx.doi.org/10.1007/s10551-006-9118-1
[25] F. F. Brunel and M. R. Nelson, “Explaining Gendered Responses to ‘Help-Self’ and ‘Help-Other’ Charity ad Appeals: The Mediating Role of World-Views,” Journal of Advertising, Vol. 29, No. 3, 2000, pp. 15-28.
[26] R. Karniol, E. Grosz and I. Schorr, “Caring, Gender Role Orientation, and Volunteering,” Sex Roles, Vol. 49, No. 1-2, 2003, pp. 11-19.
http://dx.doi.org/10.1023/A:1023953401662
[27] M. C. D. de Leon and J. F. Diaz-Morales, “Volunteerism and Elderly,” Anales De Psicologia, Vol. 25, No. 2, 2009, pp. 375-389.
[28] C. J. Einolf, “Will the Boomers Volunteer During Re-tirement? Comparing the Baby Boom, Silent, and Long Civic Cohorts,” Nonprofit and Voluntary Sector Quar-terly, Vol. 38, No. 2, 2009, pp. 181-199.
http://dx.doi.org/10.1177/0899764008315182
[29] S. K. Gallagher, “Doing Their Share: Comparing Patterns of Help Given by Older and Younger Adults,” Journal of Marriage and the Family, Vol. 56, No. 3, 1994, pp. 567- 578. http://dx.doi.org/10.2307/352868
[30] B. Suanet, M. B. van Groenou and A. W. Braam, “Chan- ges in Volunteering among Young Old in the Netherlands between 1992 and 2002: The Impact of Religion, Age- Norms, and Intergenerational Transmission,” European Journal of Ageing, Vol. 6, No. 3, 2009, pp. 157-165. http://dx.doi.org/10.1007/s10433-009-0119-7
Whites,” Nonprofit and Voluntary Sector Quarterly, Vol. 38, No. 6, 2009, pp. 929-955.
http://dx.doi.org/10.1177/0899764008322779
[32] J. Wilson, “Volunteering,” Annual Review of Sociology, Vol. 26, No. 1, 2000, pp. 215-240.
http://dx.doi.org/10.1146/annurev.soc.26.1.215
[33] P. M. Podsakoff, S. B. MacKenzie, J. Y. Lee, and N. P. Podsakoff, “Common Method Biases in Behavioral Research: A Critical Review of the Literature and Recom- mended Remedies,” Journal of Applied Psychology, Vol. 88, No. 5, 2003, pp. 879-903.
http://dx.doi.org/10.1037/0021-9010.88.5.879
[34] P. E. Spector, “Using Self-Report Questionnaires in OB Research: A Comment on the Use of a Controversial Me-
thod,” Journal of Organizational Behavior, Vol. 15, No. 5, 1994, pp. 385-392.
http://dx.doi.org/10.1002/job.4030150503
[35] E. Martin, “Power and Authority in the Classroom: Sexist Stereotypes in Teaching Evaluations,” Signs, Vol. 9, No. 3, 1984, pp. 482-492. http://dx.doi.org/10.1086/494073 [36] A. R. Hochschild, “The Managed Heart:
Commercializa-tion of Human Feeling,” 20th Anniversary EdiCommercializa-tion, Uni-versity of California Press, Berkeley, 2003.