Magnetotail dipolarization and associated current
systems observed by Cluster and Double Star
M. Volwerk,1,2 A. T. Y. Lui,3 M. Lester,4A. P. Walsh,5 I. Alexeev,5X. Cao,6 M. W. Dunlop,7 A. N. Fazakerley,5A. Grocott,4 L. Kistler,8 X. Lun,6C. Mouikis,8 Z. Pu,6 C. Shen,9 J. K. Shi,9M. G. G. T. Taylor,10 W. Baumjohann,1 R. Nakamura,1 A. Runov,11 Z. Vo¨ro¨s,1,12T. L. Zhang,1 T. Takada,13 H. Re`me,14 B. Klecker,2 and C. M. Carr15
Received 13 August 2007; revised 29 May 2008; accepted 18 June 2008; published 8 August 2008.
[1] A dipolarization and its associated current systems are studied using Cluster,
Double Star TC1, and ground-based observations. The Cluster spacecraft are located approximately 16 RE downtail near 0030 LT. The Double Star TC1 spacecraft is located
more earthward at approximately 7 RE just before local midnight. Auroral observations
by the Wideband Imaging Camera on the Imager for Magnetopause-to-Aurora Global Exploration spacecraft are used to determine the onset times of substorms. It is shown that the magnetic phenomena at the earthward site of a magnetic reconfiguration region are governed by field-aligned currents, which in their turn generate auroral brightenings near the foot points of the spacecraft. It is also shown that the inward and outward motion of the dipolarization front near Cluster has a direct influence on the parallel plasma flow at TC1, indicating a piston mechanism. Just like a piston, the inward moving dipolarization at Cluster pushes in plasma along with the flux transport, which turns to parallel plasma flow at TC1. When the flow reverses at Cluster, i.e., outgoing flux transport, the plasma gets ‘‘sucked out’’ again, which is directly reflected in the plasma data from TC1.
Citation: Volwerk, M., et al. (2008), Magnetotail dipolarization and associated current systems observed by Cluster and Double Star,J. Geophys. Res.,113, A08S90, doi:10.1029/2007JA012729.
1. Introduction
[2] Reconnection, current disruption, and/or the
balloon-ing instability (for a discussion of the distinction between these, see, e.g.,Haerendel[1992],Parker[1996],Lui[2000],
Baumjohann et al.[2007]) and associated processes before and after their onset in the Earth’s magnetotail rearrange the magnetic configuration of the tail. It has been shown that before substorm onset the magnetotail current sheet thins [e.g., Baumjohann et al., 1992; Sanny et al., 1994]. At substorm onset, on the earthward side of the reconfiguration region, there will be fast earthward flows, often called bursty
bulk flows (BBFs) [Baumjohann et al., 1990;Angelopoulos et al., 1994;Scho¨del et al., 2001a, 2001b;Nakamura et al., 2001a, 2001b]. The changes of the magnetic topology and the energy release in the tail will be associated with various kinds of ionospheric phenomena such as aurora [Aikio et al., 2004;Morooka et al., 2004;Chaston et al., 2005] and (field-aligned) currents [e.g., Untiedt and Baumjohann, 1993;
Kaufmann et al., 2001, 2003].
[3] In this paper, a closer look is taken at the processes
earthward from the reconfiguration site, with emphasis on the currents associated with fast flows and flux transport. One event in the Cluster tail season of 2005 is studied with a conjunction of Cluster and TC1. The currents are deter-mined qualitatively from the magnetic field data. As the JOURNAL OF GEOPHYSICAL RESEARCH, VOL. 113, A08S90, doi:10.1029/2007JA012729, 2008
Click Here
for Full Article
1Space Research Institute, Austrian Academy of Sciences, Graz, Austria.
2Max Planck Institute for Extraterrestrial Physics, Garching, Germany. 3
Johns Hopkins University Applied Physics Laboratory, Laurel, Maryland, USA.
4
Department of Physics and Astronomy, University of Leicester, Leicester, UK.
5
Mullard Space Science Laboratory, University College London, Dorking, UK.
6Institute of Space Physics and Applied Technology, Peking University, Beijing, China.
7Space Sciences Division, Rutherford Appleton Laboratory, Didcot, UK.
Copyright 2008 by the American Geophysical Union. 0148-0227/08/2007JA012729$09.00
A08S90
8Space Science Center, University of New Hampshire, Durham, New Hampshire, USA.
9Laboratory for Space Weather, Center for Space Science and Applied Research, Chinese Academy of Sciences, Beijing, China.
10
European Space Research and Technology Center, European Space Agency, Noordwijk, Netherlands.
11
IGPP, University of California, Los Angeles, California, USA. 12Institute for Astro- and Particle Physics, University of Innsbruck, Innsbruck, Austria.
13Institute of Space and Astronautical Science, Japan Aerospace Exploration Agency, Sagamihara, Japan.
14CESR, CNRS, Toulouse, France. 15
Department of Physics, Imperial College, London, UK.
Cluster spacecraft are too far apart in 2005 (approximately 10,000 km, except for C3 and C4 which are separated a few 100 km) the curlometer technique [Dunlop et al., 2002] cannot be applied. The electron data will be checked to make more qualitative estimates of the electron current flowing during the events.
[4] The event in this paper gives a wider view of the
activity in the magnetotail during reconfiguration. With data from both Cluster and Double Star TC1 the range between
XGSM 16REandXGSM 7REis probed and shown to
be directly linked. Indeed, e.g., both experiments show an increase in the cross-tail current before substorm onset at basically the same time, which will be discussed below.
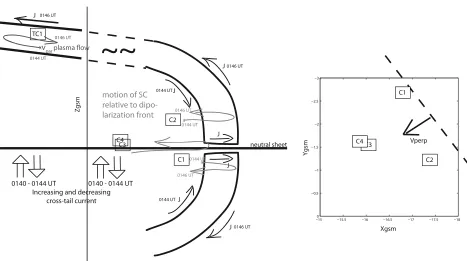
[5] A schematic view of the activity in the magnetotail near
Cluster and Double Star TC1 is given in Figure 1. Before substorm onset an increase in cross-tail current is measured at both experiments. After onset a dipolarization front moves over two spacecraft of Cluster (C1/2) showing clearly the field-aligned currents flowing, and only the front part reach-ing the other two spacecraft (C3/4), before the dipolarization front reverses. At the same time TC1 observes strong field-aligned plasma flow moving earthward and then, as the dipolarization reverses at Cluster, the plasma flow at TC1 becomes parallel tailward. This indicates a piston motion of the dipolarization front, pushing in and sucking out the plasma in the dipolarization flux tubes. Also, TC1 shows the earthward currents, linking it to the ‘‘back side’’ of the current loops.
2. Event
[6] On 5 September 2005, between 0130 and 0200 UT,
there was strong activity in the Earth’s magnetosphere. The
solar wind observatory ACE showed a southward turning of the magnetic field just before 0000 UT, which lasted until 0400 UT. The auroral images from Imager for Magnetopause-to-Aurora Global Exploration (IMAGE) Wideband Imaging Camera (WIC) [Mende et al., 2000] in Figure 2 show that there are two brightenings of the aurora, one at 0135 UT followed by another intensification at 0145 UT.
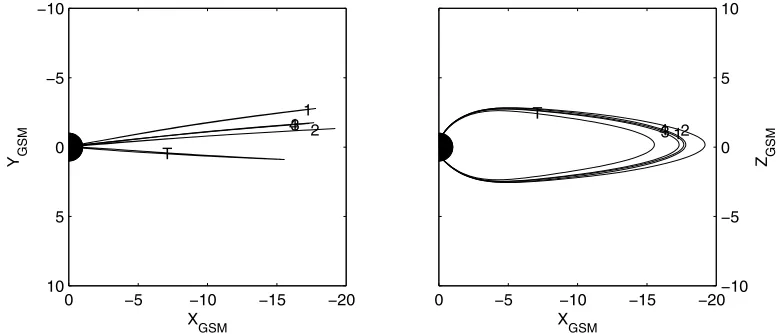
[7] There was an opportune constellation at the nightside
of the Earth, with Cluster nearXGSM 16REand Double
Star TC1 nearXGSM 7RE. An overview of the locations
of the spacecraft is shown in Figure 3, where the field lines through the spacecraft have been traced using the T96 model [Tsyganenko and Stern, 1996], and listed in Table 1. Because of the strong activity in the magnetosphere, the field lines do not show the real magnetic location of the spacecraft and are only shown as indicative. The Cluster spacecraft are located near 0030 LT, whereas TC1 is located just before 0000 LT. [8] This event is characterized by an onset determined
from auroral images to be at0135 UT, which means, with the image rate from the IMAGE spacecraft it might be up to 2 min earlier. Studying the auroral images, it is found that there is another onset at0145 UT. This second onset is of interest because of a brightening of the aurora at the presumed foot points of the spacecraft and because the spacecraft measure strong flows and magnetic fluctuations. Note that most of the auroral activity is taking place at the dusk side of the magnetotail, which means that most likely the main activity in the tail is not observed by the spacecraft.
2.1. Double Star TC1 Observations
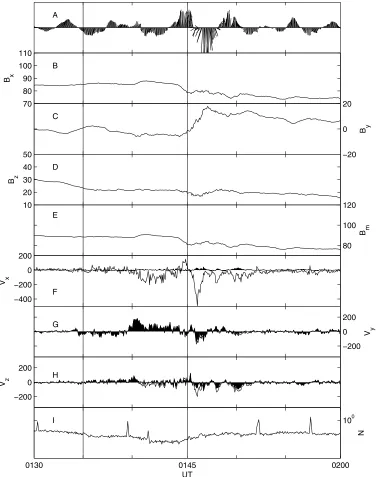
[9] Before and after the substorm onset at0135 UT there
[image:2.612.75.542.52.313.2]is little activity at TC1, only a slight increase inBy, and no
Figure 1. (left) A schematic sketch of the current tubes passing by C1/2 and approaching C3/4 during the dipolarization withBysignature. The black arrows show the current flow in the loop. The grey arrows
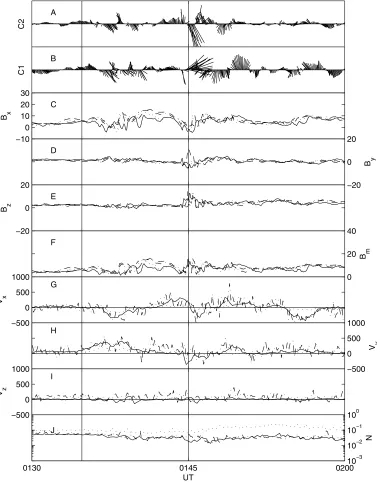
significant flows. In Figure 4 the magnetic field FGM [Carr et al., 2005] and plasma HIA [Re`me et al., 2005] data are shown in the GSM coordinate system. The filled regions under the graphs of the plasma velocity represent v?, the component of the flow perpendicular to the magnetic field (v? = v ^b(vB)/jBj). Starting at 0140 UT significant tailward (parallel to the field) and duskward (perpendicular to the field) plasma flows are observed at TC1. They last until 0143 UT and change direction in all three components at 0144 UT just before the next onset at
0145 UT. Indeed, it could be argued that substorm onset takes place at 0144 UT considering the 2-min resolution of the auroral images. Note that the flows in the XGSM
direction are all parallel to the field, whereas in the Y ZGSM directions the flows are basically completely
perpendicular. The tailward flow is associated with a strong
Byvariation of the magnetic field. There is a slight decrease
inBzand an increase inBxindicating a change in the field
configuration from more dipole-like to more tail-like. [10] In Figure 4 (top) a feather plot of the perpendicular
magnetic field is shown. The data have been transformed
into a mean field-aligned (MFA) coordinate system (the mean field is determined by a low-pass filter passing variations above 10 min) and is directed out of Figure 4 and the two perpendicular directions are mainly eastward (along time axis) and northward (perpendicular to time axis). The first part between 0130 and 0143 UT shows an almost regular variation of the field direction with a period of4 min with some variations on the amplitude in the later ones. Most likely, these are the signatures of transverse ULF waves.
[11] Just after the start of the increase of the magnetic
field strength (Bxand Bm) at 0140 UT, an indication of
[image:3.612.76.542.61.243.2]increased cross-tail current, the small-amplitude transverse field changes direction but does not rotate and just before the end of the increased magnetic field at 0144 UT, the field changes again and rotates counterclockwise. Such a signature in the transverse field is often related to the presence of magnetic field-aligned currents. For examples of feather plot signatures of magnetic field-aligned current crossings, seeVolwerk et al.[1996, Figure 4]. The counter-clockwise rotation indicates a parallel current (with regard Figure 2. The Wideband Imaging Camera auroral images of the southern hemisphere. The foot points
of Cluster are mapped to and shown in the auroral region. The foot point of TC1 is located slightly duskward of midnight.
Figure 3. The locations of the spacecraft and the T96 field lines traced through them in the GSMxyand
xzplane.
[image:3.612.110.501.547.714.2]to the magnetic field) and thus from the magnetosphere into the ionosphere.
[12] After the onset at0145 UT the feather plot shows
two counterclockwise rotations of the field at 0146 and
0148 UT. These rotations of the field seem to be well correlated with the two tailward flow bursts observed in thevx
panel. These rotations are related to field-aligned earthward currents that start to flow near TC1, which are confirmed by the electron data below.
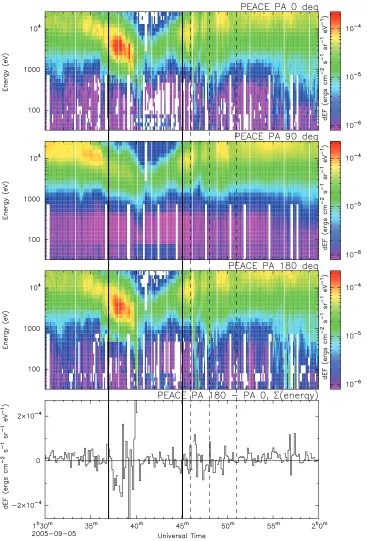
[13] The Plasma Electron And Current Experiment
(PEACE) [Johnstone et al., 1997] data are shown in Figure 5; the first panel shows 0 – 15 degree pitch angle electrons (parallel to the magnetic field), the second panel shows 75 – 90 degree pitch angle electrons (perpendicular to the magnetic field), and the third panel shows 165 – 180 degree pitch angle electrons (antiparallel to the magnetic field). The electron moments can give an indication of the currents flowing along the magnetic field, as shown by
Alexeev et al. [2005]. In this paper we will only use the PEACE data for qualitative results on the electron current. In the fourth panel of Figure 5 the difference between the parallel and antiparallel electron flux is shown.
[14] Just after the first onset there is a net antiparallel
electron flux, which would indicate an earthward current, which is nicely visible in Figure 5 (bottom). During the time around the second onset at 0145 UT, it is difficult to infer which fluxes are stronger from the spectra; however, the bottom panel shows that around onset there is a net tailward electron flux, which means earthward current, similarly for the next rotation at 0147 UT.
2.2. Cluster Observations
[15] In Figure 6 we show the magnetometer data from
FGM [Balogh et al., 2001] and the plasma data from CIS HIA (C1 and C3) and CODIF (C4) [Re`me et al., 2001] and feather plots of the perpendicular magnetic field for C2 and C1.
[16] Before the onset determined at 0135 UT there is
little activity in the magnetic field and plasma flows at Cluster. After onset there are strong fluctuations in the Bx
for all four spacecraft. The fluctuations become less after
0140 UT, whereafter the Bx has increased significantly.
Figure 7 shows a reduced version of the data, with the plasma
flow velocity separated for the three spacecraft. It can be seen that the oscillations of the magnetic field happen with strong, mainly perpendicular tailward flow, which lasts longer for C1 as compared with C3 and C4. As soon as the oscillations die out, the flows also stop.
[17] The difference in theBxcomponents of the magnetic
field data from C3 and C4, a closely separated pair inZGSMin
this configuration, is used to get a proxy for the cross-tail current. After the onset at0135 UT the cross-tail current increases (with some oscillations superposed). The increased level of the cross-tail current is maintained until0144 UT, which is when the strong perpendicular earthward flow starts at C1. Also the differences in Bx between the spacecraft
increase, which indicates that the current sheet is thinning. Note that the change in bulk flow direction, from tailward to earthward, does not have a significant influence on the thinning of the current sheet or on the average cross-tail current level apart from the dip at flow reversal, from which it recovers quickly and may be an artifact created by magnetic field oscillations.
[18] At 0144 UT the plasma flow at C1 turns mainly
perpendicular to the magnetic field, while at the same time the Bxof all spacecraft start to decrease and the cross-tail
current returns to its preevent value. Simultaneously for C1 and C2 there is an increase inBz, whereasByshows a slight
decrease for C1 and an increase for C2, with C1 and C2 in the southern and northern hemispheres of the tail, respectively. At 0145 UT the flow reverses and becomes tailward. During the tailward flow theBzsignature slowly reduces to
near zero again and theBxincreases. These signatures show a
dipolarization region moving earthward and receding again. This could be an indication of the spacecraft being in the neighborhood of a reconnection X line [see, e.g.,Runov et al., 2003]. However, the poor correlation between thevxreversal
and the BxBy signature suggests that the change in flow
direction is not associated with X line motion.
[19] The magnetic signatures at C3 and C4 are quite
different from C1/2. AlthoughBxdecreases simultaneously
with C1 and C2, very little perpendicular flow is observed. The decrease ofBxis not accompanied by an increase inBz
and thus this is no dipolarization. Immediately after 0145 UT, there is a increase in both Bx and Bz with no
signature inBy.
[20] The feather plots show some rotations of the magnetic
field during the wavy period. C2 shows a single full rotation of the field at 0139 UT, whereas C1 shows two full rotations of the field approximately 1 min before and after the observation of C2. This can either be created by the spacecraft passing by field-aligned currents or by elliptically polarized waves traveling along the field. At0144 UT, large rotations of the magnetic field are observed, counterclock-wise for C1 (parallel current) and clockcounterclock-wise for C2 (antipar-allel current), with both spacecraft in opposite hemispheres of the tail this would indicate tailward current at both spacecraft. Two minutes later at0146 UT, there are rotations again, this time in the opposite direction and therefore oppositely directed currents.
[21] The PEACE data for this event for C1, C2 and C4
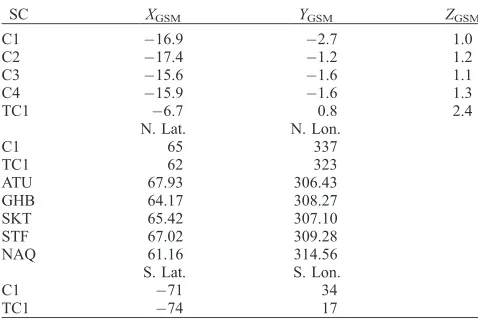
[image:4.612.60.299.96.256.2]are shown in Figure 9 in the same format as in Figure 5. At 0139 UT, during the rotations of the field observed by C1 and C2 the PEACE data show little indication of any Table 1. Location of the Spacecraft, the T96-Traced Foot Points
of the Spacecraft, and the Location of the Ground Magnetometer Stations
SC XGSM YGSM ZGSM
C1 16.9 2.7 1.0
C2 17.4 1.2 1.2
C3 15.6 1.6 1.1
C4 15.9 1.6 1.3
TC1 6.7 0.8 2.4
N. Lat. N. Lon.
C1 65 337
TC1 62 323
ATU 67.93 306.43
GHB 64.17 308.27
SKT 65.42 307.10
STF 67.02 309.28
NAQ 61.16 314.56
S. Lat. S. Lon.
C1 71 34
significant asymmetry between the parallel and antiparallel electrons at C1.
[22] For C1, between 0144 and 0145 UT the antiparallel
electrons are slightly more intense than the parallel, whereas between 0145 and 0146 UT the parallel electrons are more intense than the antiparallel. This indicates first a parallel (tailward) current and then an antiparallel (earthward) cur-rent, as the spacecraft is in the Southern Hemisphere during this interval. This agrees with the magnetic field rotations. For C2, however, the situation is less clear. There is a slightly stronger antiparallel flux between 0145 and 0146 UT; there is little to say about the resulting flux after 0146 UT. C4 shows between 0145 and 0146 UT (after onset) and just after
0146 UT increased parallel electron fluxes, which would indicate a tailward current.
2.3. Ground-Based Observations
[23] As far as mapping of field lines can be trusted in active
[image:5.612.119.495.57.534.2]periods of the magnetosphere, the foot points of the various spacecraft map closely to Greenland. The data of the mag-netic field from the Greenland magnetometer chain are shown in Figure 10. The data are shown for the stations Attu, Godthab, Narsarsuaq, Sukkertoppen, and Sondre Stromfjord (location is shown in Table 1). In Figure 10 the data are stacked by latitude and shifted 100 nT between stations.
Figure 4. Double Star TC1 data in GSM coordinates. (a) Feather plot of the perpendicular magnetic field. (b – e) The magnetic field data. (f – i) Plasma data all velocity components vand density N. The dashed lines show the starting times of eventsE1 andE2.
[24] After the onset at 0135 UT there is not much
activity in the Greenland magnetometers. There is a mainly the recovery of the field after the activity in the event before. However, at the onset at0145 UT there are again negative bays in the higher-latitude stations inBHand there is a strong
negative bay for GHD inBz, whereas SKT, STF, and ATU
show a positive bay. This shows that the westward electrojet is located northward from GHD.
[25] Later in the event, at0147 UT there is a reversal in
the Bz signature for STK from positive to negative DBz.
[image:6.612.125.492.56.597.2]This indicates a northward shift of the westward electrojet at0147 UT, which is near the end of the tailward flow measured by C1. Most likely, this is not unrelated to the Figure 5. Double Star TC1 PEACE data. (top) The electron spectrograms for parallel electrons,
dipolarization event observed by C1, driving the electrojet above the Greenland stations and the inward-outward motion moving the electrojet equatorward and poleward, respectively.
3. Interpretation
[26] It should be noted that these events measured by TC1
and Cluster are peripheral events connected to activity that is mainly taking place in the duskward side of the magnetotail. In Figure 2 it is clear that very little is happening near the foot points of Cluster and the foot point of TC1 (not shown
in Figure 2) is located on the dawnward boundary of the active region. However, despite the positions of the space-craft, several interesting things happen. The events studied in this paper are reminiscent of a study byDraper et al.[2005], who looked at field-aligned current related to a tailward traveling plasmoid.
[27] From the location of the spacecraft it is clear that
Cluster and Double Star TC1 are in different environments in the magnetotail. Cluster is located near the central plasma sheet, whereas TC1 is located at higherZGSMandBxin the
lobe of the tail. The YGSM separation between the two
[image:7.612.118.495.58.540.2]experiments is3.5RE(greatest distance between C1 and
Figure 6. Cluster data in GSM coordinates. (a – b) Feather plot of the perpendicular magnetic field for C2 and C1. (c – f ) The magnetic field data from Cluster in the usual line styles C1 (solid), C2 (dashed), C3 (dotted), and C4 (dash-dotted). (g – j) Plasma datavandN. The dashed lines show the starting times of eventsE1 andE2.
TC1). This means that statistically all spacecraft can be in the influence region of the fast flow measured by C1.
Nakamura et al. [2004] have shown that the width of a flow channel in the tail is typically3RE. This would mean
that the distance between C1 and TC1 would be slightly too large. However, timing analysis on theBzcomponent of the
magnetic field data from Cluster shows that the dipolariza-tion front is tilted in theX YGSM plane in the direction
[0.8, 0.6] (see Figure 1, right), which effectively reduces the distance between C1 and TC1. We may therefore assume that TC1 will measure effects related to magnetic and flow activity registered at the Cluster spacecraft.
[28] We concentrated on the large-scale behavior of the
magnetotail in the region where Cluster and Double Star are located, i.e., the fast flows at Cluster and the inward-outward motion of the dipolarization, the fast field-aligned flows at
TC1, and the associated currents and signatures on the ground. A summary of what is observed is given in Table 2 and graphically depicted in Figure 1.
[29] It was found that C1 and C2 are on opposite sides of
the neutral sheet during 0144 – 0146 UT and have oppositeBy
signatures. The nonchanging By signatures over the flow
reversal show that the spacecraft are not at a reconnection X line but most likely are observing current systems related to the observed dipolarization. Clearly, the perpendicular flow over the spacecraft must be started, stopped, and reversed, at the same time creating the dipolarization andBysignature. This can be done by, e.g., inertial currents [Haerendel, 1992]. [30] The perpendicular earthward flow is transporting
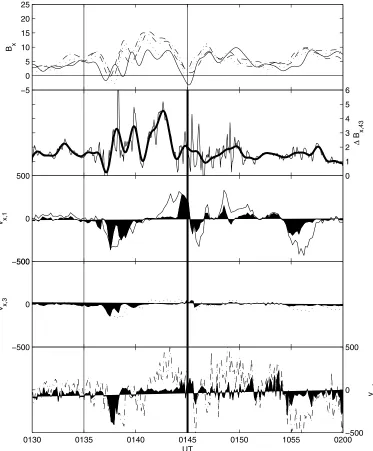
[image:8.612.118.491.57.508.2]magnetic flux over the two spacecraft. On the boundary of this structure currents are flowing, as can be seen in the feather plots of C1 and C2. At the start of the dipolarization Figure 7. (a) The Bxfor Cluster, low passed filtered with the usual colors for the Cluster spacecraft.
(b) The difference in Bx from C4 and C3 for normal and low-passed filtered data. (c – e) The vxfor
at C1 there is a strong counterclockwise rotation of the field, which means a parallel current. Slightly later, as the dipolarization reaches C2, there is a clockwise rotation of the field, which means an antiparallel current. These
cur-rents will be closed as shown in Figure 1, thereby creating the impression of two current loops which create the oppositeBysignatures measured by C1 and C2. Integrating
[image:9.612.101.509.58.288.2]thevx,?signature shows that the structure can reach C3 and Figure 8. Combined data from C1, C2, C3, and TC1. (a – c) The magnetic field components for the four
spacecraft, with Cluster in the usual colors and TC1 in magenta. (d) Thevxfor C1 with the perpendicular
component shown as the filled region under the graph and TC1vx.
Figure 9. The Cluster PEACE data for C1, C2, and C4. The electron spectrograms for (top) parallel electrons, (middle) perpendicular electrons, and (bottom) antiparallel electrons. The two solid vertical lines show the time of substorm onset.
[image:9.612.91.526.405.705.2]C4 before the perpendicular flow reverses. The structure moves tailward again, and C1 and C2 exit and the dipolarization gradually changes to a stretched field line configuration again.
[31] The C3 and C4 spacecraft observe a different
mag-netic structure, an increasedBxand an increasedBzwith no By signature. These spacecraft remain in the northern hemisphere. The currents associated with this structure are antiparallel. This would be in agreement with the loop in the northern hemisphere reaching these two spacecraft. These spacecraft are basically located in the neutral sheet, which explains why there is both an increase inBxandBz, created
by the current system.
[32] The Cluster PEACE data confirm the deduced
cur-rents from the feather plots, tailward curcur-rents at both C1 and C2 at the beginning and earthward currents later. C4 shows a
residual parallel electron flux and thus a tailward current after the onset at 0145 UT. This means that the front of the current loop reaches and crosses C3/4 and moves back over these spacecraft again. With C3/4 in the northern hemisphere of the tail, it is expected that they observe the same current signature as C2 at the beginning, which is indeed the case.
[33] The closure of the currents can happen in two ways:
[image:10.612.125.481.56.483.2]either along theXdirection or in theYdirection, as indicated in Figure 1 by the arrows in the X direction and the two (toward and away) symbols for the Y direction. Using the proxy for the cross-tail current in Figure 7, it can be seen that as the perpendicular flow starts at C1 the cross-tail current starts to increase, whereas when the perpendicular flow reverses the cross-tail current starts to decrease. This is an indication that the currents in the loops are mainly closed along the Y direction. The interpretation for this is easily Figure 10. The Greenland magnetometer data for five stations stacked by latitude and shifted for
visibility: ATU (black, +200 nT), STF (magenta, +100 nT), SKT (blue), GHB (red, 100 nT), and NAQ (green, 200 nT). The coordinate system is such that H is northward, E is eastward, and
found. The perpendicular flow transports magnetic flux, and in order to get the field lines moving in theXdirection there has to be a force. The spacecraft are not at the reconfiguration region, where it may be assumed that the tension of the magnetic field will help to accelerate the field and plasma. Therefore, there has to be another force, the Lorentz force, which sets the field in motion. Indeed, for earthward accel-eration a positive Jy is needed and for decelerating and
reversal a negativeJy(see, e.g., the inertial currents given
byShiokawa et al.[1997]).
[34] How does the fast parallel tailward flow and the
currents observed by TC1 fit into the global picture? This is easily explained with the flows observed at Cluster and Figure 8. Just after the flow at Cluster starts to turn perpendicular and thus starts to move flux inward, the parallel earthward flow starts at TC1. Then just after 0145 UT the perpendicular flow at Cluster turns tailward and almost simultaneously the parallel flows at TC1 reverse and turn tailward. The motion of the magnetic flux, i.e., the dipolarization and stretching works as a piston in the magnetotail. First, it will push in the plasma, also evidenced by the earthward parallel flow observed by Cluster before 0143 UT. At the sudden reversal of the flow, the plasma is ‘‘sucked’’ out again by the flux moving outward, like a piston.
[35] Interestingly, the currents that were determined for
TC1 during 0145 – 0148 UT are oppositely directed from the currents observed by C2, even though the spacecraft are in the same hemisphere of the magnetotail. In the large-scale model assumed in this paper, this can be interpreted in, at least, two ways: either TC1 is located at higher magnetic latitude then C2 and observes the earthward current on the north side of the loop in Figure 1 or TC1 and C2 are located near the opposite boundaries of the current channel and the currents can be seen as a small substorm current wedge.
[36] The reversal of the BZ signature at the Greenland
station SKT at0146 UT indicates a northward moving of the electrojet. This in agreement with the outward moving dipolarization front observed at Cluster.
4. Discussion
[37] In all, the whole event shows the characteristics of a
reconnection/current disruption event in the region tailward of Cluster. Similar to reconnection, current disruption can cause earthward flow when it is located tailward of an
observing site as discussed byLui et al.[1993]. The overall picture shows that after a previous substorm event the magnetotail is stretched again and the cross-tail current increases (over the whole region between TC1 and Cluster) and the current sheet thins. Substorm onset, the reconfig-uration of the magnetic field, the production of plasma flow, and magnetic flux transport, is tailward from Cluster at 0144 UT, which stops rather quickly and the inward moving flux moves outward again.
[38] The currents that are discussed above are not directly
measured by, e.g., the curlometer technique, as the spacecraft are not well situated. Only the inference from magnetic field rotations combined with simultaneous electron data have given us insight into the magnetic field-aligned currents related to this dipolarization, without giving any quantitative results for the current density. The combination of the two shows that the spacecraft are physically crossing the current layers. The question may arise whether the signatures that have been measured cannot be explained by other mecha-nisms, such as waves. Indeed, this may well be the case for the rotation in the magnetic field observed by Cluster at
0140 UT during the oscillationBxperiod, for which there
is no evidence in the PEACE data that there is a net differential electron current present.
[39] The interpretation of the earthward current measured
by TC1 as part of the current loop passing by C2 could be questioned and has been in the text above. It could well be argued that because of the half an hour local time difference between TC1 and C2, the spacecraft is not observing that loop but rather the ‘‘return current’’ of a small substorm current wedge. However, as also noted in the introduction, the event in this paper is peripheral to the large processes going on in the duskward side of the magnetotail, and therefore, it does not seem likely that a mini substorm current wedge will be created.
[40] The interpretation of the strong parallel plasma flow
[image:11.612.105.510.72.218.2]at Double Star TC1, during0144 – 0147 UT, as produced by the motion of the dipolarization front observed by Cluster definitely calls for a large scale process in the magnetotail. Naturally, it could be that TC1 is located near the PSBL, where strong plasma flows are often generated [see, e.g.,Baumjohann et al., 1988]. However, the statistical width of a flow channel and the direction of propagation of the dipolarization front show that Double Star TC1 is in the influence region of the fast flow that is measured by Cluster. Table 2. A Chronological Summary of Observations at Cluster and Double Star TC1
Time Double Star TC1 Cluster
0135 UT - Start magnetic field oscillations
- Start perpendicular tailward flow
0140 UT Start parallel tailward flow Thinning current sheet and earthward flow Start enhanced cross-tail current Start of enhanced cross-tail current 0144 UT Earthward turning parallel plasma flow Earthward plasma flow turning perpendicular
End enhanced cross-tail current End thin current sheet
- End enhanced cross-tail current
- Start of dipolarization at C1 and C2. . .
- with significantBycomponent
0145 UT Strong increase inBy Tailward turning of perpendicular flow at C1 Start strong parallel tailward flow PositiveDBx,DBzC3/4
0146 UT - Start decrease dipolarization C1/2
- Decrease in signatures C3/4
0147 UT End fast tailward flow End fast tailward flow
This combined with the almost perfect correlation between the earthward-tailward perpendicular flow at C1 and the flow at TC1 makes a good case that this parallel flow can only be understood in the full view of the processes down in the the magnetotail.
5. Conclusions
[41] During a substorm on 5 September 2005 we have
studied a dipolarization front moving inward and outward over the Cluster spacecraft. The spacecraft were located near the boundary of the active region. Simultaneously, there were measurements by Double Star TC1. The auroral images show that the main activity is located on the duskside of midnight almost extending to the foot point of Double Star TC1, whereas near the foot point of Cluster there are only smaller brightenings of the aurora.
[42] The dipolarization at C1/2, with oppositely directed By signatures for both spacecraft, is associated with two
current loops in both hemispheres of the magnetotail. The earthward side of these loops move over C3/4, before the motion reverses again.
[43] This inward-outward motion of the dipolarization
front has a direct influence on the plasma flow observed by TC1, where we find that this motion most likely works as a piston. The motion of the dipolarization front is reflected in the ground magnetometer observations, where the westward electrojet moves northward during the tailward motion of the dipolarization front after 0145 UT.
[44] Acknowledgments. Part of the work was done for the ISSI working group ‘‘Comparative Cluster-Double Star measurements in the magnetotail.’’ We would like to acknowledge the Cluster Science Data System (CSDS). We would like to thank Harald Frey for making the auroral images from IMAGE/WIC available. We would like to thank the Danish Meteorological Institute and Jurgen Watermann for making the Greenland magnetometer chain data available. The work by MV was financially supported by the German Bundesministerium fu¨r Bildung und Forschung and the Zentrum fu¨r Luft- und Raumfahrt under contract 50 OC 0104. ML and AG are supported by STFC grant PP/E000983.
[45] Michael Hesse thanks the reviewers for their assistance in evalu-ating this paper.
References
Aikio, A. T., et al. (2004), Temporal evolution of two auroral arcs as measured by the cluster satellite and coordinated ground-based instru-ments,Ann. Geophys.,22, 4086 – 4101.
Alexeev, I. V., et al. (2005), Cluster observations of currents i the plasma sheet during reconnection,Geophys. Res. Lett.,32, L03101, doi:10.1029/ 2004GL021420.
Angelopoulos, V., et al. (1994), Statistical characteristics of bursty bulk flow events,J. Geophys. Res.,99, 21,257 – 21,280.
Balogh, A., et al. (2001), The Cluster magnetic field investigation: Overview of inflight perfomance and initial results,Ann. Geophys.,19, 1207 – 1217. Baumjohann, W., G. Paschmann, N. Scopke, C. A. Cattell, and C. Carlson (1988), Average ion moments in the plasma sheet boundary layer,
J. Geophys. Res.,93, 11,507 – 11,520.
Baumjohann, W., G. Paschmann, and H. Lu¨hr (1990), Characteristics of high-speed flows in the plasma sheet,J. Geophys. Res.,95, 3801 – 3809. Baumjohann, W., G. Paschmann, and T. Nagai (1992), Thinning and expansion of the plamsa sheet,J. Geophys. Res.,97, 17,172 – 17,175. Baumjohann, W., et al. (2007), Dynamics of thin current sheets: Cluster
observations,Ann. Geophys.,25, 1365 – 1389.
Carr, C., et al. (2005), The Double Star magnetic field investigation: Instrument design, performance and highlights of the first year’s obser-vations,Ann. Geophys.,23, 2713 – 2732.
Chaston, C. C., et al. (2005), Energy deposition by Alfve´n waves into the dayside auroral oval: Cluster and FAST observations,J. Geophys. Res.,
110, A02211, doi:10.1029/2004JA010483.
Draper, N. C., et al. (2005), Cluster magnetotail observations of a tailward-travelling plasmoid at substorm expansion phase onset and field aligned currents in the plasma sheet boundary layer, Ann. Geo-phys., 23, 3667 – 3683.
Dunlop, M. W., A. Balogh, K.-H. Glassmeier, and P. Robert (2002), Four-point Cluster application of magnetic field analysis tool: The Curlometer,
J. Geophys. Res.,107(A11), 1384, doi:10.1029/2001JA005088. Haerendel, G. (1992), Disruption, ballooning or auroral avalanche - On the
cause of substorms, inProceedings of the International Conference on Substorms (ICS 1), edited by B. Hultqvist, pp. 417 – 420, Eur. Space Agency, Noordwijk, Netherlands.
Johnstone, A. D., et al. (1997), PEACE: A plasma electron and current experiment,Space Sci. Rev.,79, 351 – 398.
Kaufmann, R. L., B. M. Ball, W. R. Paterson, and L. A. Frank (2001), Plasma sheet thickness and electric currents, J. Geophys. Res.,106, 6179 – 6193.
Kaufmann, R. L., W. R. Paterson, and L. A. Frank (2003), Birkeland currents in the plasma sheet, J. Geophys. Res., 108(A7), 1299, doi:10.1029/2002JA009665.
Lui, A. T. Y. (2000), Electric current approach to magnetospheric physics and the distinction between current disruption and magnetic reconnec-tion, inMagnetospheric Current Systems, edited by S.-I. Ohtani, R. Fujii, M. Hesse, and R. L. Lysak, pp. 31 – 40, AGU, Washington, D. C. Lui, A. T. Y., P. H. Yoon, and C.-L. Chang (1993), Quasi-linear analysis of
ion Weibel instability,J. Geophys. Res.,98, 153 – 163.
Mende, S. B., et al. (2000), Far ultraviolet imaging from the IMAGE space-craft. 2. Wideband FUV imaging,Space Sci. Rev.,91, 271 – 285. Morooka, M., et al. (2004), Cluster observations of ULF waves with
pul-sating electron beams above the high latitude duskside auroral region,
Geophys. Res. Lett.,31, L05804, doi:10.1029/2003GL017714. Nakamura, R., W. Baumjohann, M. Brittnacher, V. A. Sergeev, M. Kubyshkina,
T. Mukai, and K. Liou (2001a), Flow bursts and auroral activations: Onset timing and foot point location,J. Geophys. Res.,106, 10,777 – 10,789. Nakamura, R., W. Baumjohann, R. Scho¨del, M. Brittnacher, V. A. Sergeev,
M. Kubyshkina, T. Mukai, and K. Liou (2001b), Earthward flow bursts, auroral streamers, and small expansions,J. Geophys. Res.,106, 10,791 – 10,802.
Nakamura, R., et al. (2004), Spatial scale of high-speed flows in the plasma sheet observed by Cluster,Geophys. Res. Lett.,31, L09804, doi:10.1029/ 2004GL019558.
Parker, E. N. (1996), The alternative paradigm for magnetospheric physics,
J. Geophys. Res.,101, 10,587 – 10,625.
Re`me, H., et al. (2001), First multispacecraft ion measurements in and near the Earth’s magnetosphere with the identical Cluster ion spectrometry (CIS) experiment,Ann. Geophys,19, 1303 – 1354.
Re`me, H., et al. (2005), The HIA instrument on the Tan Ce 1 Double Star near equatorial spacecraft and its first results,Ann. Geophys.,23, 2757 – 2774.
Runov, A., et al. (2003), Current sheet structure near magnetic X-line observed by Cluster, Geophys. Res. Lett.,30(11), 1579, doi:10.1029/ 2002GL016730.
Sanny, J., R. L. McPherron, C. T. Russel, D. N. Baker, T. I. Pulkkinen, and A. Nishida (1994), Growth-phase thinning of the near-Earth current sheet during CDAW 6 substorm,J. Geophys. Res.,99, 5805 – 5816. Scho¨del, R., W. Baumjohann, R. Nakamura, V. Sergeev, and T. Mukai
(2001a), Rapid flux transport in the central plasma sheet, J. Geophys. Res.,106, 301 – 314.
Scho¨del, R., R. Nakamura, W. Baumjohann, and T. Mukai (2001b), Rapid flux transport and plasma sheet reconfiguration,J. Geophys. Res.,106, 8381 – 8390.
Shiokawa, K., W. Baumjohann, and G. Haerendel (1997), Breaking of high-speed flows in the near-Earth tail,Geophys. Res. Lett.,24, 1179 – 1182. Tsyganenko, N. A., and D. P. Stern (1996), Modeling the global magnetic
field of the large-scale Birkeland current systems,J. Geophys. Res.,101, 27,187 – 27,198.
Untiedt, J., and W. Baumjohann (1993), Studies of polar current systems using the IMS Scandinavian magnetometer array, Space Sci. Rev., 63, 245 – 390.
Volwerk, M., P. Louarn, T. Chust, A. Roux, and H. de Feraudy (1996), Solitary kinetic Alfve´n wave: A study of the Poynting flux,J. Geophys. Res.,101, 13,335 – 13,343.
I. Alexeev, A. N. Fazakerley, and A. P. Walsh, Mullard Space Science Laboratory, University College London, Dorking RH5 6NT, UK.
W. Baumjohann, R. Nakamura, M. Volwerk, Z. Vo¨ro¨s, and T. L. Zhang, Space Research Institute, Austrian Academy of Sciences, A-8042 Graz, Austria. ([email protected])
C. M. Carr, Department of Physics, Imperial College London, London SW7 2AZ, UK.
M. W. Dunlop, Space Sciences Division, Rutherford Appleton Laboratory, Didcot OX11 0QX, UK.
A. Grocott and M. Lester, Department of Physics and Astronomy, University of Leicester, Leicester LE1 7RH, UK.
L. Kistler and C. Mouikis, Space Science Center, University of New Hampshire, Durham, NH 03824, USA.
B. Klecker, Max Planck Institute for Extraterrestrial Physics, D-85741 Garching, Germany.
A. T. Y. Lui, Johns Hopkins University Applied Physics Laboratory, 11100 Johns Hopkins Road, Laurel, MD 20723, USA.
H. Re`me, CESR, CNRS, F-31028 Toulouse, France.
A. Runov, IGPP, University of California, Los Angeles, CA 90095, USA. C. Shen and J. K. Shi, Laboratory for Space Weather, Center for Space Science and Applied Research, Chinese Academy of Sciences, Beijing, 100080, China.
T. Takada, Institute of Space and Astronautical Science, Japan Aerospace Exploration Agency, Sagamihara, 229-8510, Japan.
M. G. G. T. Taylor, European Space Research and Technology Center, European Space Agency, NL-2201 AZ Noordwijk, Netherlands.