How to cite this paper: Al-Taai, O.T., Al-Hassani, D.A. and Mehdi, A.M. (2016) Estimating the Soil Erosion by Using Rainfall Data for Selected Stations in Iraq. Open Access Library Journal, 3: e2494. http://dx.doi.org/10.4236/oalib.1102494
Estimating the Soil Erosion by Using Rainfall
Data for Selected Stations in Iraq
Osama T. Al-Taai1, Dheyaa A. Al-Hassani2, Ashwaq M. Mehdi1
1Department of Atmospheric Sciences, Collage of Science, AL-Mustansiriyah University, Baghdad, Iraq 2Department of Physics, Collage of Education, Thi-Qar University, Thi-Qar, Iraq
Received 25 February 2016; accepted 11 March 2016; published 14 March 2016
Copyright © 2016 by authors and OALib.
This work is licensed under the Creative Commons Attribution International License (CC BY).
http://creativecommons.org/licenses/by/4.0/
Abstract
In this study, was estimated the annual water erosion (drifting) of the soil by using total monthly and annually data rains of the eighteen years for the period from 1993 to 2010 for eighteen moni-toring stations in Iraq by using some sophisticated statistics like (Spearman rho, Mann-Kendall and Simple Linear Regression). It was found when analyzing the monthly total rainfall for eighteen years that rainfall varied according to the station height and geographic location as well as by months where North stations recorded the highest loss of the rain while I said the rain toward the south, and was higher loss of rain during the winter months (December, January and February) and there was a lack in the summer months. And it was the highest annual total rainfall for eigh-teen years in the terminal connector (5962.6 mm/year) and the lowest annual total rainfall sta-tion in Karbala (1437.35 mm/year). Kirkuk stasta-tion recorded the highest annual total to erosion among the eighteen observational station (20,453 MJ∙mm/ha∙h) and the lowest annual total to erosion record in Al-Hayy station (426.50 MJ∙mm/ha∙h), as for the annual change to rain and ero-sion was different from year to year for each station where he found when an increase rain in-creasing erosion but not necessarily to the same degree, and vice versa to get decrease rain. The study proved that the highest value of rain possible coincided with the highest value for the ero-sion, but not in all cases, as well as for less the value of the rain where there were other factors which were important and would increase or decrease the erosion where you played a dual role, where he found that the highest and the lowest value rains were respectively in Mosul and Karbala, while the highest and lowest value for f the water erosion of the soil in Kirkuk station and Al-Hayy station respectively. Also we found that there was a strong positive relationship between rain and erosion where the relationship was close and almost complete and ranged from moderate to very high but varied degrees of strength for each correlation coefficient and each station where the Spearman Rho coefficient values between (0.6 - 0.9) any of the average to a very high the value of coefficient Mann-Kendall was (0.4 - 0.7) any of the average too high.
Keywords
OALibJ | DOI:10.4236/oalib.1102494 2 March 2016 | Volume 3 | e2494
Subject Areas: Environmental Sciences, Soil Science
1. Introduction
The soil degradation by water drift the most important element that connects the ribs life triangle together for some (air, water and soil) and is affected by drift precipitation, characteristics and affects the surface soil prop-erties [1]. Raindrops play an important role in raising granulated soils from the surface of the ground and then drop it depending on the size of the rain and the concentration drops and the speed of its fall as the characteris-tics of the surface trace of great importance in determining the amount of soil comminuted affected by this process [2] and different methods of calculation and the study of water drifting from one place to another made many researchers to study and calculate the water erosion of the soil and unanimously agree that the rain ability. The events drifting through the breakup of splashing soil particles gathered addition have studied rainfall cha-racteristics and the crash and some of them have to find a relationship between the gradient and the amount of soil eroded and this shows that the study of water drifting is not born of the moment and it spreads to several years [3].
Soil is very important natural resources in the perpetuation of human life as the natural environment upon which agriculture, which contains essential nutrients for plant growth, but this natural resource is exposed in many regions of the world to the problem of erosion, which is dangerous because of the resulting severe damage to the environmental problems are the loss in the surface layer or under the surface of the soil and the resulting deterioration of soil fertility and low productivity and thus desertification which will reflect negatively on pro-duction-food [4].
Lead operations drifting aggravate the deterioration of the thickness of the soil to a decline in productivity year after year, so the interest in this issue is a priority. It is worth mentioning that there is a close relationship between rainfall and erosion in terms of increases and decreases and appreciation erosion through the rain data and there are many factors affecting soil erosion related to soil themselves and topography of the region and ve-getation and human activity rate. The water erosion is caused by surface water runoff or collision of rain drops of the soil. And increasing water drift effects whenever the torrential rains, they are not able to absorb from the soil with rainwater to constitute a result and the flash floods [5].
The rain is the main cause of water erosion [6] and has a great role in the erosion process to being a primary source of water erosion [7] depending on stripping and scattering of raindrops on a set of interrelated factors with each rate these factors. The rain capability represented by the raindrops as a rainfall erosion factor and the factor of soil and their responsiveness to force strikes raindrops in terms of disintegration and dispersal, trans-portation and worker surface plays a dual role in being a contributing factor shelf and supporter of the extent of soil resistance to withstand the extent of shelf coefficient and also the vegetation plays the same role, but here is often an assistant in the soil in the steadfastness in front of strikes raindrops [8] and are so many regions of the world to the problem of erosion, which is dangerous because of the resulting severe damage to environmental problems is the loss of the surface layer or under the surface of the soil and the resulting deterioration of soil fer-tility and low productivity and thus desertification [9].
degrada-OALibJ | DOI:10.4236/oalib.1102494 3 March 2016 | Volume 3 | e2494
tion and include a factor or more drift by water and wind [15].
Can be defined as soil erosion is the separation and transfer of soil particles from its operation to dislodge the rain effect, running water and snow, that the transmission of these granules according to this process leads to the removal of soil cover of agricultural areas large, which reduces the productivity of soils as a result to remove both surface layer containing mineral substances and nutrients for plants and contributing to the continued ero-sion processes to lack of soil to the proper thickness for agriculture, see Figure 1.
Soil is very important natural resources in the perpetuation of human life as the natural environment upon which agriculture, which contains the nutrients necessary for plants to grow longer. But this natural resource is exposed in many regions of the world to the problem of erosion, which is dangerous because of the resulting se-vere damage to environmental problems is the loss of the surface layer or under the surface of the soil and the resulting deterioration of soil fertility and low productivity and thus desertification which reflected negatively on production food that is increasing the need for him to achieve food security [11]. The complex process of land degradation include or more workers from drifting by water and wind.
An estimated global assessment in 1990 that 15% of the territory of the world has deteriorated to varying de-grees as a result of human activities and the deterioration of 55.7% of this area because of the drift water and 28% by wind and 12% by salinization due to poor sanitation 4.2% for reasons of natural and attributed the causes of deterioration to over-grazing, which is accountable for 34.5% of the degraded area and deforestation 29.5% and farming methods irrational 28.1% and overexploitation 7% [12]. The various activities (overgrazing and cutting down trees and shrubs and plowing erroneous) lead to soil degradation and make it susceptible high in response to the erosion either wind or water for example, erosion, both affecting the 230 million hectares, an area of the arid and semi-arid regions in the Southeast Asian countries [13].
And wind erosion is more dangerous in the arid and semi effect as lead to reduce the thickness of the produc-tive soil layer for example, agricultural production fell by 7.5% due to the removal of millimeter and one of the thickness of the surface layer of the soil in Western Australia [14].
And is weathering one of the manifestations of desertification only modern definition and approved before the United Nations Convention to combat desertification in 1994 provided land degradation in dry areas and semi- arid and sub-humid resulting from various factors, including climatic variations and human activities, and here shows that the erosion one of the serious problems facing the world today, where it is constantly evolving in most corners of the globe and at rates accelerated as estimated land area of graduate annually from the scope of agriculture as a result of degradation of about 50,000 square kilometers, and the proportion of land prone to re-treat 40% of the dry area is home to more than a billion people as the most affected areas are located in devel-oping countries in Asia, Latin America and Africa [15].
2. The Data and Study Area
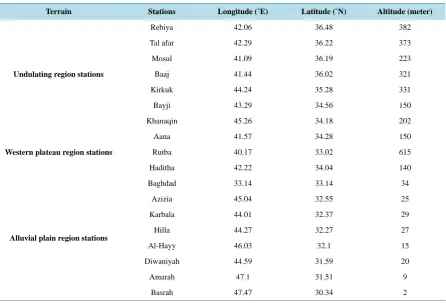
[image:3.595.217.412.596.711.2]The use of total annual rainfall data for eighteen years 1993 to 2010 and eighteen observational station in Iraq (Rebiya, Tal afar, Mosul, Baaj, Kirkuk, Bayji, Aana, Khanaqin, Haditha, Baghdad, Rutba, Azizia, Karbala, Hil-la, Al-Hayy, Diwaniyah, Amarah and Basrah)and obtained by the Iraqi Meteorological Organization and Seis-mology (IMOS) [16] to cover a larger area of northern Iraq to south, see Figure 2. Due to the breadth of the study area and there are many different topography areas which makes them essential in the understanding and knowledge of the factors that lead to water erosion of the soil where the plants were distributed study by the ter-rain and the latitude, longitude and elevation above sea level, and as shown in Table 1.
OALibJ | DOI:10.4236/oalib.1102494 4 March 2016 | Volume 3 | e2494
Figure 2. Distribution of the study stations by altitude above sea surface level in Iraq.
Table 1.Distribution stations by terrain, latitude, longitude and altitude.
Terrain Stations Longitude (˚E) Latitude (˚N) Altitude (meter)
Undulating region stations
Rebiya 42.06 36.48 382
Tal afar 42.29 36.22 373
Mosul 41.09 36.19 223
Baaj 41.44 36.02 321
Kirkuk 44.24 35.28 331
Bayji 43.29 34.56 150
Khanaqin 45.26 34.18 202
Western plateau region stations
Aana 41.57 34.28 150
Rutba 40.17 33.02 615
Haditha 42.22 34.04 140
Alluvial plain region stations
Baghdad 33.14 33.14 34
Azizia 45.04 32.55 25
Karbala 44.01 32.37 29
Hilla 44.27 32.27 27
Al-Hayy 46.03 32.1 15
Diwaniyah 44.59 31.59 20
Amarah 47.1 31.51 9
[image:4.595.91.538.420.723.2]OALibJ | DOI:10.4236/oalib.1102494 5 March 2016 | Volume 3 | e2494
2.1. Undulating Region Stations
The most important thing combines and connects these stations (Rebiya, Tal afar, Mosul, Baaj, Kirkuk, Bayji and Khanaqin). It’s located in the undulating region of Iraq and characterized by the diversity of topography and soils of the different rocks and be soil red structure and be spun rough and contain little organic material [17]. In addition to the presence of alluvial soil, red soil and a bit of clay and sandy soils and characterized it consists of sandy layers are weak and there are other soils unsuitable for agriculture [18]. The Bayji plant, which is located in Salahalddin province is characterized by the same characteristics, climate and nature of the soil either Khana-qin station which is located in Diyala province, which is characterized by a mild climate in summer and cold in winter and fall Diyala procuring Eastern Iraq either Khanaqin area are characterized by climatic conditions semi-dry and high in temperature and rainfall are sudden and vegetation cover is a little soil are often muddy and sandy and other alluvial [19] and is characterized by undulating region also steppe climate falls within the tran-sitional climate between the climate of the mountainous region climate (Mediterranean climate) and the hot desert climate in the south and the annual rainfall ranging between (200 - 400) millimeter. As for natural vegeta-tion prevailing in this region is the steppe plants, which occupies about 15% of the area of Iraq which is located within the undulating region (semi-mountainous) and is divided by the greatest of the grass and the rest part of the thorny plants [20].
2.2. Western Plateau Region Stations
Each of the stations are located (Aana, Haditha and Rutba) in Anbar province, which is part of the western pla-teau and is one of Iraq’s largest province and is characterized by its surface wavy and contains plapla-teaus and hills are steep and lacks the natural vegetation and the rain and the low desert climate as for the type of soil is made up of gestures rocks that date back to different geological eras that is, they are of sandy soil texture coarse stabi-lized because of the vegetation during the ice age and characterized by its proximity to the high proportion of lime [21]. Characterized western desert climate plateau region includes 70% of the area of Iraq and ranging rainfall rates between (50 - 200) millimeters and features a large thermal range between day and night and with regard to the type of plant to be natural desert plants [22].
2.3. Alluvial Plain Region Stations
Include stations (Baghdad, Azizia, Karbala, Hilla, Al-Hayy, Diwaniyah, Amarah and Basrah) the two stations Azizia andAl-Hayy is located in Wasit province, which lies in central Iraq.
OALibJ | DOI:10.4236/oalib.1102494 6 March 2016 | Volume 3 | e2494
3. Mathematical Formulas to Estimate the Annual Water Erosion
There was a big difference between researchers in choosing the rain record that can be applied globally or geo-graphical region, one to be an indication of the erosion of raindrops to be used to develop a model for stripping raindrops index as is the case in the global equation for the loss of soil [2] and used to estimate soil erosion by rain (rain erosion) in this equation be linked to the kinds of storms and quantity and intensity are calculated in terms of rain storms rain characteristics (daily, monthly and yearly) which is calculated guess erosion by minor differences models drifting rain storms indicators. Where the use of the following equations [27]:
d b
P
EI =a′ ′. (1)
where (EId) is Daily erosion index in units (MJ mm/ha.h), (a' and b') is transactions worth vary from one area to
another and thus depend on the station conditions (altitude and geographic location) as the factor (a') factor ex-plains both the temporal and spatial variables factor (b') be close to the consistency can get it in theory and the result is based on an experimental approach, (P) is the amount of rain in millimeter [28] [29].
• As for the monthly index erosion it has been proposed a simplified model to him as in the following equa-tion:
(
)
(
)
2 224 1.36 0.0027 * 0.004
m m
EI = + H + P . (2)
where (EIm) is monthly erosion index in units (MJ∙mm/ha∙h).
(H) is high Surface station and (Pm24) is maximum rainfall during the monthly index erosion.
• The annual drift estimate the transaction in the form of Arnold model has been adjusted to guess the annual erosion, as in the following equation [27]:
(
)
(
12)
1.2716 2
24 1
1.54 8.69 *10 exp
y a i m y
EI = − −P
∑
= P P . (3)where (EIy) is the annual erosion index (MJ∙mm/ha∙H), (Pa24) is maximum rainfall during the day by millimeter,
(Pm2) is square the total monthly rainfall in millimeter, (Py) is the total annual rainfall in millimeter.
Global equation for the loss of soil applied widely in many countries to estimate soil erosion rain, in all these equations rain factor (P), which represents the sum of all drift indicators (EI) of rainstorms that are given periods (daily, monthly and yearly) which is obtained index (EI) of the product of the total energy storms (E) and the highest intensity of rain in 30 minutes as in the following equation [30]:
30 *
EI =E I . (4)
where (EI) is the total amount of erosion (daily, monthly and annual), (E) is energy rainstorms and (I30) is the intensity of the rain falling in 30 minutes (the rain intensity can be calculated by dividing the amount of rain falling on the number of periods of rain).
The account (EI) takes a long time and the addition requires continuous recording of the intensity of the rain, there are many studies assumed a simplified and easy relationships through which to guess the erosion rain, where a number of relationships be related quantities daily rain as in Equation (1) [27]:
• The relationship between the amount of rain storms and rain periods with erosion is:
m
EI =Pβ Dγ . (5)
where (EIm) is erosion represents the monthly index (MJ.mm/ha∙h), (α) is coefficient representing the degree of
the station with rainfall of less high or higher than 1000 meters, (P) is the amount of rain by millimeter, (D) is a period of rainfall, (β) is coefficient value variable dependent on rainfall (0.21 and 0.51 and 2.0), daily, monthly and yearly respectively and (γ) is the value of snowfall. That all of the values (α, β and γ) identifies certified on the basis of height.
• It depends to estimate the annual erosion index in the following equation [31] [32]:
217 6 0.417 *
y
EI = P (6)
• Where (P6) is the amount of rain in six hours in millimeter. It was modified “Equation (6)” to become:
(
)
1.932 1 0.297 n
y i m y
OALibJ | DOI:10.4236/oalib.1102494 7 March 2016 | Volume 3 | e2494
where (n) is true number and (i) is months sequence from (1 to n). Through the “Equation (7)” It was estimated the index of erosion in Iraq.
The subject of the study of water erosion (erosion rain) developed through the use of simple models to guess rainstorms (daily, monthly and yearly) to be through them erosion soil index account where is the rain, the main cause of the occurrence of erosion of all kinds within 24 hours as a period during which he described the daily erosion. So it was considered a total erosion rain every day in the month, a monthly erosion and total monthly erosion over the past annual erosion and drifting index calculating quantities through other storms recorded for rain by record rains device where it was divided into intervals of every 15 minutes and the intensity of rainfall for the period is calculated by energy rains for each period by the following equation [33]:
( )
0.119 0.0873log for 76 mm/h
P
e = + P P≤ . (8)
0.283 for 76 mm/h
P
e = P> . (9)
where (ep) is the total energy in has units of mega joule per hectare per millimeter of rainfall (MJ∙ha−1∙mm−1).
The calculated total energy value of the unity of the rain by the amount of rain for each period through the poss-ible values, the total energy of the rain (ep) every 15 minutes calculated intensity of rain flurried.
4. Statistical Analysis
Use As for statistical methods there are several types of statistical tests used, such as Spearman Rho Test (SRT) of rank, Mann-Kendall Test (MKT) and Simple Linear Regression (SLR).
4.1. Spearman Rho Test (SRT)
The Spearman Rho Test is a measure of non-parametric for an unlimited number of data and is used to show the correlation between any two variables where data is placed in ordinal which is based on testing the null hypo-thesis [34]:
• The lack of correlation between a couple of ranks (rs = 0).
• No correlation between a couple of ranks (rs < > 0).
It is not necessary when using the Spearman test to be a linear distribution of the distribution of data and if the measurement variables both an ordinal scale if we assume that the variable (X) his ranks (RX) and variable (Y)
his ranks (RY) and (Q) symbolizes the difference between the grades This means:
X Y
Q=R −R (10)
Therefore, the Spearman rank correlation coefficient (rs) is given to the following equation:
(
)
(
2 2)
1 6 1
s
r = −
∑
Q n n − . (11)4.2. Mann-Kendall Test (MKT)
Is the coefficient of non-parametric link to an unspecified number of data and is commonly used to assess the link between the data and is symbolized by the Greek symbol (τ) which is similar link Speer Man coefficient data is an ordinal position and be limits link Mann Kendall coefficient of between (+1, −1) If link Mann Kendall coefficient (+1) There is consensus among the ranks rankings if either correlation coefficient (−1) there differ-ence in ranks rankings, one the opposite of the other, and if the correlation coefficient is equal to zero, the inde-pendent rating ranks does not depend one variable to another variable and have a coefficient of correlation Mann Kendall numerous formats like (τken,a∙τken,b and τken,c) [35].
• Link Mann-Kendall Tau coefficient (a) (τken,a):
(
) (
)
, 1 2
ken a c d n n
τ = − − . (12)
• Link Mann-Kendall Tau coefficient (b) (τken,b):
(
)
(
(
)
)
(
(
)
)
, 1 2 1 2 .
ken b c d n n t n n u
τ = − − − − − (13)
OALibJ | DOI:10.4236/oalib.1102494 8 March 2016 | Volume 3 | e2494
(
)
,
2
2 .
ken c c d n
τ = − (14)
where (t) is the number depends on the measured values, (u) is the number depends on the calculated values, (c) is the number of matching pairs and (d) is the number of couples scattered.
4.3. Simple Linear Regression (SLR)
It is an estimate and predict the future value of a variable by knowing the other variable values used in deter-mining the shape of the relationship between two variables mathematically chart of the form of linear regression.
And the regression line and simple means that the dependent variable
( )
Y depends on the independent variable and one which( )
X either the word line it means that the relationship between the two variables(
Y X,)
linear relationship and direction of the slope of the line determines the positive gradient relationship or negative and the slope of the line represents the amount of change in the (Yi) corresponding to a change in the(Xi) is incremented by one unit and given a straight line relationship with the following equation [36]:
Y = +a bX. (15)
(
) (
)
(
)
21 1 .
n n
i i i
i i
b=
∑
= X −X − Y −Y∑
= X −X (16)where
( )
X is the independent variable,( )
Y is the dependent variable, (b) is the slope of the regression and (a) is constant gradient and demonstrate the value of the cut the (Y -axis).5. Results and Discussion
The account of total annual rainfall and estimating the total annual water erosion of the soil for eighteen years for study stations. It was also calculate the temporal variation between precipitation rain and drifting watery soil during the eighteen years from 1993 to 2010 as well as the study of the relationship between the total annual rainfall and the annual total to drift watery soil during the period of study and each study stations using statistics methods (SRT, MKT, SLR) and find the statistics used the correlation coefficient. Also it was identified years it has suffered soil degradation and drought by drawing a chart showing year increase and decrease in the amount of water erosion of the soil, according to the study areas. And finally determine the annual distribution of the falling rain and water erosion of the soil during the eighteen years and each study stations.
5.1. The Total Annual Rainfall and Erosion in Iraq
[image:8.595.124.504.522.710.2]Figure 3 shows the annual total rainfall and the annual total erosion respectively for eighteen years and eighteen stations in Iraq, where he disagreed total erosion and rain from the station to the other depending on to the cir-cumstances of the station from high geographical location and the topography of the surface (soil type and ter-rain).
OALibJ | DOI:10.4236/oalib.1102494 9 March 2016 | Volume 3 | e2494
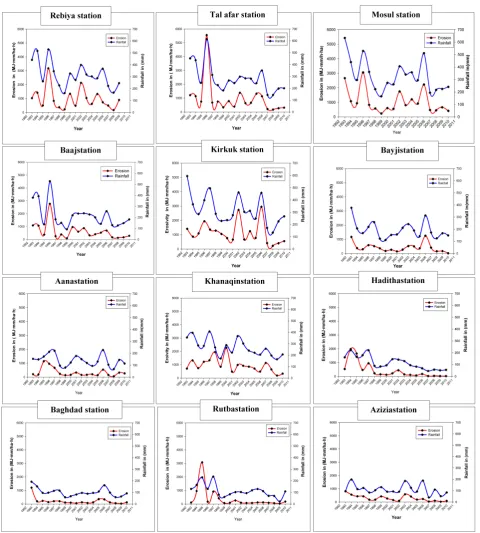
[image:9.595.59.540.184.718.2]5.2. The Annual Change of Rainfall and Erosion
OALibJ | DOI:10.4236/oalib.1102494 10 March 2016 | Volume 3 | e2494
Figure 4. The annual change of rainfall and erosion for years 1993 to 2010 for the study stations.
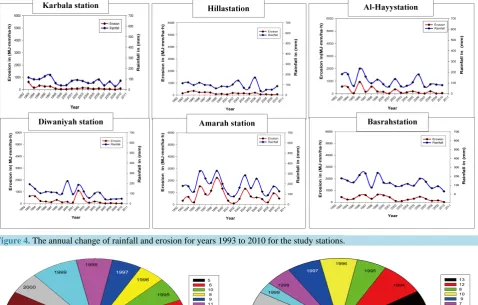
[image:10.595.65.535.351.498.2]
(a) (b)
Figure 5. (a) The years decrease in water erosion of the soil, (b) The years increase in the water erosion of the soil.
5.3. The Relationship between Rainfall and Erosion
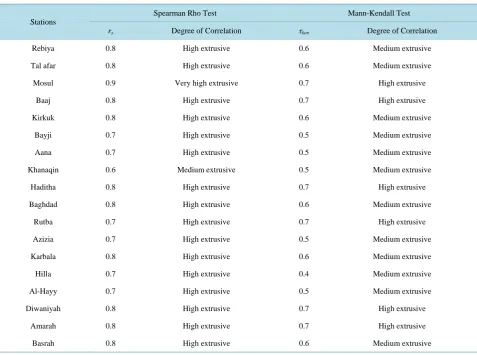
Figure 6 shows the relationship between the rainfall and the water erosion of the soil in Iraq for the years (1993-2010) for the study stations which found that the relationship of rain drifting close relationship that varied in strength from one place to another according to the conditions available in the region the prevailing climate and the nature of where of which relates to the behavior of the rain itself, including the characteristics of the surface and this in turn affects the strength of the degree of the relationship shown in Table 2.
5.4. Distribution of Rainfall and Erosion According to the Study Stations in Iraq
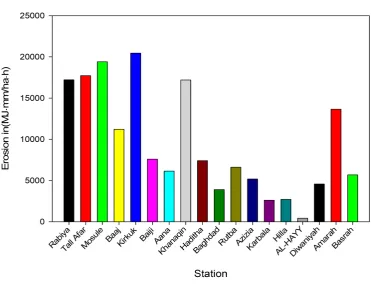
Rainfall vary and erosion watery soil from one station to another depending on the geographical location and height of the station above sea level and illustrates Figure 7 and Figure 8 the distribution of rainfall and erosion for eighteen stations observational respectively during the period from 1993 to 2010, where there were differ-ences clear whether rainfall or erosion.
6. Conclusions
OALibJ | DOI:10.4236/oalib.1102494 11 March 2016 | Volume 3 | e2494
• The rain is the main cause of water erosion and without rain cannot be other factors that are activated to bring water to the soil erosion.
OALibJ | DOI:10.4236/oalib.1102494 12 March 2016 | Volume 3 | e2494
Figure 6. The relationship between rainfall and erosion for years 1993 to 2010 for the study stations.
Table 2.The results Mann-Kendall test and Spearman Rho Test for the type and strength of the relationship between rainfall and water erosion of the soil for study stations of years (1993-2010).
Stations
Spearman Rho Test Mann-Kendall Test
rs Degree of Correlation τken Degree of Correlation
Rebiya 0.8 High extrusive 0.6 Medium extrusive
Tal afar 0.8 High extrusive 0.6 Medium extrusive
Mosul 0.9 Very high extrusive 0.7 High extrusive
Baaj 0.8 High extrusive 0.7 High extrusive
Kirkuk 0.8 High extrusive 0.6 Medium extrusive
Bayji 0.7 High extrusive 0.5 Medium extrusive
Aana 0.7 High extrusive 0.5 Medium extrusive
Khanaqin 0.6 Medium extrusive 0.5 Medium extrusive
Haditha 0.8 High extrusive 0.7 High extrusive
Baghdad 0.8 High extrusive 0.6 Medium extrusive
Rutba 0.7 High extrusive 0.7 High extrusive
Azizia 0.7 High extrusive 0.5 Medium extrusive
Karbala 0.8 High extrusive 0.6 Medium extrusive
Hilla 0.7 High extrusive 0.4 Medium extrusive
Al-Hayy 0.7 High extrusive 0.5 Medium extrusive
Diwaniyah 0.8 High extrusive 0.7 High extrusive
Amarah 0.8 High extrusive 0.7 High extrusive
Basrah 0.8 High extrusive 0.6 Medium extrusive
• The rain and water erosion of the soil are changing together and increase their values in the north and less towards the south, where are the highest annual total rainfall in Mosul and lower annual total in Karbala and the highest annual total to drift in Kirkuk and lower annual total in Al-Hayy station.
• The years when the increase occurs erosion soil suffered from drought and the deterioration of the years in which either decrease occurs drift, the soil does not suffer from degradation.
[image:12.595.60.538.269.624.2]OALibJ | DOI:10.4236/oalib.1102494 13 March 2016 | Volume 3 | e2494
Station
Rabi ya Tall A
far Mos
ule Baaj Kirk
uk BaijiAana
Khanaqi n
Hadi tha BaghdadR
utbaAzizi a
Kar bala Hilla
AL-H AYY Diw
aniyahAmar ah
Bas rah
R
ai
nf
al
lin(
m
m
)
[image:13.595.112.484.86.369.2]0 1000 2000 3000 4000 5000 6000 7000
Figure 7. Annual distribution of rainfall for study stations in Iraq.
Figure 8. Annual distribution of water erosion of the soil for study stations in Iraq.
• The terrain types is important influence on the increase or decreases in water erosion rates.
[image:13.595.113.485.388.673.2]OALibJ | DOI:10.4236/oalib.1102494 14 March 2016 | Volume 3 | e2494
References
[1] Ali, M.A. and Qoukzh, P. (2013) Soil Erosion in the Basin and the East Valley Hasa Sledge. Journal of the Association of Arab Universities for Literature, 10, 709-743.
[2] Ramadan, H.S. (2004) The Origins geomorphology. Jordan.
[3] Andrade, O., kappas, M. and Erasmi, S. (1996) Assessment of Erosion Hazard in Torres Municipality of Lara State. Based on GIS. Inter Cynical, 35, 348-356.
[4] Buringh, P. (1960) Soils and Soil Condition in Iraq. Ministry of Agriculture, Baghdad.
[5] Helmut, K. and Anson, B. (1984) Soil Conservation. Faculty of Agriculture and Forestry, Mosul University, 50-103.
[6] Elaheh, M., Davood, N., Hossein, M. and Ebrahim, P. (2011) Investigating Rainfall Erosivity Indices in Arid and Emiarid Climates of Iran. Journal of Hydrology, 40, 30-48.
[7] Aiche, M. (1996) Contribution Erosion. MSc Thesis, Demaister University Mentor Constantine, 122-321.
[8] Rice, R.J. (1977) Fundamentals of Geomorphology. 1st Edition, Longman Group Limited, New York, 379-387.
[9] Abadi, A.N. (2002) Applications of Remote Sensing in the Study of Phenomena and Geomorphological Changes in Land Use in the City of Dohuk and Future Expansion. Master Thesis, University of Mosul, 136.
[10] Yasser, M. (2004) The Desert and Sand Animation. Morning Newspaper Number 72.
[11] Johnson, D. (1977) The Human Dimensions of Desertification. Economic Geography, 53, 317-321. http://dx.doi.org/10.2307/142968
[12] Nabil, F.N. (2000) Environment and Land Desertification. Water and Environment Research Institute for Agricultural Research Center.
[13] United Nations Environment Program (1994) A Brief Study on Desertification. 37.
[14] Al-Bayati, A. (1996) Wind Erosion and the Loss of the Surface Layer of the Soil Productive. Journal of Agriculture and Development, in the Arab World, Khartoum, 3, 48.
[15] Farres, P.J. (1987) The Dynamics of Rain Splash Erosion and the Role of Soil Aggregate Stability. CATENA, 14, 119-120. http://dx.doi.org/10.1016/S0341-8162(87)80009-7
[16] The Iraqi Meteorological Organization and Seismology (1994) Atlas Climate of Iraq for the Period (1961 to 1990). 7-8.
[17] Hussein, A.A. (2005) Terrain the Study of Applied Geomorphology. Dar Description of the Publication and Distribu-tion, Jordan.
[18] Nahrin, H.A. (2000) The Phenomenon of Desertification in the Province of Kirkuk. The University of Baghdad, Col-lege of Education Department of Geography, Baghdad.
[19] Ezzedine, J.D. and Demanded, P. (2011) Calendar Hittite Wind and Rain the Ability to Study the Size of the Area of Khanaqin. VII Geomorphological Processes.
[20] Hussein, H.A. (2009) Estimate Joey Reasons for the Occurrence of Dust. Department of Atmospheric Predict the Gen-eral Body of the Iraqi Air Rough Waters and Seismic Monitoring, Baghdad, 1.
[21] Walid, M.S. (2013) The Fight against Desertification in Anbar Province between Natural Characteristics and Growth of Cities. A Comparative Study between the Cities of Qaim and Wet Al-Tahtat Urban and Provincial Center, Baghdad University.
[22] Darraji, D. (2006) Physical Circles in Dry Areas in the Face of Desertification. Master Thesis (unpublished), Université El-Hadj Lakhdar Batna, Faculty of Science, Batna, 8.
[23] Skar, S.A. (1985) Geography of Iraq’s Land and Populous Economic Resources. 46-74.
[24] Jassim, M. (1961) The Natural, Economic and Human Geography of Iraq. Second Edition, The Arab League, The Arab Institute of High Studies, 6.
[25] AL-Taie, F.H. (1968) The Soil of Iraq. PhD Thesis, Ghent University, Ghent.
[26] Guest, E.R. (1966) Flora of Iraq. Introduction to the Flora, an Account of the Geology, Soil, Climate and Ecology of Iraq with Gazetteer, Glossary and Biography. Vol. 1, Iraq Ministry of Agriculture, 313.
[27] Rsepaskhah, A. and Sarkhosh, P. (2005) Estimating Storm Erosion Index in Southern Region of I. R. Iran. Iranian Journal of Science and Technology, 29, 357-363.
[28] Bagarello, V. and Asaro, D. (1994) Estimating Single Storm Erosion Index. Transactions of the ASAE, 33, 785-791. http://dx.doi.org/10.13031/2013.28141
[29] Brown, L.C. and Foster, G.R. (1987) Storm Erosivity Using Idealized Intensity Distribution. Transactions of the ASAE,
OALibJ | DOI:10.4236/oalib.1102494 15 March 2016 | Volume 3 | e2494
[30] Bisal, F. (1960) The Effects of Raindrop Size and Impact Velocity on Sand Splash. Canadian Journal of Soil Science,
40, 242-245. http://dx.doi.org/10.4141/cjss60-030
[31] Cooley, K.R. (1980) Erosivity Values for Individual Design Storms. ASCE Journal of the Irrigation and Drainage Di-vision, 106, 135-144.
[32] Hussein, M.H. (1986) Rainfall Erosivity in Iraq. Journal of Soil and Water Conservation, 41, 336-338.
[33] Wischmeier, W.H. and Smith, D.D. (1978) Predicting Rainfall Erosion Losses: A Guide to Conservation Planning. USDA Agricultural Handbook 537.
[34] Bolboaca, S.D. and Jantschi, I. (2006) Pearson versus Spearman, Kendall’s Tau Correlation Analysis on Structure Ac-tivity Relationships of Biologic Active Compounds. Leonardo Journal of Science, 9, 179-200.
[35] Williams, F. (1992) Reasoning with Statistics. How to Read Quantitative Research. 4th Edition, Harcourt Brace Jova-novich College Publishers, Fort Worth.
![Figure 1. Illustrates the separation and transportation of grains of soil by rain [15]](https://thumb-us.123doks.com/thumbv2/123dok_us/7989485.758979/3.595.217.412.596.711/figure-illustrates-separation-transportation-grains-soil-rain.webp)