Bulk plasma properties at geosynchronous orbit
M. H. Denton,1M. F. Thomsen,1H. Korth,2S. Lynch,3J. C. Zhang,4and M. W. Liemohn4 Received 22 October 2004; revised 25 January 2005; accepted 29 March 2005; published 22 July 2005.
[1] We present a comprehensive study of plasma properties at geosynchronous orbit for
electron and ion energies between1 eV and 45 keV, between 1990 and 2001. The variations of temperature and density are analyzed as functions of local time,
magnetospheric convection strength, and the strength of the ring current. Various parameters derived from temperature and density are calculated to elucidate the temporal and spatial location of delivery of plasma sheet material into the inner magnetosphere. We find that the electron and proton densities are greatest in the dawn region for the periods of highest convection and ring current strength. We perform a superposed epoch analysis of 283 geomagnetic storms which occurred between 1991 and 2001 and examine the temporal variation of the plasma at geosynchronous orbit as a function of storm phase. This analysis demonstrates the local time variability of delivery from the plasma sheet into the inner magnetosphere and the concurrent changes in temperature and pressure. We demonstrate that the density of electrons in the plasma sheet is strongly dependent upon the magnetospheric convection strength and, for the first time, upon solar activity. Electron density at geosynchronous orbit is strongly correlated with solar activity. The average plasma sheet electron density at solar maximum can be a factor of two or more higher than that at solar minimum. We also outline a method to estimate the composition of the plasma sheet from MPA measurements and calculate the O+ and H+density variations with solar cycle as a function ofKpand local time. We show that the O+and H+plasma sheet densities increase with increasing solar activity, as does the O+/H+ density ratio. During times of high solar activity and strong convection, the O+and H+ densities may be comparable.
Citation: Denton, M. H., M. F. Thomsen, H. Korth, S. Lynch, J. C. Zhang, and M. W. Liemohn (2005), Bulk plasma properties at geosynchronous orbit,J. Geophys. Res.,110, A07223, doi:10.1029/2004JA010861.
1. Introduction
[2] Geosynchronous orbit, typically located near the inner edge of the plasma sheet, is an ideal location from which to study and monitor the access and delivery of plasma sheet material from the magnetotail into the inner magnetosphere. The plasma sheet is the source of the high-energy plasma injected into the inner magnetosphere during magnetic storms and substorms. Plasma sheet material delivered to the inner magnetosphere by strong magnetospheric convec-tion is a major source of the enhanced ring current present during storm times. Determination of the properties of plasma sheet material, its spatial and temporal access, and its variation with solar cycle, convection, and the strength of the ring current itself, is crucial to an understanding of how
the ring current forms and evolves during storm periods. In addition, bulk plasma parameters are often used as bound-ary conditions in global ring current models [e.g.,Wolf et al., 1982;Chen et al., 1994;Fok et al., 1996;Jordanova et al., 1997], and thus calculation of these properties for a wide range of conditions has the potential to assist in theoretical simulations of the inner magnetospheric region. [3] Borovsky et al.[1998] described how plasma may be transported from the distant tail to geosynchronous orbit. Previous investigations byKorth et al.[1999] have shown that plasma sheet access to geosynchronous orbit is statis-tically well correlated with the Kp index [Bartels et al., 1939], a proxy for the convection electric field strength [see alsoThomsen, 2004]. Moreover,Korth et al.[1999] showed that the density of plasma sheet ions at geosynchronous orbit is maximised during periods of high Kp and that the access of protons and electrons to geosynchronous orbit is crucial to explaining the variation of their bulk density and temperature, since the average plasma sheet access to geosynchronous orbit varies with local time, Kp, particle species, and energy. A theoretical prediction of the access of plasma to geosynchronous orbit was further investigated by
Korth and Thomsen[2001].
[4] Friedel et al. [2001] used Polar-HYDRA data to confirm that the spatial distribution of plasma sheet elec-1
Space Sciences and Applications, Los Alamos National Laboratory, Los Alamos, New Mexico, USA.
2
Space Physics Group, Johns Hopkins University Applied Physics Laboratory, Laurel, Maryland, USA.
3
Marine Physics Laboratory, Scripps Institution of Oceanography, University of California, San Diego, La Jolla, California, USA.
4
Atmospheric, Oceanic, and Space Sciences Department, University of Michigan, Ann Arbor, Michigan, USA.
trons is statistically very well organized with respect to theoretical Alfve´n boundaries, but plasma sheet protons are less well organized. This difference was explained in terms of the ion orbits being more complicated due to theEB
convection and the gradient/curvature drifts acting in op-posing directions. Thus protons spend a relatively longer time along their drift paths, and losses outweigh the injection of fresh plasma. McComas et al. [2002] have shown that the emission of energetic neutral atoms (ENAs) in the energy range 1 – 70 keV can allow the imaging of regions of high and low plasma sheet density.
[5] With regard to the local time region of the injection,
Birn et al. [1997] showed that the electron and proton substorm injection regions are not colocated. The electron injections tend to occur between 1 and 2 hours following local midnight, while proton injections typically occur in the hour before local midnight. This offset was confirmed by simultaneous, multisatellite observations [Thomsen et al., 2001]. Thus there are clear differences both in the proton and electron access to the inner magnetosphere and in their behavior once injected.
[6] Korth et al. [1999] showed that the plasma sheet density and access increase withKp. Times of elevatedKp
are often storm periods. Thus one might expect that storm periods would also be periods of enhanced plasma sheet density. Indeed, for a limited set of storms, it has been shown that theDstindex [Sugiura, 1964], a measure of the storm time ring current, is correlated with the plasma sheet density [Thomsen et al., 1998]. Since the plasma sheet is the source of the ring current (delivered to the inner magneto-sphere via geosynchronous orbit), it is clearly important to understand the properties of the plasma at geosynchronous orbit with respect to the ring current strength. In addition, theKpandDstindices respond differently to different solar wind parameters. Kp is more sensitive to changes in solar wind speed, while Dstis more sensitive to changes in the interplanetary magnetic field (IMF) [e.g.,Feynman, 1980]. In addition, Kp andDstalso behave differently within the solar cycle. Kp is relatively more sensitive to recurrent activity such as corotating interactive streams (CIRs), whereasDst is more sensitive to transient activity such as coronal mass ejections (CMEs) [e.g., Vennerstrøm and Friis-Christensen, 1996].
[7] In this study we perform a statistical analysis to determine the bulk properties of the plasma sheet as a function of the Dst index. The delivery and density of plasma sheet material is known to be enhanced during periods of strong magnetospheric convection. We investi-gate this enhancement during the storm times which often accompany periods of enhanced convection. By performing a superposed epoch analysis, we analyze how the bulk plasma parameters vary spatially and temporally throughout the evolution of a storm.
[8] The solar cycle dependence of various processes within the magnetosphere has previously been well docu-mented. Ionospheric densities, auroral phenomena, and the occurrence of geomagnetic storms are all solar cycle de-pendent. Thus it appears likely that the delivery of plasma sheet material to the inner magnetosphere will also follow the solar cycle to some degree, simply because the frequency of storms and the convection electric field are also solar cycle dependent. We demonstrate for the first time that electron
density in the plasma sheet is a function of solar cycle. It is also known that some fraction of the plasma sheet is of ionospheric origin. Since the densities of various ions within the ionosphere are known to fluctuate with the solar cycle [e.g.,Heelis et al., 1990;West et al., 1997;Denton and Bailey, 2001], we calculate an inferred O+density at geosynchronous orbit and determine the inferred density variation with the strength of the magnetospheric convection and solar cycle.
[9] To summarize, the main objectives of this study are to ascertain the dependence of the bulk properties of the plasma at geosynchronous orbit with respect to the Dst
index, local time, storm phase, and solar cycle. A database of magnetospheric plasma analyzer (MPA) measurements from five Los Alamos geosynchronous satellites, covering a full solar cycle, provides the data used in this study. The results both improve our understanding of plasma sheet entry during disturbed conditions and provide an additional constraint on the boundary conditions of ring current models. The plasma sheet electron density is shown to depend greatly upon solar activity and this dependence is quantified between 1990 and 2001. The fraction of O+ present at geosynchronous orbit is estimated and shown to be highly dependent upon solar activity and the magneto-spheric convection strength.
2. Instrumentation
[10] Data for this study are provided by the MPA instru-ments flown by Los Alamos National Laboratory (LANL) on several satellites in geosynchronous orbit. The full data-set extends from 1989 to the present, covering more than an entire 11 year solar cycle. The MPA instrument is an electrostatic analyzer which measures the three-dimensional energy-per-charge distributions of ions and electrons between 1 eV/q and 45 keV/q at a time cadence of one 10-s snapshot every 86 s. For this study we use the spin-averaged moments computed from the full distributions [Thomsen et al., 1999], including densities, temperatures, and temperature anisotropies. Although there are no magnetometers on board the LANL satellites, the magnetic field direction can be derived from the symmetry axis of the three-dimensional particle distributions, allowing identification of the compo-nents of the temperature parallel and perpendicular to the field [Thomsen et al., 1999].
[11] In the current study moments of the particle distri-bution are analyzed for the hot electrons (HE) in the energy range 30 eV to45 keV, the hot protons (HP) in the energy range 100 eV to45 keV and low-energy protons (LP) in the energy range 1 to 100 eV. The ion moments are calculated under the assumption that the entire ion popula-tion consists of protons; however, we will also discuss how, under certain conditions, the ion composition may be inferred from MPA observations. A full description of the MPA instrument has been provided by Bame et al.[1993] andMcComas et al.[1993].
3. Data Coverage and Processing
and 2001, satellites being launched in the periods between these years, so there are relatively more data in the later years. The data are processed using a method similar to that applied byKorth et al.[1999]. Magnetospheric and bound-ary layer events are culled from the analysis by only accepting data points where the proton density is less than 3 cm3and the perpendicular proton temperature is greater than 2000 eV.
[13] The aim of the analysis is to determine the variation of the plasma parameters with respect to the Dst index [Sugiura, 1964], a proxy for the strength of the global ring current. However, to compare with the work initially presented byKorth et al.[1999], the data were first binned into one of 24 hour-width local time bins and one of 27Kp
bins. This extension of theKorth et al.[1999] results has the benefit of improving the statistics of the original analysis, particularly for periods of the highest Kp values (and strongest convection). For the Dstanalysis, the data were binned into 24 local time bins and 51Dstbins from400 to +100 nT. The output plots are produced on a grid of Dst
(from 200 to +40 nT, the range where data coverage is
generally good) and local time. Data from a given bin were only included in the final plot if there were more that five data points in the bin.
[14] Calculation of the ion and electron moments pro-vides their respective temperatures in the parallel and perpendicular directions, with respect to the derived mag-netic field direction. The derivation of the field direction is only possible when the distribution is sufficiently aniso-tropic [Thomsen et al., 1999], but knowledge of the field direction is unnecessary when the distribution is too isotro-pic for its determination since in that case the perpendicular and parallel temperatures are approximately equal anyway. In the analysis, the temperature is calculated as two-thirds times of the perpendicular temperature plus one-third of the parallel temperature, for each data point. The electron and proton pressures are defined as the product of the respective temperatures and densities. We also derive a parameter for the hot protons, the inverse entropy, which is calculated as
NHP5=3=PHP; ð1Þ
where NHP is the hot proton density and PHP is the hot proton pressure. This parameter is intended to highlight regions of cold, dense plasma sheet material, the subject of investigation for a number of authors [e.g.,Lennartsson and Shelley, 1986;Terasawa et al., 1997;Fujimoto et al., 1998;
Phan et al., 2000; Huang et al., 2002; Thomsen et al., 2003]. Cold dense plasma has been observed in the midtail plasma sheet typically during periods of northward IMF.
Thomsen et al.[2003] observed that this population may be delivered into the inner magnetosphere under conditions of either sudden southward IMF following an extended period of northward IMF or during a very strong magnetospheric compression, caused by a large increase in solar wind dynamic pressure.
[15] To further extend the analysis of the plasma behavior at geosynchronous orbit during disturbed conditions we examine the bulk plasma parameters from 283 storm peri-ods identified between 1990 and 2001 by means of a superposed epoch study. Taking the zero epoch for each storm as the period when theDstindex was at a minimum, we bin all data with respect to the epoch time and with respect to local time. The resulting statistics provide clues as to when during the storm process the major injection of plasma occurs and the temperature of the injected plasma and its anisotropy.
4. Results and Discussion
4.1. KpDependence
[16] This analysis creates averages of various bulk plasma parameters, between 1990 and 2001, as a function ofKpand local time. Bins with fewer than five data points are colored gray. Bins where the value of the plotted parameter falls above the maximum index on the scale are colored white. All plots, with the exception of the sample statistics plot, are smoothed using a boxcar average, the aim being to highlight the broad features of each parameter but without removing small-scale features. Approximately 4.5106 data points are used in the analysis.
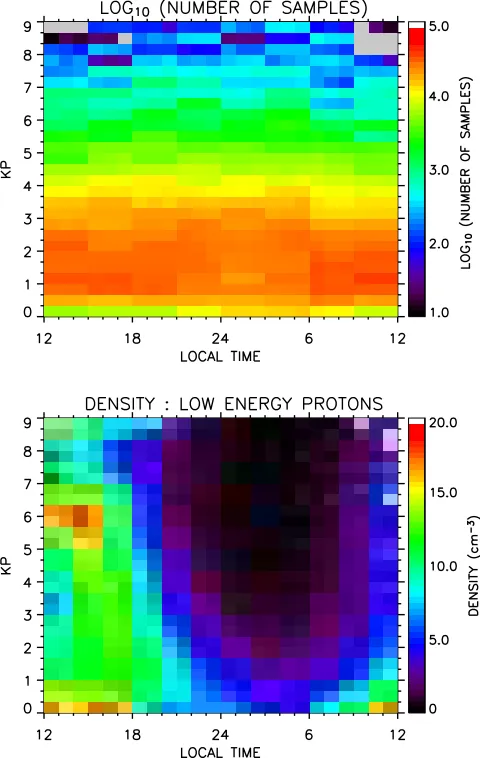
[image:3.592.51.291.71.450.2][17] Figure 1 shows the sample statistics and the low-energy proton density averaged between 1990 and 2001 as a
function ofKp and local time. As may be expected, there are many more samples for values ofKp< 4 than forKp> 4, reflecting the relatively greater occurrence of periods of low magnetospheric convection. The LP density plot shows a population that is distributed primarily on the dayside, in the afternoon sector, and that is eroded asKpincreases. The LP particles are of ionospheric origin and results from upflow into closed flux tubes that approximately corotate with the Earth. Plasma in these tubes is lost during periods of increased convection when particles on previously closed drift paths may transition to open drift paths that drain to the magnetopause. That a significant population of cold protons is observed indicates the presence of ionospheric plasma at geosynchronous orbit in the afternoon, for low values ofKp. The average density of this cold population is at a maximum in the postnoon sector and is significantly depleted at later local times for stronger convection, when drainage to the magnetosphere is enhanced. The LP population varies almost inversely to the HP and HE plasma sheet populations shown in Figure 2.
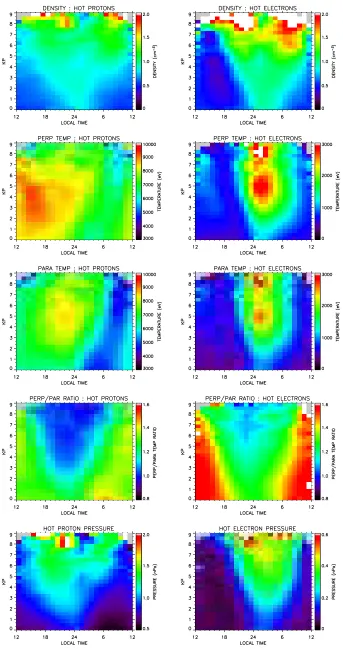
[18] Figure 2 shows the HP and HE densities, perpendic-ular and parallel temperatures, temperature anisotropies, and pressures, as a function ofKp and local time. The HP and HE densities from Figure 2 may be compared directly with the proton and electron densities of Korth et al. [1999, Plate 4], where data from three satellites during 1996 were analyzed. Similar features are readily identified in both analyses, particularly a peak in the HP and HE density slightly postmidnight and a decrease from this peak toward dawn and dusk. At Kp values >4, and particularly >6 (where there is a lack of data in the Korth et al. [1999] analysis), there appears to be some evidence of a minimum in the HP and HE densities around local midnight, with a suggestion of two separate populations, one located premidnight and one postmidnight. This is possibly due to the severity of such high Kp storms and the dominance of plasma energized above the MPA maximum detection energy of 45 keV and therefore not unresolved. Both the HP and HE densities are slightly higher close to dawn for the higher values of Kp. For low values of Kp, the peak in HP density is located very close to local midnight and the HE density peak is slightly postmidnight. This agrees withThomsen et al.[1998] obser-vations and results presented byKorth et al.[1999].
[19] The HP and HE perpendicular and parallel temper-atures and the perpendicular-to-parallel temperature ratios shown in Figure 2 demonstrate that temperature is also highly correlated withKpand local time. As stated byKorth et al.[1999], the temperature profiles reflect the accessibil-ity of high-energy particles. It is clear that the HP temper-ature has its peak between 1200 and 2400 LT. The parallel temperature peak is found in the premidnight sector, while the perpendicular temperature peak is found in the afternoon sector. The causes for this are unclear. As the protons drift to the dayside, the magnetic field strength increases, causing adiabatic heating in the perpendicular direction. The fall in the parallel temperature toward dawn is likely caused by the higher-energy fraction of the distribution being lost due to precipitation of the field-aligned component. The resulting HP temperature anisotropy, which develops on the dayside with increasedKp, occurs due to an increase inT?(likely due to the increased magnetic field) combined with a
decrease in Tk (likely due to an increased loss of field-aligned particles through precipitation). In the region close to midnight, fresh plasma sheet material, with an isotropic temperature distribution, is observed. The location of this isotropic population is observed to widen in local time with increasing values of Kp. In general, the perpendicular-to-parallel temperature ratio shows how the population becomes more anisotropic as it ‘‘ages,’’ related to the time it spends within the inner magnetosphere. Fresh material typically has an isotropic distribution. However, since field-aligned particles are lost via precipitation, a stronger anisotropy develops as time passes. Loss of the proton population can also proceed by charge-exchange which is particularly important for H+ ions with energies below 40 keV.
[20] For the hot electrons, the peak temperature in both perpendicular and parallel components is observed just after local midnight. Typically, there is reduced HE access to geosynchronous orbit premidnight [Korth et al., 1999]. For higher Kp values, the peak temperature postmidnight is likely due to heating accompanying the substorm injection of plasma sheet electrons.
[21] The HE perpendicular-to-parallel temperature ratio demonstrates that the electrons are already largely aniso-tropic at their arrival at geosynchronous orbit. Loss pro-cesses have already produced a perpendicular anisotropy, likely indicating that field-aligned particles have been preferentially precipitated out of the distribution as they mirror closer to the Earth. As convection strength increases, there is typically less time for precipitation to occur and the distribution is more isotropic, particularly for the electrons arriving to local midnight during the highest convection periods.
[22] The HP pressure shown in Figure 2 is similar to that presented byKorth et al. [1999]. The HP temperature and density have significant nighttime gradients; however, their variations largely cancel each other leaving a fairly uniform HP pressure on the nightside. The HE pressure highlights the region of plasma sheet electron access. The newly delivered electrons are both hot and more dense than the residual population within the closed drift path region.
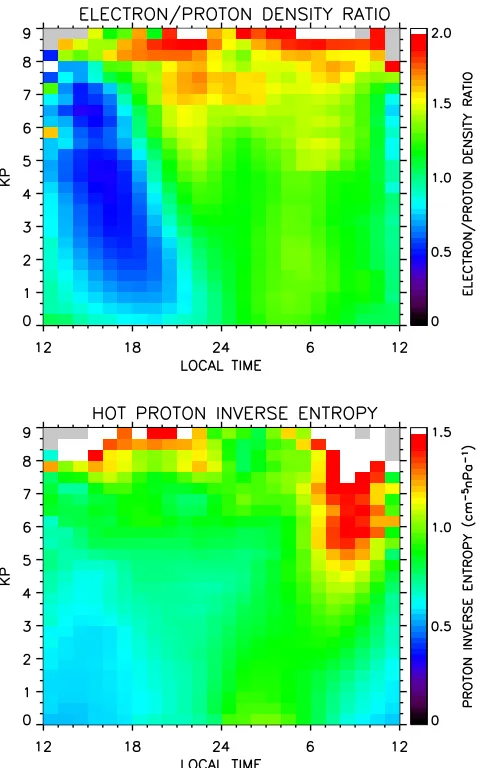
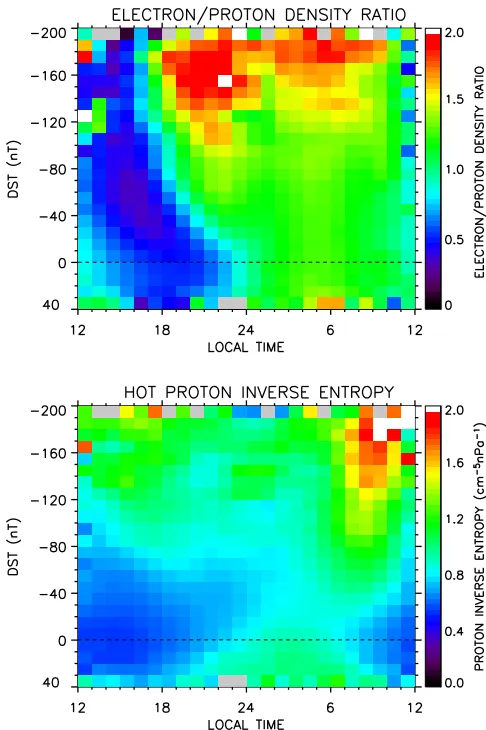
[23] Figure 3 shows the HE/HP density ratio and the HP inverse entropy. This HE/HP density ratio is the ratio of electrons to protons in their respective energy ranges. Quasi-neutrality is still assumed even when the ratio is not1. The HP density ratio highlights the geosynchronous access boundaries of the electrons compared with the protons. Electrons do not have access to the dusk region (modulated withKp) and this causes a minimum in the HE/ HP ratio in this region. For periods of high convection there is an increase in the ratio. This can be explained by the injection of fresh plasma from the plasma sheet, centered close to midnight, which spreads in local time with increas-ingKp.
4.2. DstDependence
[25] Figures 4, 5, and 6 show the same dataset as plotted in Figures 1, 2, and 3 but now ordered as a function of the
Dstindex (i.e., ordered with the respect to the strength of the ring current rather than the strength of the convection) and local time. The aim of this analysis is to elucidate any effects particular to the ring current enhancement measured by Dst rather than the convection dependent ordering indexed byKp.
[26] Figure 4 shows the sample statistics and the low-energy proton density averaged between 1990 and 2001 as a function of Dstand local time. The sample statistics show the data in this analysis are clustered around periods of quiet to moderate storm activity (aDstindex of0 to40 nT). It is also clear that the low-energy protons are well ordered withDst. The LP density displays a distribution close to the inverse of the HE distribution (shown in Figure 5) and the same explanation of its distribution is valid, namely that regions of high LP density correspond to plasmaspheric plasma of ionospheric origin which has accumulated due to time spent on closed drift paths. The regions of low LP
density correspond to regions where this plasma may drift to the magnetopause under enhanced convection conditions. The low LP densities centered slightly postmidnight indi-cate regions where fresh, hot plasma sheet electrons are injected during storms. This region broadens with increas-ing storm strength.
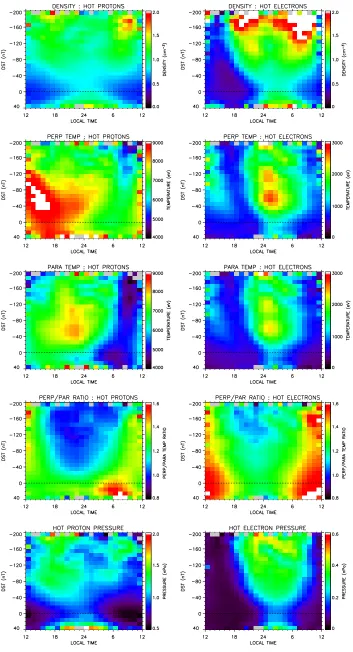
[image:6.592.52.291.68.452.2][27] Figure 5 shows the HP and HE densities, perpendic-ular and parallel temperatures, temperature anisotropies and pressures as a function ofKp and local time. A noticeable difference between the densities shown here and those shown in Figure 2 is the presence of a density enhancement during periods of positive Dst, corresponding to times of magnetospheric compressions following sudden impulses. These increases in density are an indication of the injection of plasma sheet material that leads to an increased ring current and the subsequent drop in Dst. This signature of enhanced plasma delivery is centered close to midnight for the HP plasma and postmidnight for the HE plasma. For periods of negative Dst, the temperature, density, and pressure distributions display features very similar to those found in the Kp analysis. The dense high-energy proton population observed around dawn for high values ofDstis also quite cool and, as previously suggested byThomsen et
[image:6.592.303.543.350.709.2]Figure 3. The averaged HE/HP density ratio and the HP inverse entropy calculated as a function of Kp index and local time for MPA data between 1990 and 2001, inclusive.
al.[2003], this may correspond to a cold dense plasma sheet population.
[28] The HP and HE parallel and perpendicular temper-atures and their perpendicular-to-parallel temperature ratios shown in Figure 5 contain several features similar to those evident in the Kpanalysis. In broad terms, the HP temper-ature and the degree of tempertemper-ature anisotropy show peaks at around 1400 and 2100 LT for the perpendicular and parallel distributions, respectively. The HP distribution is at its most isotropic centered close to midnight and in a local time region which increases in width with increasingly negative Dst values. The peaks in the HE temperatures show maxima close to midnight, for values around60 nT, in both the perpendicular and parallel components. The HE distribution is also at its most isotropic in broadly the same region. This implies that freshly delivered plasma, more isotropic in distribution, is colocated with the region of greatest heating.
[29] The HE and HP pressures shown in Figure 5 dem-onstrate a correlation with Dstand local time. Clearly, the ions, assumed to be protons, make the greatest contribution to the total pressure. The HP pressure shows an increase at the start of the storm (positive Dst) and, compared with
times of zero Dst, this pressure increases with increasing
Dst and can spread across the entire nightside. During periods where Dst <40 nT the pressure is increased at all local times, compared with periods of low ring current activity, with a peak in the HP pressure close to dusk. Since the pressure is calculated from the product of the density and temperature, the pressure distribution reflects both quantities. As noted by Korth et al. [1999], regions of high-pressure gradients reflect regions where currents are flowing. The proton density and temperature have signifi-cant gradients; however, the two quantities combine to produces a pressure distribution that is peaked in the dawn and dusk sectors, largely as a result of the peaks in the HP density in these regions.
[30] The HE pressure shows a quiet-time peak located close to local midnight. This pressure peak broadens sub-stantially with increasingly positive or negative Dst. The region of increased HE pressure spreads during increasingly positive Dst and widens in local time. For increasingly negativeDst, the pressure is enhanced in magnitude and its location spreads in local time, but this enhancement does not extend beyond around 1800 LT, even for very strong storms. Fresh electron plasma sheet access to geosynchro-nous orbit is very much restricted in the afternoon sector, as shown byKorth et al.[1999], thus resulting in little increase in pressure in this region, even for the strongest storms.
[31] Figure 6 shows the HE/HP density ratio and the HP inverse entropy as functions of Dst and local time. Clearly, the HE/HP density ratio is lowest in the postnoon region due to the lack of HE access in the postnoon region. For increasingly negative Dst there is an increase in the ratio that is maximised prior to midnight for Dst
values <100 nT.
[32] The HP inverse entropy highlights regions where a denser, colder plasma sheet population exists. Figure 6 shows the delivery of cold dense plasma sheet material is maximized in the postdawn region during the times when the ring current is highly strengthened (Dst< 100). Why cold dense plasma sheet material should preferentially enter on the dawnside is currently being investigated. The HP density is elevated at both dawn and dusk times during enhanced activity. However, the HP temperature on the duskside is consistently higher than that at dawn; thus the inverse entropy parameter is greatest in the dawn region.
4.3. Storm Superposed Epoch Analysis
[33] To further understand the time evolution and struc-ture of the plasma at geosynchronous orbit during disturbed conditions, particularly during enhanced ring current activ-ity, we carry out a superposed epoch analysis of 283 storms that occurred between 1991 and 2001. These storms were selected as periods when clear negative excursions in the
Dst index were observed. To be classed as a storm, the interval had to have a minimum Dst of 50 nT or less. Upon inspection, the interval was required to have an initial phase lasting minutes to hours, a main phase lasting 30 min to several hours, and a recovery phase lasting tens of hours to a week. The zero epoch for the study was taken as the minimum value ofDstfor each storm, following a sudden fall from a prestorm value.
[image:8.592.48.291.67.432.2][34] Once the zero epoch has been selected, data are binned into one of 24 local time bins and one of 96 bins
covering the 24 hours before the zero epoch and the 72 hours after. Data are shown from 1 day before to 2 1/2 days after the zero epoch. No smoothing is performed on the plots pro-duced. The results are summarized below, and their implica-tions are discussed more fully in section 5.
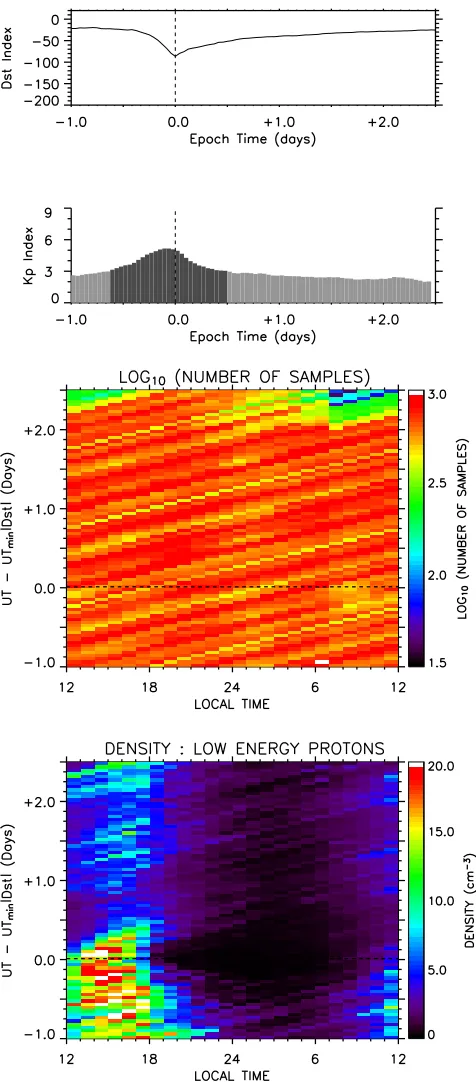
[35] Figure 7 shows the superposedDstandKp indices, the sample statistics, and the low-energy proton density for
the 283 storms selected. It is clear from the superposed indices that the average convection strength for this collec-tion of storms, measured byKp, peaks prior to the minimum
Dst. It should also be noted that even 1 full day before the zero epoch, the averaged conditions were not totally ‘‘quiet.’’ The averaged Kp was 2+ and the averaged
Dst was 20.
[36] The LP density is initially quite low on the nightside and in the morning sector and appears depleted further during the storm. In the afternoon sector the density is initially high and may be enhanced slightly around zero-epoch. These low-energy particles may exist on closed drift paths, and the associated flux tubes fill from the ionosphere as a result of continual day-time production in the iono-sphere. As flux tubes migrate across the dayside, the flux of cold ionospheric plasma increases, giving the highest den-sities in the afternoon. As the storm progresses, the con-vection electric field is enhanced, causing a reduction in the LP population due to enhanced drainage to the magneto-pause. Another possibility is that the peak close to zero epoch in the afternoon sector represents the plasmaspheric drainage plume which, as the storm progresses and convec-tion weakens, thins and disappears from view. The plasma-sphere is known to take many days to refill following a storm [e.g.,Kersley and Klobuchar, 1978], and hence the LP density may not return to its prestorm value, even 48 hours after minimumDst.
[37] Figure 8 shows the HP and HE densities, perpendic-ular and parallel temperatures, the temperature anisotropies, and the pressures as a function of storm-epoch time and local time. The HP density is clearly enhanced close to local midnight, around 12 hours before the storm minimum and this density enhancement appears to spread across the entire nightside and even onto the dayside as the storm progresses. The results indicate that the plasma sheet density is at its highest during the main phase of the storm. The density at geosynchronous orbit falls back to or even below a prestorm level between 24 and 36 hours after zero epoch.
[38] The HE density in Figure 8 also shows a strong increase for periods before minimumDst, corresponding to the main phase of the storm. The strongest enhancement in HE density occurs around and just prior to dawn. No enhancement is registered for local times between 1200 and 1800 LT. This is because plasma sheet electrons in this energy range do not have access to this region of geosyn-chronous orbit. Enhanced HE densities are registered more than 24 hours after the minimum Dst, but it is less clear, compared with the HP analysis, when the density returns to a prestorm minimum. Assuming a prestorm density in the region close to midnight (see Figure 2) of 1.0 cm3, we suggest the HE density returns to a prestorm value at least 24 hours after minimumDst.
[image:9.592.51.289.66.607.2][39] Figure 8 also shows the superposed epoch study for the HP and HE parallel and perpendicular temperatures and their degree of anisotropy. The HP perpendicular tempera-ture peaks at over 10,000 eV, just after midday, although apart from this enhancement, the HP temperature appears to vary little with storm phase. The parallel HP temperature peaks at around 8000 eV between dusk and local midnight and appears to fall slightly following minimumDst. The HP temperature ratio is clearly closest to isotropy around zero epoch near to local midnight. At zero epoch the isotropic
plasma extends across almost the entire nightside, high-lighting the region of fresh plasma delivery.
[40] Compared with the temperatures at one day before zero epoch, the HE parallel and perpendicular temperatures show an enhancement during the storm with peak temper-atures both close to 3000 eV in the postmidnight sector. The HE population also appears to be at its most isotropic close to the zero epoch when the isotropy extends to the broadest region of local time, again indicating the delivery of fresher plasma sheet material.
[41] Since both the HP and HE temperatures in Figure 8 show only a limited variation with storm phase, the HE and HP storm-epoch pressure variations are largely dominated by the variation in the HP and HE densities. The HP pressure peaks prior to zero epoch, with the peak moving to the dusk region as the storm progresses. The HE peak is located prior to dawn and prior to zero epoch, when a significant pressure enhancement is observed between 2400 and 0600 LT. Little change is evident in the afternoon HE pressure since the electrons are restricted from entering this region. The postmidnight peak in HE pressure is maximised prior to minimum Dstand falls off to prestorm levels over the following 12 to 24 hours.
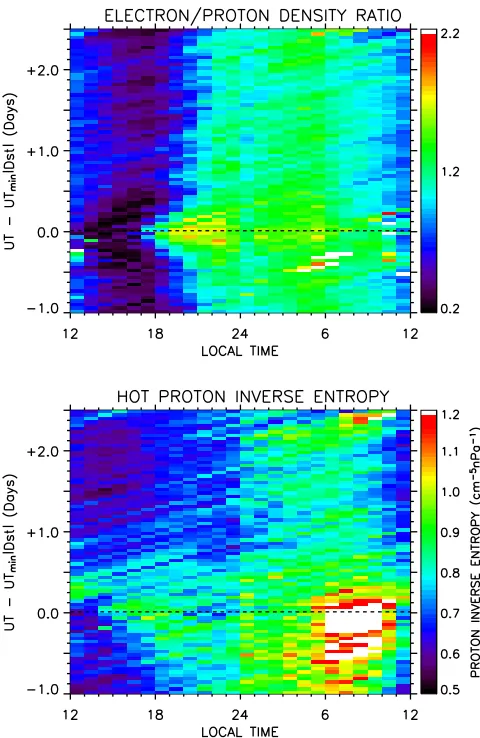
[42] Figure 9 shows the HE/HP density ratio and the HP inverse entropy plotted as a function of storm epoch and local time. The density ratio is enhanced close to dawn around 12 hours prior to zero epoch, largely as a result of the relatively high HE density in this region. The HP inverse entropy is maximised around 0800 LT just prior to zero epoch, again indicating that the dawn region may be occupied by unusually cold, dense plasma sheet material during the main phase of the storm.
4.4. Solar Cycle Dependence
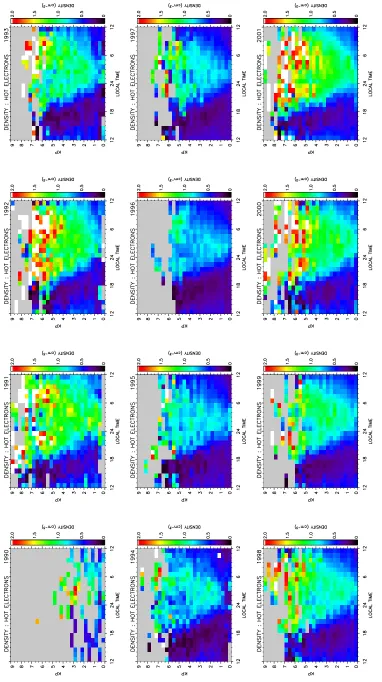
[43] Figure 10 shows the electron density at geosynchro-nous orbit as a function of solar cycle, Kp, and local time. TheKp index was used in preference to the Dstindex for this analysis due to the strong relation between electron access to the magnetosphere and the convection electric field. Data are binned into 24 local time bins and 27 Kp
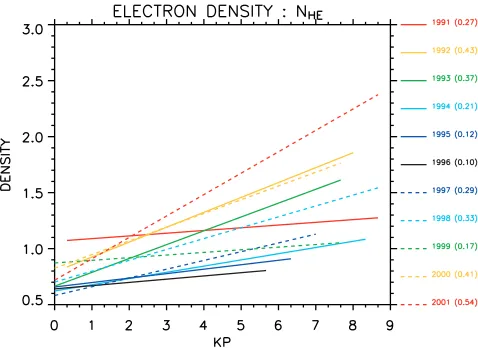
bins. Bins containing less than five points are colored gray. Data with values higher than the maximum range of the color bar are colored white. Figure 10 shows the HE density as a function of local time andKpfor the 12 years between 1990 and 2001, inclusive. It is clear that both solar activity and the convection electric field have a strong bearing on density levels of HE at geosynchronous orbit. During extremely quiet solar activity, for example during 1996, the electron density rarely exceeds 1.0 cm3. In contrast, during periods of high solar activity, for example 2001, the density is typically 1.5 cm3 in all regions where the plasma sheet electrons have access, even during quiet convection periods (Kp < 3). For all years, the HE density rises as a function ofKpand is also enhanced over a wider range of local times. The latter property was clearly revealed in the solar minimum data presented byKorth et al. [1999], but the increase of density withKp was not as obvious during the year studied (1996) as it is for the other, more active years in the solar cycle. The magnitude of the variation in HE density with Kp and the solar cycle is presented explicitly in Figure 11. This figure shows a straight line fit to the HE density between 1991 and 2001, at 0300 LT over a full 11 year solar cycle. (1990 is excluded from the fits due to the limited data availability). Here 0300 LT was used to quantify the HE variation since it is the time at which high values of electron density are seen for all values ofKp(see Figure 2). The standard deviations from each straight line fit are shown in brackets with the plots colored to represent their temporal location in the solar cycle, red for solar maximum, and black for solar minimum.
[image:11.592.50.290.67.436.2][44] The ion composition of the inner magnetosphere is known to change throughout the solar cycle [e.g.,Young et al., 1982]. The composition is also known to change during large storms as the outflow of ionospheric O+ increases [e.g.,Lockwood et al., 1985;Yau et al., 1985;Lennartsson, 1988;Daglis et al., 1999;Fu et al., 2001] The source of the additional O+detected in the plasma sheet is the ionosphere. At times of high solar activity, the Earth’s neutral atmo-sphere expands due to increased incident solar EUV radi-ation. This heating elevates the heavier constituents of the neutral atmosphere and the proportion of these that become ionized is increased in comparison to periods of low solar activity, as shown by several observational and theoretical studies [e.g., Bailey and Sellek, 1990; West et al., 1997;
Figure
10.
The
averaged
HE
density
plotted
as
a
function
o
f
the
Kp
index
and
local
time
for
each
year
between
1990
and
[image:12.592.67.449.69.751.2]Denton and Bailey, 2001]. In the high-latitude region these ions and electrons travel tailward, are energized, and may enter the plasma sheet and then be injected back into the inner magnetosphere on the nightside. Such outflow from the auroral ionosphere means that heavy ions, including O+ and He+, and electrons are found in relatively greater proportions within the magnetosphere during such times. Similarly, a greater proportion of heavier ions and electrons will be detected in the plasma sheet during elevated solar activity and during storm periods.
[45] It is known that the composition of O+ in the inner magnetosphere increases with solar activity [e.g., Young et al., 1982], and more specifically with the solar EUV flux [e.g., Lund and Mo¨bius, 2000]. The MPA instrument cannot directly detect ion composition, and in computing the moments summarized above, the ion population is assumed to be entirely composed of H+. However, under the following conditions the MPA measurements may be used to estimate the concentration of O+: (1) the hot plasma sheet populations measured by MPA (30 eV to 45 keV for the electrons and 100 eV to 45 keV for the ions) are much denser than any lower-energy populations present and that (2) the contribution of higher-energy particles (>45 keV) to the density of either species is negligible.
[46] The technique described below is only applicable in regions where both of these conditions are met. In the dusk sector, electrons do not have access to the inner magneto-sphere [Korth et al., 1999] and the relations described below cannot be used. Close to local midnight, the number of electrons and ions entering the inner magnetosphere in this energy range are likely to be in balance. In this region, freshly injected plasma is found to have a HE/HP density ratio close to unity (see Figure 2), and the LP density is typically low (see Figure 1), and thus the method of deriving composition can be more readily trusted.
[47] The hot electrons density measured by MPA is the sum of electrons from all ionized atoms. Thus during
periods when O+is present (and neglecting the contribution of other ions) then, from charge neutrality, the density of the hot electrons,NHE, is given by
NHE¼NHþþNOþ; ð2Þ
whereNH+ is the H+ density andNO+ is O+ density. [48] The MPA instrument is an E/q analyzer and for normal operations the measured population is assumed to consist entirely of protons. From calculation of the velocity distribution function [Thomsen et al., 1999], the contribu-tion to the total ion density of an ion species of mass miis given by
p
mp=mi
; ð3Þ
wherempis the proton mass. Thus assuming that the total number of electrons and protons is equal, the nominal hot proton density,NHP, is given by
NHP¼NHþþNOþ=4: ð4Þ
Equations (2) and (4) can be rearranged and solved for the hydrogen density and the oxygen density so
NOþ¼4=3ðNHENHPÞ ð5Þ
and
NHþ¼ ð4NHPNHEÞ=3: ð6Þ
[49] The O+/H+density ratio was calculated for the years 1990 to 2001 as a function of Kp and local time. These results are likely to not be valid in regions away from the local midnight, since, particularly close to dusk, electrons do not have access to geosynchronous orbit and the electron and proton numbers are not equal (see Figure 2). However, applying the method to the entire data set produces the results displayed in Figure 12. The gray bins in this case are regions where either the number of samples in each bin was less than five or whereNHP>NHE. The figure clearly shows the solar activity dependence of the derived O+/H+density ratio.
[50] To quantify the inferred O+ and H+ densities and their ratio as a function of Kp and solar activity, the densities at 0300 LT, where the equivalence of hot ion and hot electron density is most likely and where there is a negligible low-energy population, were fit to a straight line for each year between 1991 to 2001, inclusive, a full 11 year solar cycle. The resulting straight line fits to the data are shown in Figure 13 along with the standard deviation from the fit shown in brackets. The lines in Figure 13 are colored according to year, with red representing data from solar maximum (defined as 1991 and 2001) and black represent-ing data from solar minimum (1996). Both the H+and O+ derived densities in this energy range are correlated with the convection electric field, proxied by Kp, and clearly, also with the solar cycle.
[image:13.592.51.290.68.242.2][51] During low solar activity, best characterized by the results from 1996, the H+density increases with increasing Kp, while the O+density remains low. It has been estimated
Figure
12.
The
averaged
ratio
of
O
+
to
H
+
plotted
as
a
function
o
f
the
Kp
index
and
local
time
for
each
year
between
1990
and
[image:14.592.70.449.75.741.2]that around half of the total H+density in the plasma sheet is terrestrial in origin [Lennartsson, 1988], with the remaining proportion coming from the solar wind. Hence it may be expected that an increase in solar activity will lead to an
[image:15.592.50.292.63.620.2]increase in ionospheric outflow of H+ and thus an increase in plasma sheet H+. During years of elevated solar activity, Figures 12 and 13 demonstrate that the proportion of O+and H+, and also the O+/H+density ratio increases with increas-ing solar activity. These results indicate that durincreas-ing the years close to solar maximum, for periods of high convection, the O+ density approaches 50% of the total plasma sheet ion density.
5. Conclusions and Future Work
[52] We have presented a comprehensive analysis of bulk plasma parameters at geosynchronous orbit and the rela-tionship between the HE and HP densities and temperatures and various derived bulk plasma parameters as a function of
Kp,Dst, and storm phase. We have analyzed the HE density as a function of solar cycle and, in addition, have derived the O+ and H+ densities under certain conditions and the corresponding O+/H+ratio as a function of solar cycle.
[53] The results of the extended analysis of the bulk plasma parameters with Kp confirm the strong correlation of the HP, HE, and LP densities with theKpindex. In part, this is due to whether plasma has access to geosynchronous orbit. The LP density is typically high during quiet periods and is reduced as plasma drains to the magnetopause during storm times, with a strong local time dependence. We similarly conclude that plasma sheet access to geosynchro-nous orbit is strongly correlated withDstand local time, for many of the same reasons. Since storm periods when the ring current is enhanced may also be periods of high magnetospheric convection, the arguments presented by
Korth et al. [1999] are valid to describe particle access and behavior.
[54] The HP temperature shows a strong diurnal asym-metry when plotted with respect to both Kp and Dst. Protons in the afternoon and premidnight sectors have a much higher perpendicular and parallel temperature com-pared with protons in the postmidnight and morning sectors. This temperature asymmetry may be due to the different paths the protons take through the system. Protons which are injected close to local midnight can pass the Earth on either the dawnside or duskside. Protons which follow paths to the duskside appear to be heated more strongly in both the perpendicular and parallel directions than protons which pass to the dawnside. For the hot electrons, their tempera-ture appears to be maximized in the region close to local midnight. It is likely that the increase in HE temperature in this region is associated with delivery of fresh material to the inner magnetosphere.
[55] It is interesting to note that the highest HP density, typically observed for the highestKpand most negativeDst
intervals, is at dawn, where the plasma is relatively cold. This is consistent with the findings of Thomsen et al.
[2003], who suggest the strongest storms should follow periods of northward IMF, when the plasma sheet can fill with cold, dense plasma, followed by an extended interval of strong southward IMF which delivers this plasma into the inner magnetosphere.
[56] The solar cycle dependence of HE density at geo-synchronous orbit has been demonstrated for the first time. The HE density at solar maximum can be on average almost double that at solar minimum. HE density is also strongly
correlated with the strength of the magnetospheric convec-tion. The implication of this result is an enhanced source of hot electrons during high solar activity, from either the solar wind or the ionosphere or, more probably, from both.
[57] The ratio of plasma sheet O+ to H+ density is significantly greater at solar maximum than solar minimum. The ratio is also higher during periods of enhanced con-vection. These effects are assumed to be due to the solar cycle and storm time enhancement in ionospheric concen-trations in both constituents and their resulting outflow from the ionosphere, their entry into the plasma sheet, and subsequent reentry into the inner magnetosphere. Both the O+ and the H+ densities are enhanced during solar maxi-mum and high convection periods. However, the O+ increases by a greater amount and hence the overall O+/ H+density increases.
[58] The results of this study are intended to provide an improved set of parameters with which to constrain the boundary conditions of ring current models. Knowledge of the temporal evolution of the plasma during storms and local time regions where plasma sheet entry can occur will hopefully encourage the development of improvements to models and a better description of the ring current that evolves from this source population.
[59] Two subjects suggest themselves for further study. First, as indicated byThomsen et al.[2003], the presence of cold dense plasma sheet material at geosynchronous orbit is related to the strength of storms. The results show that cold dense plasma appears to be present more strongly at dawn than dusk, and the cause of this is currently being investi-gated. However, it is also known that the formation of the cold dense plasma sheet is dependent upon the IMF BZ orientation, and hence ordering the MPA data set with respect to this parameter would allow a quantification of how dependent the cold dense plasma sheet is upon IMFBZ. Second, to further investigate how the size of storm affects the formation of the ring current, it would be useful to order the superposed epoch data according to the minimum Dst
for each storm. How is the temporal delivery of plasma sheet material different, if at all, for small, medium and large storms? Are different physical processes operating? Analysis based upon the size of storms would avoid the mixing of data that occurs when storms of all sizes are analyzed.
6. Summary
[60] To summarize, we make the following conclusions regarding bulk plasma properties at geosynchronous orbit:
[61] 1. The hot electron and hot ion densities in the plasma sheet are highest for the highest values of Kp and
Dst and peaks are present in the evening sector and the postdawn sector, the latter being slightly larger. The plasma sheet density, temperature, and related quantities all strongly correlate with the strength of the convection and the strength of the ring current. The presence of plasma sheet material at geosynchronous orbit during storms is correlated with the phase of the storm.
[62] 2. Plasma sheet material is delivered to the inner magnetosphere immediately following the commencement of storms, during times of positive Dst. This implies a
deeper penetration of the plasma sheet immediately after a sudden storm impulse.
[63] 3. The plasma sheet electron density in the energy range 30 eV to45 keV increases with increasing magne-tospheric convection and increasing solar activity. The hot electron density may be 100% greater at solar maximum than at solar minimum.
[64] 4. The density ratio of plasma sheet O+ to H+, inferred from MPA measurements, is highly correlated with the strength of convection and the period in the solar cycle. The O+/H+ density ratio increases with increasing solar activity and convection strength. The O+ contribution to the overall density may approach 50% during solar maxi-mum for periods of high magnetospheric convection.
[65] Acknowledgments. The authors wish to thank R. M. Skoug, M. G. Henderson, and P. H. Janzen for many helpful discussions. This work was performed under the auspices of the U.S. Department of Energy, with partial support from the NASA Living With a Star program.
[66] Lou-Chuang Lee thanks Masaki Fujimoto and another reviewer for their assistance in evaluating this paper.
References
Bailey, G. J., and R. Sellek (1990), A mathematical model of the Earth’s plasmasphere and its application in a study of He+ at L = 3,Ann. Geo-phys.,8, 171 – 190.
Bame, S. J., D. J. McComas, M. F. Thomsen, B. L. Barraclough, R. C. Elphic, J. P. Glore, J. C. Chavez, E. P. Evans, and F. J. Wymer (1993),
Rev. Sci. Instrum.,64, 1026 – 1033.
Bartels, J., N. A. Heck, and H. F. Johnston (1939), The three-hour-range index measuring geomagnetic activity,J. Geophys. Res.,44, 411 – 454. Birn, J., M. F. Thomsen, J. E. Borovsky, G. D. Reeves, D. J. McComas, and
R. D. Belian (1997), Characteristic plasma properties during dispersion-less substorm injections at geosynchronous orbit,J. Geophys. Res.,102, 2309 – 2324.
Borovsky, E. B., M. F. Thomsen, R. C. Elphic, T. E. Cayton, and D. J. McComas (1998), The transport of plasma sheet material from the distant tail to geosynchronous orbit,J. Geophys. Res.,103, 20,297 – 20,331. Chen, M. W., L. R. Lyons, and M. Schulz (1994), Simulations of phase
space distributions of storm time proton ring current,J. Geophys. Res.,
99, 5745 – 5759.
Daglis, I. A., G. Kasotakis, E. T. Sarris, Y. Kamide, and B. Wilken (1999), Variations of the ion composition during an intense magnetic storm and their consequences,Phys. Chem. Earth, Part C,24, 229 – 232. Denton, M. H., and G. J. Bailey (2001), Modelling the high altitude
elec-tron temperature: A modified thermal conductivity,Dyn. Atmos. Oceans,
34, 365 – 381.
Feynman, J. (1980), Implications of solar cycles 19 and 20 geomagnetic activity for magnetospheric processes,Geophys. Res. Lett.,7, 971 – 973. Fok, M.-C., T. E. Moore, and M. E. Greenspan (1996), Ring current devel-opment during storm main phase,J. Geophys. Res.,101, 15,311 – 15,322. Friedel, R. H. W., H. Korth, M. G. Henderson, M. F. Thomsen, and J. D. Scudder (2001), Plasma sheet access to the inner magnetosphere,J. Geo-phys. Res.,106, 5845 – 5858.
Fu, S. Y., B. Wilken, Q. G. Zong, and Z. Y. Pu (2001), Ion composition variations in the inner magnetosphere: Individual and collective storm effects in 1991,J. Geophys. Res.,106, 29,683 – 29,704.
Fujimoto, M., T. Terasawa, T. Mukai, Y. Saito, T. Yamamoto, and S. Kokubun (1998), Plasma entry from the flanks of the near-Earth magnetotail: Geotail observations,J. Geophys. Res.,103, 4391 – 4408.
Heelis, R. A., W. B. Hanson, and G. J. Bailey (1990), Distributions of He+ at middle and equatorial latitudes during solar maximum,J. Geophys. Res.,95, 10,313 – 10,320.
Huang, C.-S., J. C. Foster, P. Song, G. J. Sofko, L. A. Frank, and W. R. Paterson (2002), Geotail observations of magnetospheric midtail during an extended period of northward interplanetary field,Geophys. Res. Lett.,
29(4), 1056, doi:10.1029/2001GL014170.
Jordanova, V. K., J. U. Kozyra, A. F. Nagy, and G. V. Khazanov (1997), Kinetic model of the ring current-atmosphere interactions,J. Geophys. Res.,102, 14,279 – 14,291.
Kersley, L., and J. A. Klobuchar (1978), Storm associated protonospheric depletion and recovery,Planet. Space Sci.,28, 453 – 458.
Korth, H., and M. F. Thomsen (2001), Plasma sheet access to geosynchro-nous orbit: Generalization to numerical field models,J. Geophys. Res.,
Korth, H., M. F. Thomsen, J. E. Borovsky, and D. J. McComas (1999), Plasma sheet access to geosynchronous orbit,J. Geophys. Res., 104, 25,047 – 25,061.
Lennartsson, W. (1988), Comparison of plasma sheet ion composition with the IMF and solar wind,Adv. Space Res.,8(9 – 10), 135 – 138. Lennartsson, W., and E. G. Shelley (1986), Survey of 0.1- to 16-keV/e
plasma sheet ion composition,J. Geophys. Res.,91, 3061 – 3076. Lockwood, M., J. H. Waite Jr., T. E. Moore, J. F. E. Johnson, and C. R.
Chappell (1985), A new source of suprathermal O+near the dayside polar cap boundary,J. Geophys. Res.,90, 4099 – 4116.
Lund, E. J., and E. Mo¨bius (2000), The ionospheric source of magneto-spheric plasma and the importance of solar EUV flux measurements,
Phys. Chem. Earth, Part C,25, 529 – 531.
McComas, D. J., S. J. Bame, B. L. Barraclough, J. R. Donart, R. C. Elphic, J. T. Gosling, M. B. Moldwin, K. R. Moore, and M. F. Thomsen (1993), Magnetospheric plasma analyzer: Initial three-spacecraft observations from geosynchronous orbit,J. Geophys. Res.,98, 13,453 – 13,465. McComas, D. J., P. Valek, J. L. Burch, C. J. Pollock, R. M. Skoug, and M. F.
Thomsen (2002), Filling and emptying of the plasma sheet: Remote observations with 1 – 70 keV energetic neutral atoms, Geophys. Res. Lett.,29(22), 2079, doi:10.1029/2002GL016153.
Phan, T. D., R. P. Lin, S. A. Fuselier, and M. Fujimoto (2000), Wind observations of mixed magnetosheath-plasma sheet ions deep inside the magnetosphere,J. Geophys. Res.,105, 5497 – 5505.
Sugiura, M. (1964), Hourly values of equatorialDstfor the IGY, inAnnual International Geophysical Year, vol. 35, p. 9, Elsevier, New York. Terasawa, T., et al. (1997), Solar wind control of density and temperature in
the near-Earth plasma sheet: Wind/Geotail collaboration,Geophys. Res. Lett.,24, 935 – 938.
Thomsen, M. F. (2004), WhyKpis such a good measure of magnetospheric convection,Space Weather,2, S11004, doi:10.1029/2004SW000089. Thomsen, M. F., J. E. Borovsky, D. J. McComas, and M. R. Collier (1998),
Variability of the ring current source population,Geophys. Res. Lett.,25, 3481 – 3484.
Thomsen, M. F., E. Noveroske, J. E. Borovsky, and D. J. McComas (1999), Calculation of moments from measurements by the Los Alamos magne-tospheric plasma analyzer,LA Rep. LA-13566-MS, Los Alamos Natl. Lab., Los Alamos, N. M.
Thomsen, M. F., J. Birn, J. E. Borovsky, K. Morzinski, D. J. McComas, and G. D. Reeves (2001), Two-satellite observations of substorm injections at geosynchronous orbit,J. Geophys. Res.,106, 8405 – 8416.
Thomsen, M. F., J. E. Borovsky, R. M. Skoug, and C. W. Smith (2003), Delivery of cold, dense plasma sheet material into the near-Earth region,
J. Geophys. Res.,108(A4), 1151, doi:10.1029/2002JA009544. Vennerstrøm, S., and E. Friis-Christensen (1996), Long-term and
solar cycle variation of the ring current, J. Geophys. Res., 101, 24,727 – 24,735.
West, K. H., R. A. Heelis, and F. J. Rich (1997), Solar activity variations in the composition of the low-latitude topside ionosphere,J. Geophys. Res.,
102, 295 – 305.
Wolf, R. A., M. Harel, R. W. Spiro, G. H. Voigt, P. H. Reiff, and C. K. Chen (1982), Computer simulation of inner magnetospheric dynamics for the magnetic storm of July 29, 1977,J. Geophys. Res.,87, 5949 – 5962. Yau, A. W., P. H. Beckworth, W. K. Peterson, and E. G. Shelley (1985),
Long-term (solar cycle) and seasonal variations of upflowing ionospheric ion events at DE 1 altitudes,J. Geophys. Res.,90, 6395 – 6407. Young, D. T., H. Balsiger, and J. Geiss (1982), Correlations of
magneto-spheric ion composition with geomagnetic and solar activity,J. Geophys. Res.,87, 9077 – 9096.
M. H. Denton and M. F. Thomsen, Space Science and Applications (ISR-1), Los Alamos National Laboratory, P. O. Box 1633, MS D466, Los Alamos, NM 87545, USA. ([email protected]; [email protected])
H. Korth, Space Physics Group, Johns Hopkins University Applied Physics Laboratory, MS MP3-E128, 11100 Johns Hopkins Road, Laurel, MD 20723-6099, USA. ([email protected])
M. W. Liemohn and J. C. Zhang, Atmospheric, Oceanic, and Space Sciences Department, University of Michigan, 2455 Hayward Street, Ann Arbor, MI 48109-2143, USA. ([email protected]; liemohn@ umich.edu)