Performance Optimization of the Database Sequencing
Applications
Talal Bonny
Department of Electrical and Computer Engineering College of Engineering
University of Sharjah, UAE
ABSTRACT
Database sequencing applications such as sequence comparison process large size of sequences and considered to be high con-sumers of computation time. Heuristic algorithms have the prob-lem of sensitivity since they trim the search and miss unexpected but important homologies. Traditional optimal methods apply these applications on the whole database to find the most matched se-quences but this consumes very high computation time. We in-troduce novel and efficient technique which optimizes the perfor-mance of the database sequencing applications by reducing the computation time of finding the optimal matched sequence in a large database. Our technique uses our new similarity functions which are based on the mathematical parameters: frequency and mean of the codes of each sequence in the database. Using our technique, we explicitly accelerate the database sequencing appli-cations by 60% in comparison to the traditional known methods.
Keywords:
Database, sequence comparison, Sequence Analysis
1. INTRODUCTION
Sequence computing applications such as sequence analysis, sequence comparing, sequence alignment, sequence searching, etc, are widely used in different research fields: In Biology [11, 12], rapid analysis of DNA and Protein sequences are performed to search a large database of sequences for close matches to particular sequence of interest, typically a recently discovered protein. If correlations are found, new drugs may be developed or better techniques invented to treat the disease.
In Computer science [16], sequence comparison is used under the term”string editing”for error correction routines such as spell checkers and file comparison algorithms. It is based on searching or comparing a large database of sequences (word or words) for a particular one. In social science [3, 6, 10, 8], Sequence comparison involves a bewildering variety of topics, from careers to daily life to national histories. In video processing [17], a frame sequences which contain the video spatial and temporal information are aligned to identify nearly repetitive contents in a stream of video. All previous applications are considered to be high consumers of computation time because it is based on searching or comparing a particular sequence with large database of sequences. Heuristic
algorithms, such as FASTA [4] and BLAST [5], are fast in finding approximate solutions. These algorithms have the problem of sensitivity since they trim the search and miss unexpected but important homologies. On the other hand, The Needleman-Wunsch [1] and Smith-Waterman [2] algorithms guarantee the return of the optimal comparison results of two sequences. In these algorithms, the searched sequence, we call it query sequence, needs to be compared with each sequence of the database. For each pairwise comparison process, an similarity score (alignment score) is computed which refers to the metric distance between the two compared sequences (explained later). The highest score refers to the sequence of the database which is most close to the query sequence.
The Needleman-Wunsch [1] and Smith-Waterman [2] algorithms are based on the dynamic programing, programing that handles a large computing problem by solving a set of smaller problems whose results depend dynamically on one another. The results are provided in a time that is proportional to the product of the lengths of the two sequences being compared. i.e, if n is the length of the query sequence and m is the length of the database sequence, then the previous algorithms provide the optimal alignment in n x m steps. Therefore when searching a whole database the computation time grows linearly with the size of the database.
An efficient techniques or powerful platforms are proposed to process these large amounts of data in a reasonable time [13].
In [13], the authors used GPU and CPU to improve the perfor-mance of aligning the sequences by running the long sequences on the GPU and the short ones on the CPU. Another different methods were introduced for heuristic sequence alignment. In [7], the authors presented CUDA-based implementation of the Smith-Waterman Algorithm using GPU cards in common workstation.
The authors in [9] accelerated the Smith-Waterman using the GeForce 8800 GTX card. They used the on-chip shared memory to reduce the data amount being transferred between off-chip memory and processing elements in the GPU.
Volume 112 - No. 5, February 2015 Needleman-Wunsch method.
In all previous work and applications, similarity measure is used to measure how one object is close to the other. The object might be database sequence, string file, video stream, website page, etc. Any object is a sequence in a database and consists of different frequently repeated letters (codes).
In this contribution, we propose new similarity measures (we call them similarity functions) which are based on the mathematical parameters: frequency, and mean of the codes of each sequence in the database. Using our similarity functions, we reduce the time required to measure the similarity between two objects (database sequences), explicitly. In addition to that, we introduce a novel and efficient technique to reduce the computation time required to com-pute the similarity between the query sequence and all database sequences Our technique computes the similarity function scores for all database sequences and excludes sequences which have low score from the comparison process.In this case, we just need to apply the dynamic programing algorithm (Needleman-Wunsch or Smith-Waterman) on part of the database and not on the whole of it.
Using our technique, we explicitly reduce the time required for the database sequence comparison applications by 50% in comparison to the traditional methods used. This may open new era in database comparison applications.
The crux of our technique is that it may be applied in conjunction with the previous state-of-the-art methods (as in [15] and [14]) to further improve their time performance.
Our novel contributions are as follows:
(1) New similarity functions based on mathematical parameters are proposed to measure the similarity between two objects in reasonable time. The functions are frequency and mean of the codes of each sequence in the database.
(2) New technique is introduced to reduce the computation time required for optimal database sequence computing applica-tions. This may open new era in database comparison appli-cations.
(3) Our technique may be applied in conjunction with the pre-vious state-of-the-art methods to further improve their time performance.
The concept of reducing the the database computation time by using the function ”frequency” first proposed in our previous work [18]. In this paper, we have refined this function, proposed new function ”mean”, and combined the two functions ”Fre-quency+Mean” to improve the results.
The rest of the paper is organized as follows. In Section 2, we present the sequencing applications using traditional methods. In Section 3, we propose our similarity functions and demonstrate an example for them. Our technique to reduce the computation time of the sequencing applications and its time complexity are introduced in Section 4. Experimental results are presented in Section 5. We conclude this paper in Section 6.
2. SEQUENCING APPLICATIONS USING TRADITIONAL METHODS
The traditional methods are based on aligning the two sequences and computing the alignment score AS which refers to the simi-larity between two sequences. To search one sequence (query) in
D˺: LLFGGTTACCAAAGTT D˻: LLFTGAAACCCCAGTT D˼: TCCGGTTATTAAAGGT D˽: AFAGGTTACCNKAGLL D˾: TLLKKTTACCCCMGTT
. . . . . . .
Dn: TTLLLNNCCTTLAGFT Align Query with each
sequence
Database
D
a
ta
b
a
se
Se
q
u
e
n
ce
T
….
G
F
L
L
Query Sequence T A T C ……T
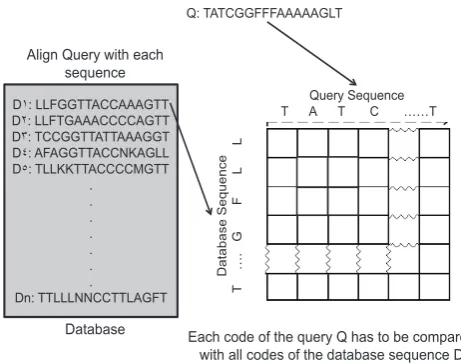
[image:2.595.317.548.66.248.2]Each code of the query Q has to be compared with all codes of the database sequence D Q: TATCGGFFFAAAAAGLT
Fig. 1. Sequence alignment. Each element (code) in the query sequence
has to be compared with all elements of the database sequences
a database sequences, the query sequence has to be aligned with each sequence of the database starting from the first sequence of the database till the last one the alignment score AS for each alignment process has to be computed. In each alignment process, each ment (code) in the query sequence has to be compared with all ele-ments of the database sequences (see Fig. 1). The alignment score is based on the result of the comparison, which is either match, or mismatch. If the sequences are mismatched, then one of three oper-ations may be done: insertion, deletion, or substitution. Gaps may be added to one or both sequences to make them close to each oth-ers Each of these operations has a previously defined score. For each alignment process between the query and the database se-quences, an alignment score (AS) is computed as following:
AS = (# of matches×match score) (1) +(# of gaps×gap score)
+(# of mismatches×mismatch score)
Usually, the match score is positive but the mismatch and the gap scores are negative. Therefore, more number of matches increases the alignment score but more number of gaps or mismatches de-creases the alignment score. The scores of match, mismatch and gap are given as input parameters.
The optimal number of matches, mismatches and gaps are com-puted using the Needleman-Wunsch algorithm [1] or Smith-Waterman [2] algorithm. In any algorithm, a scoring matrix of size m x n (m being the length of the query sequence and n being that of the database sequence) is first formed. The optimal score at each matrix element is calculated by adding the current match score to previously scored positions and subtracting gap penalties. Each ma-trix element may have a positive, negative or 0 value according to a score defined previously [1]. After the T matrix is filled up, to determine an optimal alignment of the sequences from scoring ma-trix, a method called trace back is used. The trace back keeps track of the position in the scoring matrix that contributed to the highest overall score found. The positions may align or may be next to a gap, depending on the information in the trace back matrix. There may exist multiple maximal alignments.
pro-portional to the product of the lengths of the two sequences being compared, i.e, n x m steps.
3. OUR PROPOSED SIMILARITY FUNCTIONS
As explained in Section 2, to measure the similarity using tradi-tional methods, each element (code) in the query sequence has to be compared with all elements of the database sequences. This will take long time especially if the two sequences being compared are too long as the computation time is based on the product of the lengths of these two sequences. In this chapter, we propose our new similarity measures, we call them similarity functions. These functions are based on the mathematical parameters: frequency and mean of the codes of each sequence in the database.
Considering that each sequence consists of different repeated code, we introduce our first similarity function which is called ”Frequency Function”. It is based on the code frequency for all sequences. The frequency is the number of repeated code in the sequence. It is an indicator for the similarity between two sequences. For instance, if the frequency of the code in a sequence is close to its frequency in another sequence, this is a good indicator that the two sequences might be similar. But if it is far from each other, that means, the sequences are not similar.
Usually, the sequence has more than one different codes, to find if there is similarity between two sequences each have different codes, we compute the frequency difference score (FDS). The fre-quency difference score is the sum of the absolute values of the differences between the two sequences for each code type. Mathematically, the frequency difference score (FDS) between the query sequence ‘Q’ and the database sequence ‘D’ is defined as following considering that both sequences have ‘n’ alphabet codes:
FDS = |F req code1(Q)−F req code1(D)|
+|F req code2(Q)−F req code2(D)|
+|F req code3(Q)−F req code3(D)|
+. . . (2)
+. . .
+|F req code n(Q)−F req code n(D)|
Where ”F req code1(Q)” is the frequency of code 1 in the query sequence. ‘”F req code1(D)” is the frequency of code 1 in the database sequence, etc.
To find the frequency for each code in the sequence, we scan the database sequence starting from the first code till the last one using number of counters equal to the different codes. One counter for each code. Each counter is incremented by one when it meets new code of the same type. By the end of the scanning, all counters save their values beside the database sequence. The counter values beside any sequence refer to the frequency of codes types for that sequence.
Our first similarity function does not give always correct results. For example, if the two sequences have the same (or close) number of codes frequencies but the codes are distributed in different way between the two sequences. In this case the frequency score is not correct score to measure the similarity.
Therefore, we introduce our second similarity function which is called”Mean Function”. The mean (also known as average), is
Untitled
Q : AACAAGGACCATAGATTATGCAGGATCGCCACATGATTCGTATGCGTCAG D1: TCTCCTTCCACAGTTTATTTCCTCGCTTCCTTTGCATCTAAACCTTTCTT D2: TGTTTCCACTTCATGGGATATGACTCCATCACAATGAAAATGGGTCCAGT D3: ACTGACCTAGCAGATGTGTGGAAAAGGAATCAGATCTTGATTCTTCTGGG D4: CTCTCTGGAGGTACTGAGACAGGGTGCTGATGGGAAGGAGGGGAGCCTTT D5: GTGGGAGGGTGAGATGTGAAGATGTGGGATGAACCTGGAATGAACGAATT
Fig. 2. Demonstration example for 5 database sequences (D1, D2, D3, D4,
D5) and query sequence (Q), each of 50 codes (nucleotides) length
obtained by dividing the sum of observed codes by the number of observations. It is defined as following:
¯ X=
Pi=n
i=1Xi
n
In our case, it is useful to identify the central location of the code or its concentration. So, it is good indicator to show the similarity between two sequences. For instance, if the mean of the code in a sequence is close to its mean in another sequence, this is a good indicator that the two sequences might be similar.
If the sequence has different codes, to find if there is similarity between them, we compute the mean difference score (MDS). as we defined the frequency difference score (FDS) .
Our second similarity function does not give always correct results. For example, if the two sequences have the same (or close) mean of each code but the number of codes is not the same in the two sequences. In this case the ”Mean Score” is not correct score to measure the similarity.
Therefore, we propose our third similarity function which is called ”Frequency+Mean Function”. In this score, we add the two scores ”Frequency” and ”Mean” to measure the similarity between two sequences. This score is good indicator for the similarity be-cause it does not consider the number of codes in each sequence only but also the concentration of the code in the sequence.
3.1 Demonstration Example
As a demonstration example, we assume that we have a DNA database (illustrated in Fig. 2) which contains 5 sequences, each of length 50 codes. The different alphabet codes in each sequence are (A,C,G,T)1.
Assuming we want to search this database to find the most closest sequence to the query sequence (Q) (illustrated in Fig. 2).
Using our first similarity function ”Frequency Function”, we need to find the frequency of the codes for the query and for each database sequence as following:
Freq Q(A,C,G,T)=(16,11,12,11)
Freq D1(A,C,G,T)=(7,17,3,23) Freq D2(A,C,G,T)=(14,11,10,15) Freq D3(A,C,G,T)=(14,8,14,14) Freq D4(A,C,G,T)=(10,8,21,11) Freq D5(A,C,G,T)=(15,3,21,11)
To find the most closest sequence of the database to the query sequence, we need to compute the frequency difference score
Volume 112 - No. 5, February 2015 (FDS)for each sequence of the database.
FDS(D1)=|16−7|+|11−17|+|12−3|+|11−23|= 36 FDS(D2)=|16−14|+|11−11|+|12−10|+|11−15|= 8 FDS(D3)=|16−14|+|11−8|+|12−14|+|11−14|= 10 FDS(D4)=|16−10|+|11−8|+|12−21|+|11−11|= 18 FDS(D5)=|16−15|+|11−3|+|12−21|+|11−11|= 18
From the previous computations, we may conclude that the database sequence D2 and D3 which have the lowest difference score based frequency, are the closest sequences to the query sequence.
Using our second similarity function ”Mean Function”, we need to find the Mean of the codes for the query and for each database sequence as following:
Mean Q(A,C,G,T)=(18.6,25.6,27.0,29.0)
Mean D1(A,C,G,T)=(27.2,22.4,23.0,25.3) Mean D2(A,C,G,T)=(28.2,23.1,27.6,19.8) Mean D3(A,C,G,T)=(20.2,21.7,25.7,29.0) Mean D4(A,C,G,T)=(25.2,19.3,26.5,23.5) Mean D5(A,C,G,T)=(28.8,37.0,18.7,26.0)
To find the most closest sequence of the database to the query sequence, we need to compute the mean difference score (MDS) for each sequence of the database.
MDS(D1)= 19.4 MDS(D2)= 21.7 MDS(D3)= 6.9 MDS(D4)= 18.8 MDS(D5)= 32.7
From the previous computations, we may conclude that the database sequence D3 and D4 which have the lowest difference score based mean, are the closest sequences to the query sequence.
Using our third similarity function ”Frequency+Mean Function”, we need to add the Frequency to the Mean of the codes for the query and for each database sequence, then we need to compute the Frequency+Mean difference score (FMDS) for each sequence of the database.
FMDS(D1) = FDS(D1) + MDS(D1) =55.4 FMDS(D2) = FDS(D2) + MDS(D2) =29.7 FMDS(D3) = FDS(D3) + MDS(D3) =16.9 FMDS(D4) = FDS(D4) + MDS(D4) =36.8 FMDS(D5) = FDS(D5) + MDS(D5) =50.7
From the previous computations, we may conclude that the database sequence D3 which has the lowest difference score based Frequency+Mean, are the closest sequence to the query sequence.
To check if our proposal is correct, we use the traditional methods, which align the query (Q) with each sequence of the database, separately, by applying Needleman-Wunsch Algorithm 5 times (one for each database sequence). If we select The score of match, mismatch, gap open, and gap extend to be +2, -3, -5, -2, respectively, the alignment score (AS) of the query sequence with each database sequence will be:
AS(D1)=−58 AS(D2)=−50 AS(D3)=−42 AS(D4)=−65
AS(D5)=−60
From the previous results, we find that the sequence ‘D3’ is the most closest sequence to the query (Q) because it has the highest alignment score. Then D2 comes next.
This results are very close to the results we got using our first and second similarity functions but they are the same results as we got using our third similarity function ”Frequency+Mean Function”.
4. SEQUENCING APPLICATIONS USING OUR TECHNIQUE
In this section, we introduce our novel and efficient technique to reduce the computation time required for sequencing applications. Our technique uses our similarity functions we defined in Section 3 as a measure to compute the similarity between the query sequence and all database sequences.
The database of the sequencing applications contains large num-ber of sequences (as explained in Section 1). To align the query sequence (Q) with each sequence of the database (D), we need to apply Needlman-Wunsch algorithm on each pair of sequences (as explained in Section 2).
Our technique is based on filtering the database such that the database sequences which are not similar (not close) to the query are excluded from the searching and the Neddleman-Wunsch algorithm is applied only on the database sequences which are similar (close) to the query.
Our technique selects one of the similarity functions and computes the difference score of all different codes for each database sequence. The difference scores are stored beside each related sequence. This step may take long time as the database includes large number of sequences, but it is done off-line, i.e., independent from the comparison process. Therefore, it does not matter how long time it takes because we do it only one time and prepare the database for future comparison process.
Once a query sequence needs to be searched in (compared with) all database sequences, our technique computes the similarity function ”Frequency Mean Score” of all different codes for it, first. Then, it computes the difference score (DS) which is the sum of the abso-lute values of the differences between the two sequences for each code type (as explained in Section 3.1).
In the next step, our technique sorts the database sequences accord-ing to their difference score (DS), such that the sequences which have low difference scores (more close to the query sequence) are shifted to the top of the database.
In the last step, our technique applies the Needleman-Wunsch Al-gorithm only on the sequences, which have low difference scores (selected in the previous step). The sequences which have high difference scores will be excluded. This will provide the optimal alignment in reasonable time because Needleman-Wunsch Algo-rithm is applied only on a part of the database and not on whole of it. The next section shows how fast is our technique in comparison with the traditional methods by introducing its time complexity.
4.1 COMPLEXITY OF OUR TECHNIQUE
sequence D, respectively. As the Needleman-Wunsch Algorithm is based on dynamic programing, then the complexity to perform the alignment for one sequence isO(m×n). Ifsis the number of sequences in the database, then the total complexity will be O(m×n×s).
In case of our technique, assuming we havecdifferent codes. To compute the distribution of the c codes in the query sequence, we need to scan the query along its length. If the length of the query sequence ism, then we needmsteps to perform the scan. To compute the difference score (DS) between the query and one database sequence, we needcsteps to perform the subtraction for theccodes andc−1steps to sum up the results. Ifsis the number of sequences in the database, then we need((2c−1)×s)steps to compute the difference score. To sort thes difference scores from the smallest to the largest one using Heap sort or merge sort algorithm, we need(s×logs)steps.
Assuming that 50% of the database sequences are selected to apply Needleman- Wunsch Algorithm on them. To perform this step we needm×n×s/2steps.
Consequently, the total steps of our technique is ((m + (2c − 1) × s +s × logs) + (m × n × s/2)), i.e., the complexity isO(m×n×s/2).
For instance, if the length of the query m = 500, and the num-ber of the database sequences s = 10000. Each sequence of the database has length n = 500. To compare the query sequence with the database sequences using the traditional method, we need: 500 x 500 x 10000 = 2500000000 steps (2500 Million steps). Using our technique, and assuming that the data are codded with 4 different codes, we need:
500 + (7 x 10000) + (10000 x log 10000)+ (500 x 500 x 5000) =
≈1250Million steps.
Using our technique we save 50% of the time required to align the sequences using the traditional methods.
5. EXPERIMENTAL RESULTS
In this section, we present the experimental results of our tech-nique. To evaluate our technique, DNA sequences of the database DNA Data Bank of Japan (ddbj) [19] are used. 100 sequences of BCT and CON divisions are selected as case study. Each sequence has length of 400 nucleotides. The accession numbers of the selected sequences are presented in Fig. 3. We compare our technique with the traditional methods which use the first widely used program for optimal sequence alignment Needleman-Wunsch Algorithm [20]. The score of match, mismatch, gap open, and gap extend are selected to be +2, -3, 0, -4, respectively. As our database has 100 sequences, 100 cases are tested considering different query sequence for each case, i.e., in the first case, we consider the first sequence as query sequence and the remaining sequences as database. In the second case, we consider the second sequence as query sequence and the remaining sequences as database, and so on.
Figures 4, 5, and 6 shows the results for 100 cases when our similarity functions, Frequency, Mean and Frequency+Mean are used, respectively. In these figures, we define new parameter called ”Threshold”. The threshold for any test case is the number of sorted sequences between the sequence which has the lowest difference score (DS) and the highest alignment score (AS). In other words. The threshold refers to the number of sequences we need to ap-ply Needlman-Wunsch Algorithm on them (using our technique)
0 5 10 15 20 25 30 35 40 45 50
1 4 7
1
0
1
3
1
6
1
9
2
2
2
5
2
8
3
1
3
4
3
7
4
0
4
3
4
6
4
9
5
2
5
5
5
8
6
1
6
4
6
7
7
0
7
3
7
6
7
9
8
2
8
5
8
8
9
1
9
4
9
7
1
0
0
T
h
re
s
h
o
ld
Case ID
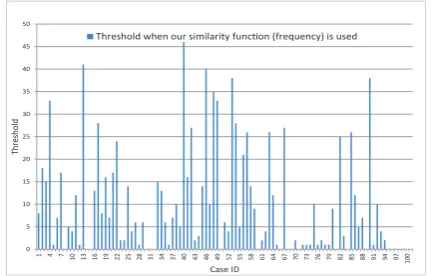
[image:5.595.328.544.67.205.2]dŚƌĞƐŚŽůĚǁŚĞŶŽƵƌƐŝŵŝůĂƌŝƚLJĨƵŶĐƟŽŶ;ĨƌĞƋƵĞŶĐLJͿŝƐƵƐĞĚ
Fig. 4. The threshold for each case of the 100 cases when the frequency
function is used
0 10 20 30 40 50 60 70 80 90
1 4710 13 16 19 22 25 28 31 34 37 40 43 46 49 52 55 58 61 64 67 70 73 76 79 82 85 88 91 94 97 100
T
h
re
s
h
o
ld
Case ID
[image:5.595.327.544.246.386.2]dŚƌĞƐŚŽůĚǁŚĞŶŽƵƌƐŝŵŝůĂƌŝƚLJĨƵŶĐƟŽŶ;ŵĞĂŶͿŝƐƵƐĞĚ
Fig. 5. The threshold for each case of the 100 cases when the mean
func-tion is used
instead of applying it on the whole database sequences (using the traditional methods).
In these figures, all 100 cases were tested to find the highest alignment score and the lowest difference score for each case (one case for each different query), and then the threshold were computed. The threshold differs from one case to another one based on the query sequence. In Figure 4, where our similarity function ”Frequency” is used, the maximum threshold among all other cases is ‘46’ which appears in the case number 40. This is the worst case in which we need to apply Needleman-Wunsch Algorithm on 46 sequences. In this figure, we notice that there are many cases in which the threshold is ”0”, i.e., the sequence which has the highest alignment score, has the minimum frequency difference score.
When our similarity function ”Mean” is used (Figure 5), the max-imum threshold (worst case) among all other cases is ‘78’ which appears in the case number 17.
Volume 112 - No. 5, February 2015
seq1-10 seq11-20 seq21-30 seq31-40 seq41-50 seq51-60 seq61-70 seq71-80 seq81-90 seq91-100
AB048424 AB233194 AB256443 AF083417 AF361720 AJ244499 AM082509 AY368739 AY721420 DQ193481
AB048476 AB256167 AB256455 AF092571 AF385397 AJ244503 AM083243 AY368750 AY660004 DQ193505
AB048512 AB256226 AB258189 AF135506 AF392312 AJ279078 AY081821 AY368768 AY721329 DQ383588
AB118108 AB256251 AB275608 AF184043 AF392313 AJ279147 AY270261 AY368825 AY721471 DQ485151
AB203159 AB256261 AB275613 AF202091 AJ000375 AJ334829 AY270800 AY368834 D32048 DQ654400
AB203551 AB256290 AB542708 AF228327 AJ132359 AJ336366 AY270823 AY368871 DQ181568 DQ654394
AB203561 AB256318 AF020672 AF232285 AJ133733 AJ428187 AY271174 AY368885 DQ193231 DQ654417
AB204837 AB256429 AF041005 AF255440 AJ236690 AJ509885 AY368704 AY370795 DQ193375 DQ654427
AB233178 AB256431 AF044558 AF275139 AJ237739 AJ575010 AY368712 AY721370 DQ193400 DQ654434
[image:6.595.66.284.229.370.2]AB256340 AB256440 AF083410 AF282555 AJ238233 AM077987 AY368722 AY642038 DQ193459 DQ654441
Fig. 3. The accession numbers of our evaluation database which consists of 100 sequences, each of 400 codes (nucleotides) length
0 5 10 15 20 25 30 35 40 45 50
1 4 7
1
0
1
3
1
6
1
9
2
2
2
5
2
8
3
1
3
4
3
7
4
0
4
3
4
6
4
9
5
2
5
5
5
8
6
1
6
4
6
7
7
0
7
3
7
6
7
9
8
2
8
5
8
8
9
1
9
4
9
7
1
0
0
T
h
re
s
h
o
ld
Case ID
dŚƌĞƐŚŽůĚǁŚĞŶŽƵƌƐŝŵŝůĂƌŝƚLJĨƵŶĐƟŽŶ;ĨƌĞƋƵĞŶĐLJнŵĞĂŶͿŝƐƵƐĞĚ
Fig. 6. The threshold for each case of the 100 cases when the
fre-quency+mean function is used
correct score to measure the similarity.
Therefore, a combination of the two similarity functions ”Fre-quency” and ”Mean” can give better results. This combination can be done by adding the frequency to the mean, i.e., our similarity function ”Frequency+Mean” is used (Figure 6). In this figure, the maximum threshold (worst case) among all other cases becomes ‘40’ which appears in the case number 48. This means that using the similarity function ”Frequency+Mean” to measure the similarity shows the best results.
In other words, when our technique is applied only on the top 40% of the database sequences, then the maximum AS, in any query case, will be included in this top part. I.e., applying Needleman-Wunsch Algorithm on this 40% of the database sequences will be enough to find the maximum alignment score instead of applying the algorithm on the whole database sequences as done by traditional methods.
Using the combination similarity function ‘Frequency + Mean’ gives better results than using the ‘Frequency’ alone. Figure 7 shows the threshold improvement when the combination is used. In this figure, 57 cases are improved (bars located in the positive area). The maximum improvement is ‘33’ which appears in the case number 4 (the threshold of this case is ‘33’ for similarity function ‘Frequency’ and becomes ‘0’ for ‘Frequency + Mean’ ). There are 24 cases where the threshold is ’0’ using the similarity function ‘Frequency’ and they remain the same in the similarity function ‘Frequency + Mean’. The remaining 19 cases are changed
10- 5-0 5 10 15 20 25 30 35
1 4 7 10 13 16 19 22 25 28 31 34 37 40 43 46 49 52 55 58 61 64 67 70 73 76 79 82 85 88 91 94 97
1
0
0
T
hr
e
sho
ld
Im
pr
o
ve
m
e
n
t
Case ID
[image:6.595.327.544.229.371.2]/ŵƉƌŽǀĞŵĞŶƚŽĨΖ&ƌĞƋƵĞŶĐLJнDĞĂŶΖŽǀĞƌΖ&ƌĞƋƵĞŶĐLJΖƐŝŵŝůĂƌŝƚLJĨƵŶĐƟŽŶ
Fig. 7. Improvement of the threshold when the similarity function
’Fre-quency + Mean’ is used instead of the function ’Fre’Fre-quency’
11, -380
42, -265
14 ,11
42,94
0 50 100 150 200 250 300 350 400
500- 400- 300- 200- 100-0 100
1
149367558646483986630563231676363394466153926289460269982550199193713445834110693294281381257542728
Fr
e
que
n
cy
D
if
fe
re
nc
e
S
co
re
(
FD
S)
A
lig
n
m
e
n
t
Sc
o
re
(
A
S)
Seque`ce ID Alignment Score (AS)
Frequency Difference Score (FDS)
Threshold = 46 Threshold = 46 Threshold = 46 Threshold = 46
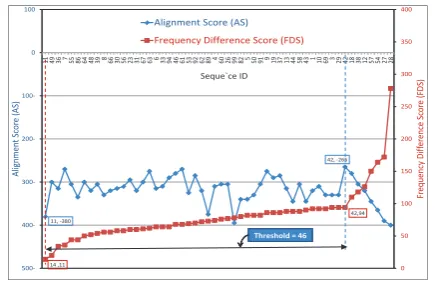
Fig. 8. The worst case threshold (the query is the sequence number 40)
when our similarity function ”Frequency” is used
negatively (bars located in the negative area).
[image:6.595.327.545.416.557.2]73 , 50
136 , 64 50 ,-255
64 , -225
450- 400- 350- 300- 250- 200- 150- 100- 50-0 0 50 100 150 200 250 300 350
50 59 37 18102 5 43 96 98100 11 41 65 24 7 22 91 9 35 31 2 29
A lig n m e n t Sc o re ( A S) Fr e que nc y+ M e an D if fe re nc e Sc o re ( FM D S) Sequence ID &ƌĞƋƵĞŶĐLJнDĞĂŶŝīĞƌĞŶĐĞ^ĐŽƌĞ;&D^Ϳ Alignment Score (AS)
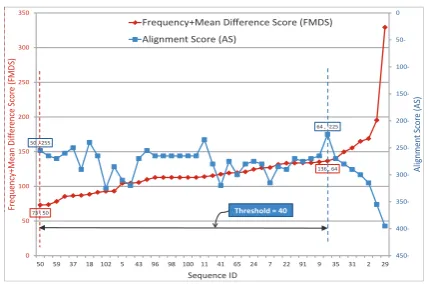
[image:7.595.66.282.64.206.2]Threshold = 40
Fig. 9. The worst case threshold (the query is the sequence number 48)
when our similarity function ”Frequency+Mean” is used
The alignment score (AS) and the difference score (DS) in these figures are computed for the query sequence (sequence number 40 in Fig. 8, and sequence number 48 in Fig. 9) with each sequence of the database. Then, The sequences are sorted based on their dif-ference score in ascending form, i.e. from the sequence which has the smallest difference score to the one which has the highest score.
In Fig. 8, the frequency difference score (FDS) curve is marked with a red label ”11, 14”. This label means that the minimum frequency difference score ‘14’ occurs at the sequence ‘11’. The alignment score (AS) curve is marked with a blue label ”42,-266”. It means that the maximum alignment score ‘-266’ occurs at the sequence ‘42’. The number of sorted sequences on the x-axis which are located between the minimum frequency difference score sequence and the maximum alignment sequence (i.e. ”Threshold”) is 46.
In Fig. 9, the frequency+mean difference score (FMDS) curve is marked with a red label ”50, 73”. This label means that the minimum frequency+mean difference score ‘73’ occurs at the sequence ‘50’. The alignment score (AS) curve is marked with a blue label ”64,-225”. It means that the maximum alignment score ‘-225’ occurs at the sequence ‘64’. The ”Threshold” in this figure is 40.
The common result in these two figures is, when the difference score (DS) is increased across the sequences, the alignment score (AS) is decreased (or vice versa). This result shows that the crite-rion we use in our technique, for selecting the sequences to which we may apply Needleman-Wunsch Algorithm on instead of the whole database sequences, is correct. This is because the sequences which have low difference scores have high alignment scores. When our technique is applied on less than 40 sequences of the database (i.e, more than 60 sequences are removed) and repeated for 100 cases (each case with different query), then the result will not be correct for all the 100 cases, i.e. the sequence which has the lowest difference score is not the same as the sequence which has highest similarity score. The results differ based on the number of removed sequences from the database.
Fig. 10 shows the error rate resulted from removing sequences from the database. The x-axis shows the number of removed sequences from each database for 100 cases. The y-axis shows the number of wrong cases resulted from removing sequences from the database. For example, when 99 sequences are removed from the database and our technique is repeated for the 100 cases, there will
0 10 20 30 40 50 60 70 80 1 0
0 97 94 91 88 85 82 79 76 73 70 67 64 61 58 55 25 49 46 43 40 37 34 31 82 25 22 19 16 13 10 7 4 1
# o f w ro ng c a se s re sul te d fr o m r e m o vi ng se que nc e s fr o m th e d at a b a se
[image:7.595.330.545.66.206.2]# of removed sequences from each database for 100 cases Error Rate
Fig. 10. Execution time comparison between traditional methods and our
technique 0 1 2 3 4 5 6
0 10 20 30 40 50 60 70 80
dŝ ŵ Ğ ;ƐĞ ĐͿ ƌĞ ƋƵ ƌŝĞ Ě ƚŽ Ă ƉƉ ůLJ Et Ž Ŷ ƚŚ Ğ ĚĂ ƚĂ ďĂ ƐĞ Ă ŌĞ ƌ re m o vi ng num be r o f se que nc e s
Number of removed sequences
[image:7.595.328.544.246.386.2]90
Fig. 11. Execution time comparison between traditional methods and our
technique
be ‘61’ wrong cases and only ‘39’ cases will have correct results, i.e., in each case of the 39 cases, the the sequence, which has the lowest difference score, has the highest similarity score. When the number of removed sequences decreases, the error rate will be decreased and the number of correct cases will be increased. When the number of removed sequences is ‘60’, i.e. only ‘40’ sequences are remained in the database, there will be no wrong cases. This is the best case in terms of the size of the database and the execution time. Removing less number of sequences will not effect on the result but negatively will increase the size of the database and consequently the time required to analyze it.
Fig. 11 shows the effect of removing more sequences from the database on the time required to find the highest similarity score sequence. Using the traditional methods by applying Needleman-Wunsch Algorithm on the whole database sequences, i.e. without removing any sequence, needs 5.9 seconds to get the optimal so-lution. When the the number of removed sequences increases, the execution time will be reduced but the error rate will be increased as shown in Fig. 10.
Volume 112 - No. 5, February 2015
0 1 2 3 4 5 6 7
T
im
e
in
se
co
n
d
s
Sequence ID
[image:8.595.66.282.64.206.2]dŝŵĞŽĨƚƌĂĚŝƟŽŶĂůŵĞƚŚŽĚ dŝŵĞŽĨŽƵƌdĞĐŚŶŝƋƵĞ
Fig. 12. Execution time comparison between traditional methods and our
technique
database sequences while the red one shows the time for our technique which applies NW algorithm on selected 40% of the database sequences. The last bars show the average execution time through all 100 cases.
In this figure, the execution time using our technique is 60% improved in comparison to the execution time required using the traditional methods. (the average time for traditional methods is 4.18 sec. while the average time for our technique is 1.7 sec.). This result we got because we have excluded selected 60% of the sequences from the process of applying Needleman-Wunsch Algoritm by using our technique.
6. CONCLUSIONS
We have proposed new similarity functions to measure the similar-ity between two sequences. And we have presented technique to reduce computation time required for database sequencing appli-cations. Our technique computes the difference score for each se-quence of the database and then selects the sese-quences which have the low scores. The alignment algorithms then are applied on these selected sequences. Using our technique saves almost 60% of the time required to perform the sequence comparing. This may open new era in database comparison applications.
7. REFERENCES
[1] S. Needleman and C. A. Wunsch. General method applicable to the search for similarities in the amino acid sequence of two sequences. Journal of Molecular Biology. Pages 443453, 1970 [2] T. F. Smith and M. S. Watermann. Identification of common molecular subsequence. Journal of Molecular Biology. Pages 196197, 1981
[3] B. Halpin and T. W. Chan. Class Careers as Sequences: An Optimal Matching Analysis of Work-Life Histories. European Sociological Review 14(2). Pages 111-30, 1998
[4] European Bioinformatics Institute Home Page, FASTA search-ing program, 2003. http://www.ebi.ac.uk/fasta33/.
[5] National Center for Biotechnology Information. NCBI BLAST home page, 2003. http://www.ncbi.nlm.nih.gov/blast. [6] L. Lesnard. Optimal Matching And Social Sciences. Working
Paper, Centre de Recherche en Economie et Statistique. Institut Nationale de la Statistique et des Etudes Economiques, Paris, France. 2006
[7] M. C. Schatz, C. Trapnell and A. Varshney. High-throughput sequence alignment using graphics processing units. BMC Bioinformatics. Page 10, 2007
[8] G. Pollock. Holistic Trajectories: A Study of Combined Em-ployment, Housing and Family Careers by Using Multiple-Sequence Analysis. Journal of the Royal Statistical Society: Series A 170(1). Pages:167-83, 2007
[9] Y. Munekawa and K. Hagihara. Design and implementation of the smith-waterman algorithm on the cuda-compatible gpu. In 8th IEEE International Conference on BioInformatics and Bio-Engineering. pages 16, 2008
[10] P. F. Marteau. Time Warp Edit Distance with Stiffness Adjust-ment for Time Series Matching. IEEE Transactions on Pattern Analysis and Machine Intelligence. Pages 306-318. 2008 [11] S. A. Manavski and G. Valle. Cuda compatible gpu cards as
efficient hardware accelerators for smith-waterman sequence alignment. Journal of Molecular Biology. Page 9, 2008 [12] Talal Bonny, M. A. Z. and Salama, K. N. An adaptive hybrid
multiprocessor technique for bioinformatics sequence align-ment. In the 5th Cairo International Conference on Biomedical Engineering. pages 112115, 2010
[13] M. Affan Zidan, T. B. and Salama, K. N. High performance technique for database applications using a hybrid gpu/cpu platform. IEEE/ACM 21st Great Lake Symposium on VLSI. pages 8590, 2011
[14] H. Yousefi, M. Ahmadi and H.R. Roshani. Fast sequence alignment algorithm using bloom filters. In 16th CSI Interna-tional Symposium on Artificial Intelligence and Signal Pro-cessing (AISP). Pages 484-489. 2012
[15] A. Chakraborty and S. Bandyopadhyay. Clustering of web sessions by FOGSAA. In IEEE Recent Advances in Intelligent Computational Systems (RAICS). Pages 282-287. 2013 [16] S. Kim, Y. J. Yoo, J. So, J. G. Lee and J. Kim., Design and
Implementation of Binary File Similarity Evaluation System. International Journal of Multimedia and Ubiquitous Engineer-ing, Vol.9, No.1. Pages 1-10, 2014
[17] Manal Al Ghamdi and Yoshihiko Gotoh. Alignment of nearly-repetitive contents in a video stream with manifold embedding. In IEEE International Conference on Acoustics, Speech and Signal Processing (ICASSP), Pages 1255-1259, 2014 [18] Talal Bonny and Bassel Soudan. Filtering Technique for High
Speed Database Sequence Comparison. To be published in the Ninth IEEE International Conference on Semantic Computing. Anaheim, USA. February,2015
[19] DNA Data Bank of Japan (ddbj): http://www.ddbj.nig.ac.jp/ [20] Needleman-Wunsch Algorithm”: