R E S E A R C H A R T I C L E
Open Access
Intra-session absolute and relative reliability
of pressure pain thresholds in the low back
region of vine-workers: effect of the
number of trials
Romain Balaguier
1,2, Pascal Madeleine
2*and Nicolas Vuillerme
1,2,3Abstract
Background:Pressure pain thresholds (PPT) are commonly used to quantify mechanical pain sensitivity of deep structures. Excellent PPT reliability has been previously reported among the low back of healthy subjects. However, there is a lack of studies assessing PPT over the low back of workers exposed to biomechanical risk factors of low back pain. Thus, the purpose of this study was threefold: (1) to evaluate the intra-session absolute and relative reliability as well as minimal detectable change (MDC) values of PPT within 14 locations covering the low back region of vine-workers and (2) to determine the number of trial required to ensure reliable PPT assessments and (3) to assess the effect of modifier factors such as gender, age, body mass index (BMI) and pain intensity on PPT reliability.
Methods:Twenty-nine vine-workers voluntarily participated in this study. Twenty-two reported low intensity of low-back pain while seven were pain-free. PPTs were assessed among 14 anatomical locations in the lower back region. Three trials were performed on each location with an interval time of at least one minute. Reliability was assessed computing intraclass correlation coefficients (ICC), standard error of measurement (SEM) for all possible combinations between trials. Bland-Altman plots were also generated to assess potential bias in the dataset. Finally, a repeated measure analysis of variance (RM-ANOVA) with the number of trials used as within subject factor was performed on (1) PPT, (2) ICC and (3) SEM values.
Results:ICC ranged from 0.86 to 0.99 for all anatomical locations and for all possible combinations between trials. SEM for comparison between trial 1–2, 2–3, 1–3 and, 1-2-3 ranged from respectively, 36.7–77.5, 27.8–77.7, 50–95.2 and, 39.3–80. 8 kPa. ICC and SEM remained similar to the ones obtained for the entire population when taking modifier factors in consideration. The visual analysis of Bland-Altman plots suggested small measurement errors for all anatomical locations and for all possible combinations between trials.
Conclusions:The assessment of PPTs of the lower back among vine-workers was found to have excellent relative and absolute reliability. Moreover, reliable measurements can be equally achieved when using the mean of three PPT measurement or with the first one.
Keywords:Agriculture, Low back pain, Vineyard workers, Pressure pain topography, Reliability
Abbreviations:ANOVA, Analysis of variance; BMI, Body mass index; CI, Confidence interval; ICC, Intraclass correlation coefficient; LOA, Limit of agreement; MDC, Minimum detectable change; NRS, Numeric rating scale; PPT, Pressure pain threshold; RM, Repeated measure; SD, Standard deviation; SEM, Standard error of the mean; VAS, Visual analog scale; WMSD, Work related musculo-skeletal disorders
* Correspondence:[email protected]
2Physical Activity and Human Performance group - SMI, Department of Health Science and Technology, Aalborg University, Aalborg, Denmark Full list of author information is available at the end of the article
© 2016 The Author(s).Open AccessThis article is distributed under the terms of the Creative Commons Attribution 4.0 International License (http://creativecommons.org/licenses/by/4.0/), which permits unrestricted use, distribution, and reproduction in any medium, provided you give appropriate credit to the original author(s) and the source, provide a link to the Creative Commons license, and indicate if changes were made. The Creative Commons Public Domain Dedication waiver (http://creativecommons.org/publicdomain/zero/1.0/) applies to the data made available in this article, unless otherwise stated. Balaguieret al. BMC Musculoskeletal Disorders (2016) 17:350
Background
Work-related Musculoskeletal Disorders (WMSDs) are considered in numerous countries as a public health prob-lem [1, 2]. WMSDs are often accompanied by pain located in the low back region [3, 4] and associated with muscle hyperalgesia [5]. Seventy percent of the population will ex-perience low back pain at least once in its lifetime [6–8]. In France, the prevalence of low back pain is particularly high especially in viticulture partly explained by the relatively high exposure to biomechanical risk factors, i.e. awkward postures, repetitiveness [9, 10].
In many studies dealing with WMSDs, visual analogue scale (VAS) and numeric rating scale (NRS) are commonly used to measure pain intensity in the low back region [11, 12]. Even if these self-reported methods of pain intensity are considered valid, reliable and responsive to change in the intensity of pain [13], they are also largely influenced by psychosocial aspects related to the environment and the be-liefs concerning the expected duration of pain [14]. How-ever, pain sensitivity is not uniformly distributed in a body region or along a muscle [15–18]. Using pain diagram to depict painful areas does not in general offer the possibility to visualize the spatial distribution of pain sensitivity [19].
Assessing pressure pain threshold (PPT) is a way of quantifying sensitivity of deep structures to mechanical pain [20, 21]. PPT has a good to excellent relative reliabil-ity in many anatomical locations such as neck [22–24], knee [25], temporalis and masseter muscles [26, 27] and the low back region [28–31]. However, for this latter ana-tomical location, only few studies assessed PPT’s absolute reliability [31–35]. While topographical pain sensitivity mapping technique has been developed in the low back [36–38], the number of assessed points in studies dealing with PPT’s reliability in the low back is limited to two lo-cations (2 cm laterally from L3 or L4 spinal processes). Moreover, most of these studies assessed PPT on young healthy subjects [31] and little is known about PPT’s reli-ability among workers exposed to biomechanical risk fac-tors of WMSDs in the low back region. Consequently, it is essential to have reliable tools assessing mechanical sensi-tivity to pain in order to e.g. monitor the effectiveness of an intervention among workers with occupations poten-tially leading to WMSDs like vine-workers. This need is further substantiated by the difference found in PPT when comparing workers to young asymptomatic individuals underlining mechanical hyperalgesia [5, 39, 40].
The purpose of this study was threefold: (1) to evaluate the intra-session absolute and relative reliability as well as minimal detectable change (MDC) values of PPT within 14 locations covering the low back region of vine-workers and (2) to determine the number of trial required to en-sure reliable PPT assessments and (3) to assess the effect of modifier factors such as gender, age, body mass index (BMI) and pain intensity on PPT reliability.
Methods
Participants
Twenty-nine adult vine-workers (16 men and 13 women) volunteered to participate in this study. Nineteen vine-workers out of 29 reported low-back pain at least 3 con-secutive days in the last 12 months and seven were pain free at the time of measurements. The workers were re-cruited from two vineyards in the Bordeaux (France) wine district. The vine-workers’ characteristics (anthropomet-rics, low-back pain duration and intensity) are presented in Table 1. The inclusion criteria were: age between 25 and 60 years, full-time employed as vine-worker, no history of spine or pelvis fracture, no tumor or spinal surgery and no pregnancy.
Experimental protocol
The PPT measurements were performed during working hours in one session lasting approx. 30 min using a hand-held electronic algometer (Somedic Algometer type 2, Sollentuna, Sweden) with a 1 cm2 wide rubber tip. PPTs were assessed over 14 anatomical locations in the low back region with 7 locations on each side of the lumbar spinal processes L1-L5. Each location was mea-sured trice (Trial 1, Trial 2 and Trial 3) by a single rater with at least 1 min between two consecutive trials on the same location to avoid temporal sensitization [41]. The algometer was calibrated prior to data collection. Pressure was applied at a constant slope of 30 kPa/s with the tip of the algometer perpendicular to the skin. The worker was lying comfortably in a prone position on a table and was asked to press a button that locks the alg-ometer display when the feeling of pressure changed to pain. Then, the examiner noted the pressure indicated on the algometer display corresponding to the PPT. Prior to recordings, the worker was familiarized with PPT assessment by measuring PPT on the tibialis anter-ior muscle considered as a reference point [42, 43].
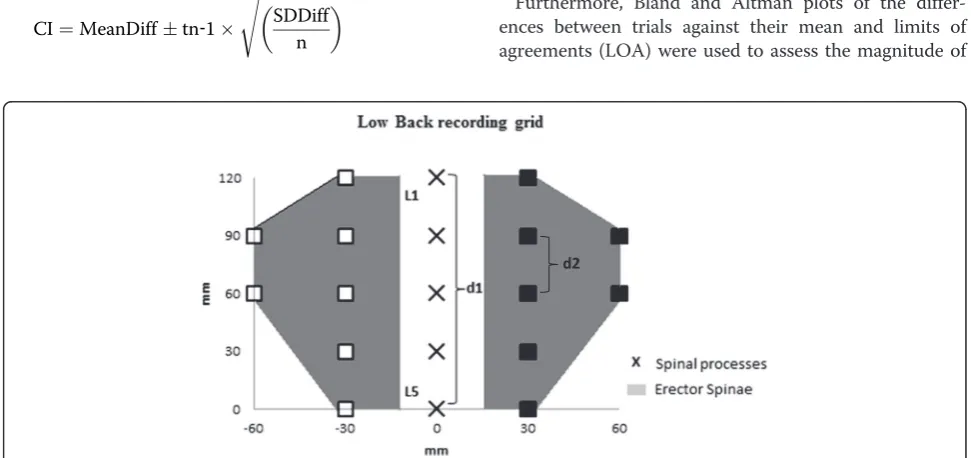
Procedure to mark the 14 anatomical locations
[image:2.595.306.538.621.730.2]Eight paper grids were designed for PPT measurements in the low back region. The design was based on the studies by Binderup and colleagues [36, 37] where the distance
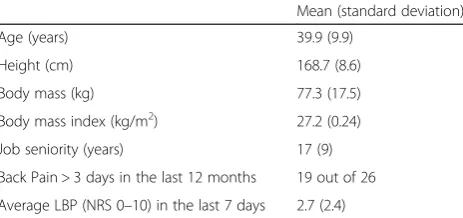
Table 1Characteristics of the vine-workers
Mean (standard deviation)
Age (years) 39.9 (9.9)
Height (cm) 168.7 (8.6)
Body mass (kg) 77.3 (17.5)
Body mass index (kg/m2) 27.2 (0.24)
Job seniority (years) 17 (9)
Back Pain > 3 days in the last 12 months 19 out of 26 Average LBP (NRS 0–10) in the last 7 days 2.7 (2.4)
between two adjacent locations is calculated from the dis-tance (d1) between L1 and L5. Then, we calculated the quarter of this distance (d2). A first column of 5 points was placed bilaterally at the distance (d2) from a fictive line joining L1 to L5. Then, a second column of 2 points was set bilaterally at 2 times the distance (d2) of L2 and L3 (Fig. 1). Binderup and colleagues [36] have shown that the distance L1-L5 is on average 14.3 ± 2.8 cm for adult men and 12.5 ± 0.9 cm for adult women. Based on these distances, we have developed eight PPT grids with a L1-L5 distance ranging from 11 to 14.5 cm (using step of 0.5 cm between two consecutive grids) [31]. The rater palpated the lumber spinal process L1 and L5 and placed a mark on the skin with a pencil on those two locations. Then, the distance L1-L5 was measured to select the corre-sponding PPT grid. Once selected, the rater aligned the grid with the L1 and L5 marks on the skin and started the assessments. The use of the designed grid results in a gain of time of approx. 20 min without alterations of the gain in spatial information.
Data analysis
PPT measurements, intraclass correlation coefficients (ICC) and standard error of measurement (SEM) values were normally distributed (Shapiro-Wilk normality test). The magnitude of the systematic difference in PPT between tri-als was estimated using 95 % confidence interval (CI) of the mean difference (MeanDiff) between trials 1–2, trials
1–3, trials 2–3 and calculated with the formula:
where, tn-1 corresponds to the value of t distribution
with n-1° of freedom where n corresponds to the num-ber of participants. A repeated measure analysis of vari-ance (RM-ANOVA) with the number of trials used as within subject factor was performed on (1) PPT, (2) ICC and (3) SEM values. In case of significant effect of the number of trials, a Tukey post-hoc for pair-wise compar-isons test was used to compare differences between trials. The relative and absolute reliability across the tri-als 1-2-3 were computed using ICC, SEM and minimal detectable change (MDC). The relative reliability was evaluated by calculating a 2-way fixed ICC2,1 (for
ab-solute agreement). ICC values were interpreted using the categories proposed previously in which an ICC between 0.00 and 0.20 is considered poor, 0.21–0.40 is fair, 0.41–0.60 is moderate, 0.61–0.80 is substantial, and 0.81–1.00 is almost perfect [44]. SEM is an abso-lute measure of the variability of the errors of meas-urement and allows making statement about the precision of test scores of individual examinees [45]. SEM has the same unit of measurement (kPa). According to Harvill [35], SEM was generated with the following formula:
SEM¼SDpffiffiffiffiffiffiffiffiffiffiffiffiffiffi1−ICC
where SD is the standard deviation of the scores from all workers and ICC the relative reliability. MDC gives the minimum value for which a difference can be considered as“real”. MDC was calculated with the formula:
MDC¼SEM1:96pffiffiffi2
Furthermore, Bland and Altman plots of the differ-ences between trials against their mean and limits of agreements (LOA) were used to assess the magnitude of
Fig. 1Schematic representation of the low back pressure pain threshold recording grid of the left (blank square) and right (black squares) erector spinae muscles. d1 represents the distance between the first (L1) and the fifth (L5) lumbar vertebrae. d2 equals one fourth of d1
CI¼MeanDifftn‐1
ffiffiffiffiffiffiffiffiffiffiffiffiffiffiffiffiffiffiffiffiffi
SDDiff n
s
[image:3.595.55.541.475.704.2]disagreement between trials. A difference between trials outside the LOA can be considered as a real change [46]. Additional analyses using gender and a median split for age, BMI and pain intensity were conducted for the PPTs from the overall low-back (mean PPTs of the 14 anatomical locations) to address the effects of modifier factors. A student t-test was then used to compare groups. All data analyses were performed with R 3.0.1 software. Results are presented as mean (SD) or (95 % confidence interval), unless otherwise indicated. p< 0.05 was considered significant.
Results
Intra-session relative and absolute reliability of PPT in the low back
The ICCs of the 14 anatomical locations and of the left, right and overall low-back (Pleft, Pright, Pall) were almost
perfect regardless of the conducted comparison (trials 1-2-3). Likewise the absolute reliability,.i.e. SEM did not change significantly (Table 2). The ICC, SEM and MDC following a median split were similar to the ones ob-tained for the entire population (Table 3).
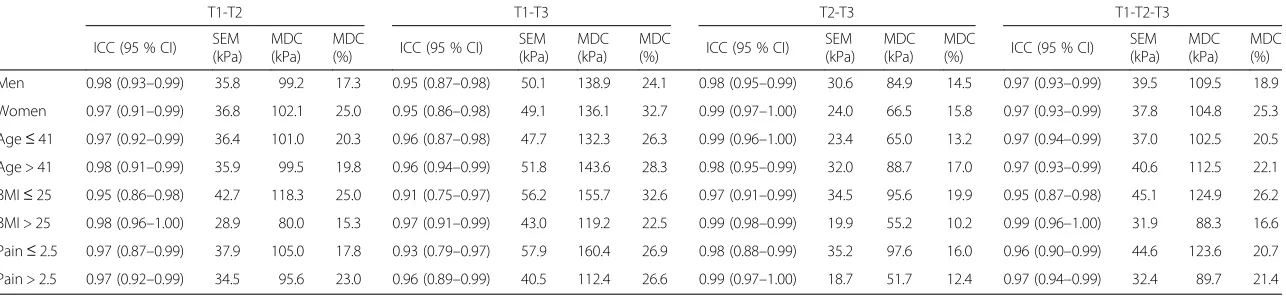
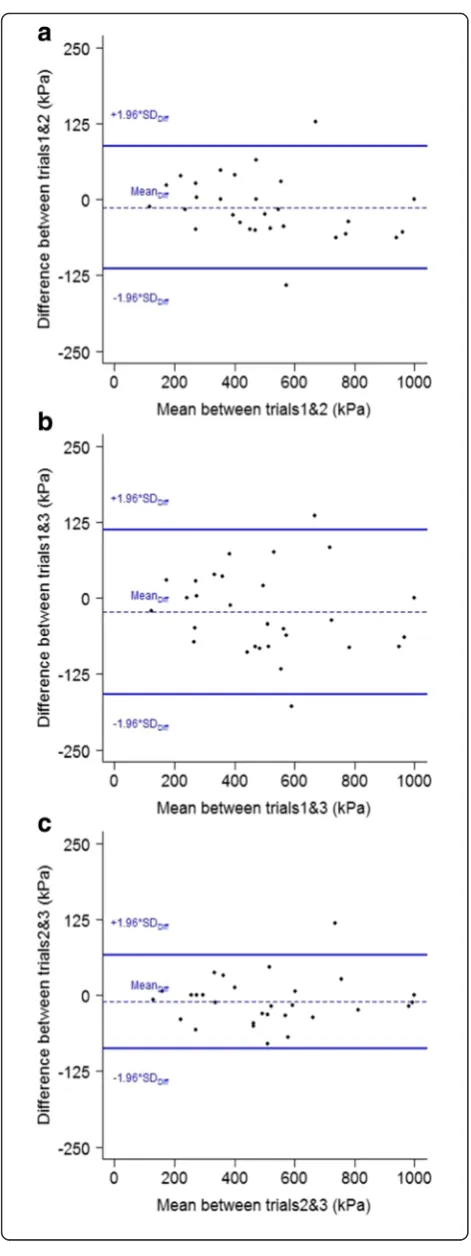
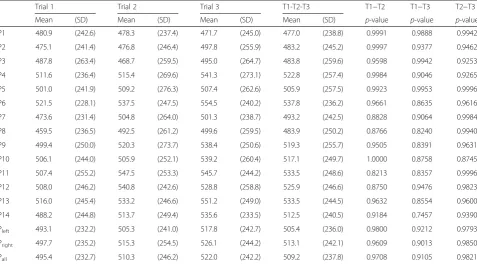
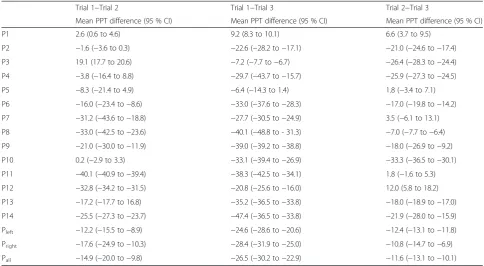
The visual analysis of the Bland-Altman plots (Fig. 2) suggested small measurement error whatever the com-parison considered between trials. These plots also showed that zero was included in the 95 % confidence interval and that no apparent systematic bias was present in the data.
Number of trials to ensure reliable measurements
The mean PPT values at each PPT location were not sig-nificantly different between trials regardless of the three conducted comparisons (trial 1 vs. trial 2, trial 1 vs. trial 3, trial 2 vs. trial 3), the p-values were ranged from 0.7457 to 1.000 (Tables 4, 5 and 6). Concerning the left, right and overall low-back (Pleft, Pright, Pall), p-values ranged from
0.8884 to 0.9994 (Tables 4 and 5). Lower PPT values were found for women compared with men for trial 1 and workers reporting pain intensity above 2.5 compared with workers reporting pain intensity below 2.5 for trial 2, trial 3 and the mean of the three trials (Table 5).
The comparison of means of ICC regardless of the conducted comparisons between trials showed statistical differences for Trials 1,3 vs. Trials 1,2 (p= 0.0171) and for Trials 2,3 vs. Trials 1,3 (p= 0.0009). The same analysis for SEM values further showed a statistical difference for the comparison Trials 2,3 vs. Trials 1,3 (p= 0.0122).
Discussion
The purposes of this study were (1) to evaluate the intra-session absolute and relative reliability as well as MDC values of PPT assessments in the low back region (2) to determine the number of trial recordings required to ensure reliable PPT measurements among
vine-workers and (3) to assess the effect of modifier factors such as gender, age, BMI and pain intensity on PPT reli-ability. This study particularly targeted a population at high risk of developing WMSDs i.e., vine-workers and used pressure pain sensitivity maps of the lumbar region.
Approximately 66 % of the workers reported episode of back pain lasting for more than 3 days within the last year. The low back pain intensity within the last 7 days was low. These self-reported values confirmed that low back pain is an issue among vine-workers. Compared to other workers, the PPT values of vine workers were close to those observed among cleaners and elderly ad-ministrative or nursing workers [37, 47].
The statistical power is defined as the probability of rejecting the null hypothesis, i.e., the probability of finding an absence of significant effect whereas one ac-tually exists [48]. In a reference study, Cohen [49] has reported that significant differences will have a power greater than 80 %. In our study population was small but sufficient to obtain substantial relative reliability values. An a posteriori calculation showed that the power achieved by all significant results was above 97 %. Still, significant differences might have been un-detected due to the relative small population size (lack of adequate power for detecting a true difference of a meaningful magnitude). The relative reliability was assessed over 14 lumbar locations and estimated for 3 distinct low back regions ((1) the left low back, (2) the right low back and (3) the overall low back). The first important result of this study using an electronic pres-sure algometer was that ICC ranged from 0.90 to 0.99 and were almost perfect regardless of the conducted comparisons (trial 1 vs. trial 2, trial 1 vs. trial 3, trial 2 vs. trial 3). This finding is in accordance with the exist-ing literature when PPTs were assessed in other ana-tomical locations. For instance, indeed, Nussbaum and Downes [50] assessed PPT relative reliability in the bi-ceps brachii muscle by means of a Fischer algometer using 3 consecutive trials over 3 consecutive days. Nussbaum and Downes [50] have also reported excel-lent reliability regardless of the comparison considered (trial 1 vs. trial 2, trial 2 vs. trial 3 and trials 1 vs. trial 2 vs. trial 3). In 2011, Walton and colleagues [35] have tested intra-rater reliability with 3 consecutive PPT measurements on 2 anatomical locations (trapezius and tibialis anterior) with an electronic pressure algometer and reported excellent ICC values (0.96 and 0.97). However, the authors have only compared the mean be-tween the second and the third PPT assessment. A comparison between two consecutive assessments is common in studies dealing with PPT but questions the rationale behind the fact that three PPT values are often recorded [33, 37, 51].
Table 2Intraclass correlation coefficients (ICC), standard error of measurement (SEM) and minimum detectable change (MDC) for pressure pain thresholds assessed over 14 locations (P1 to P14) over the low back region, for left and right side (Pleftand Pright) as well as overall low back (Pall) between the mean of the first and second trials (T1-T2), the
first and the third trials (T1-T3), the second and the third trials (T2-T3) and the means of the three trials (T1-T2-T3)
Trials T1-T2 T1-T3 T2-T3 T1-T2-T3
Points ICC (95 % CI) SEM
(kPa) MDC (kPa)
MDC
(%) ICC (95 % CI)
SEM (kPa)
MDC (kPa)
MDC
(%) ICC (95 % CI)
SEM (kPa)
MDC (kPa)
MDC
(%) ICC (95 % CI)
SEM (kPa)
MDC (kPa)
MDC (%)
P1 0.92 (0.84–0.96) 65.9 182.7 38.1 0.88 (0.77–0.94) 82.9 229.7 48.2 0.92 (0.84–0.96) 66.7 185.0 39.0 0.91 (0.84–0.95) 72.0 199.7 41.9
P2 0.95 (0.90–0.98) 53.5 148.4 31.2 0.91 (0.83–0.96) 72.1 199.8 41.1 0.94 (0.88–0.97) 60.1 166.5 34.2 0.94 (0.89–0.97) 62.2 172.4 35.7
P3 0.92 (0.84–0.96) 72.8 201.9 42.2 0.89 (0.78–0.95) 86.6 240.1 48.9 0.96 (0.91–0.98) 54.0 149.8 31.1 0.92 (0.86–0.96) 72.2 200.1 41.4
P4 0.92 (0.83–0.96) 71.9 199.4 38.8 0.88 (0.77–0.94) 86.7 240.4 45.7 0.95 (0.89–0.97) 61.9 171.6 32.5 0.92 (0.85–0.96) 74.0 205.1 39.2
P5 0.91 (0.83–0.96) 75.6 209.4 41.5 0.86 (0.71–0.93) 95.2 263.8 52.3 0.93 (0.86–0.97) 70.4 195.1 38.4 0.90 (0.83–0.95) 80.8 224.0 44.3
P6 0.92 (0.84–0.96) 67.3 186.5 35.2 0.88 (0.76–0.94) 81.0 224.6 41.8 0.95 (0.90–0.98) 53.0 147.0 26.9 0.92 (0.85–0.96) 67.9 188.2 35.0
P7 0.93 (0.85–0.97) 65.8 182.3 37.3 0.89 (0.78–0.95) 77.2 213.9 43.9 0.92 (0.83–0.96) 71.0 196.8 39.1 0.91 (0.85–0.96) 71.3 197.6 40.1
P8 0.90 (0.80–0.95) 77.5 214.7 45.1 0.89 (0.77–0.95) 82.6 228.9 47.7 0.95 (0.89–0.97) 59.4 164.7 33.2 0.91 (0.85–0.96) 73.7 204.2 42.2
P9 0.94 (0.87–0.97) 65.6 181.8 35.7 0.91 (0.81–0.96) 74.7 207.2 39.9 0.95 (0.90–0.98) 57.4 159.1 30.1 0.93 (0.88–0.97) 66.1 183.3 35.3
P10 0.94 (0.87–0.97) 60.7 168.3 33.3 0.93 (0.86–0.97) 64.9 180.0 34.4 0.94 (0.87–0.97) 63.4 175.8 33.6 0.94 (0.89–0.97) 62.9 174.4 33.7
P11 0.94 (0.86–0.97) 61.8 171.2 32.5 0.94 (0.85–0.97) 62.2 172.3 32.7 0.92 (0.85–0.96) 67.8 188.0 34.4 0.93 (0.88–0.97) 63.8 176.9 33.2
P12 0.93 (0.86–0.97) 62.5 173.2 33.0 0.91 (0.82–0.96) 75.1 208.0 40.1 0.90 (0.80–0.95) 77.7 215.5 40.3 0.92 (0.85–0.96) 71.9 199.2 37.9
P13 0.95 (0.89–0.98) 55.6 154.1 29.4 0.94 (0.87–0.97) 58.6 162.4 30.4 0.93 (0.85–0.97) 66.0 183.1 33.8 0.94 (0.89–0.97) 60.1 166.5 31.2
P14 0.94 (0.88–0.97) 59.2 164.0 32.7 0.93 (0.80–0.97) 65.0 180.2 35.2 0.95 (0.90–0.98) 51.1 141.7 27.0 0.94 (0.89–0.97) 58.6 162.4 31.7
Pleft 0.97 (0.94–0.99) 38.3 106.3 21.3 0.95 (0.90–0.98) 50.6 140.3 27.8 0.99 (0.97–0.99) 27.8 77.0 15.0 0.97 (0.95–0.99) 39.9 110.6 21.9
Pright 0.97 (0.94–0.99) 42.2 117.0 23.1 0.95 (0.89–0.98) 51.8 143.7 28.1 0.98 (0.95–0.95) 37.5 103.8 19.9 0.97 (0.94–0.98) 44.1 122.3 23.8
Pall 0.98 (0.95–0.99) 36.7 101.8 20.2 0.95 (0.90–0.98) 50.0 138.7 27.3 0.99 (0.97–0.99) 28.3 78.5 15.2 0.97 (0.95–0.99) 39.3 108.9 21.4
Balaguier
et
al.
BMC
Muscu
loskeletal
Disorders
(2016) 17:350
Page
5
of
Table 3Intraclass correlation coefficients (ICC), standard error of measurement (SEM) and minimum detectable change (MDC) for pressure pain thresholds assessed over the
overall low back Pall(representing the average of the 14 PPT assessments) between the mean of the first and second trials (T1-T2), the first and the third trials (T1-T3), the
second and the third trials (T2-T3) and the means of the three trials (T1-T2-T3) using gender and a median split for age, BMI and, pain intensity
T1-T2 T1-T3 T2-T3 T1-T2-T3
ICC (95 % CI) SEM
(kPa) MDC (kPa)
MDC
(%) ICC (95 % CI)
SEM (kPa)
MDC (kPa)
MDC
(%) ICC (95 % CI)
SEM (kPa)
MDC (kPa)
MDC
(%) ICC (95 % CI)
SEM (kPa)
MDC (kPa)
MDC (%)
Men 0.98 (0.93–0.99) 35.8 99.2 17.3 0.95 (0.87–0.98) 50.1 138.9 24.1 0.98 (0.95–0.99) 30.6 84.9 14.5 0.97 (0.93–0.99) 39.5 109.5 18.9
Women 0.97 (0.91–0.99) 36.8 102.1 25.0 0.95 (0.86–0.98) 49.1 136.1 32.7 0.99 (0.97–1.00) 24.0 66.5 15.8 0.97 (0.93–0.99) 37.8 104.8 25.3
Age≤41 0.97 (0.92–0.99) 36.4 101.0 20.3 0.96 (0.87–0.98) 47.7 132.3 26.3 0.99 (0.96–1.00) 23.4 65.0 13.2 0.97 (0.94–0.99) 37.0 102.5 20.5
Age > 41 0.98 (0.91–0.99) 35.9 99.5 19.8 0.96 (0.94–0.99) 51.8 143.6 28.3 0.98 (0.95–0.99) 32.0 88.7 17.0 0.97 (0.93–0.99) 40.6 112.5 22.1
BMI≤25 0.95 (0.86–0.98) 42.7 118.3 25.0 0.91 (0.75–0.97) 56.2 155.7 32.6 0.97 (0.91–0.99) 34.5 95.6 19.9 0.95 (0.87–0.98) 45.1 124.9 26.2
BMI > 25 0.98 (0.96–1.00) 28.9 80.0 15.3 0.97 (0.91–0.99) 43.0 119.2 22.5 0.99 (0.98–0.99) 19.9 55.2 10.2 0.99 (0.96–1.00) 31.9 88.3 16.6
Pain≤2.5 0.97 (0.87–0.99) 37.9 105.0 17.8 0.93 (0.79–0.97) 57.9 160.4 26.9 0.98 (0.88–0.99) 35.2 97.6 16.0 0.96 (0.90–0.99) 44.6 123.6 20.7
Pain > 2.5 0.97 (0.92–0.99) 34.5 95.6 23.0 0.96 (0.89–0.99) 40.5 112.4 26.6 0.99 (0.97–1.00) 18.7 51.7 12.4 0.97 (0.94–0.99) 32.4 89.7 21.4
Balaguier
et
al.
BMC
Muscu
loskeletal
Disorders
(2016) 17:350
Page
6
of
Farasyn and Meeusen [30] have calculated ICC of three consecutive PPT measurements on erector spinae muscles with a Fischer algometer on healthy volunteers and have also compared these PPT measurements by series of two and have reported excellent relative reli-ability. In contrast to our findings, the PPT of the initial trial has been reported to be significantly higher than the second and the third trial [30]. A similar finding has also been obtained by Lacourt and colleagues [52] that have suggested that the first trial measured using an electronic algometer should be considered as a practice trial and excluded from the analysis. Conversely, Chesterton and colleagues [32] and Nussbaum and Downes [50] using respectively an electronic and a Fisher algometer have reported that the highest ICC values are obtained when the mean score of three trials is used. Our results are different from the above men-tioned works in two aspects: (1) they showed that the mean of the three trials generated ICC and SEM values identical to those generated by 2 consecutive measure-ments (Trials 1–2 or Trials 1–3 or Trials 2–3); and (2) they showed that the first measurement did not generate higher PPT values than the second or third assessment. In other words, the first measurement does not necessarily need to be considered as a practice one and can thus be taken into account for analysis when assessing PPT values over the low-back region of vine-workers. However, this result is in accordance with a recent study assessing PPT over the low back of healthy individuals suggesting not to discard the first trial to report higher PPT reliability [31]. Furthermore, this finding highlights the importance of the experimental procedure, namely, the information given to the workers and the relevance of the familiarization PPT assessments on e.g. a remote body part like the tibialis an-terior muscle in the present study.
Although numerous studies have assessed the relative reliability of PPT, only few studies have investigated ac-tually reported the absolute reliability making difficult comparison among the existing literature. The reported SEMs were similar to what has been recently reported by Madeleine and colleagues [33] after a test-retest on the erector spinae muscle of young football players using an electronic algometer (i.e. 60.4 kPa). In other anatom-ical locations like the upper trapezius and tibialis anter-ior, Walton and colleagues [35] have obtained SEM ranged from 18.2 to 73.8 kPa while Chesterton and col-leagues [32] have found SEM of approx. 60 kPa for the first dorsal interosseous muscle (both using an electronic algometer). We found no statistical differences between
Fig. 2Bland and Altman analyses plotted for worker’s pressure pain threshold of the overall low back when the mean of the first and second trialsa, the first and third trialsband the second and third trialscare considered
[image:7.595.56.292.82.711.2]SEM regardless of the conducted comparisons between trials except for the comparison Trials 2–3 vs. Trials 1– 3 which suggests that the first assessment did not gener-ate an error superior to other two.
With respect to MDC, we notice that the reported values were regularly above 150 kPa which is still in accordance with existing literature. Fischer [53], Chesterton and col-leagues [32] and Madeleine and colcol-leagues [33] have also reported MDC values above 100 kPa. This implies a small sensitivity to change and that a change in PPT measure-ment can be masked by the measuremeasure-ment error regardless
of the absolute changes in PPT due to an ergonomics inter-vention [33].
Limits and perspectives
[image:8.595.59.537.121.385.2]This study presents several limitations. Although many studies have demonstrated that inter-rater [33, 49] and test-retest reliability are excellent on pain free subjects, our knowledge on population of vine-workers suffering from musculoskeletal pain is still limited. Individual factors like gender, age, BMI and the intensity of pain affect PPT [36, 54–56]. The studied population was
Table 4Mean (standard deviation: SD) pressure pain thresholds (kPa) assessed over 14 locations (P1 to P14) covering the low back region, for left and right side (Pleftand Pright) as well as overall low back (Pall) and level of significance (p-values) among trial. See
“Procedure to mark the 14 anatomical locations”for explanation concerning the locations of PPT assessments
Trial 1 Trial 2 Trial 3 T1-T2-T3 T1−T2 T1−T3 T2−T3
Mean (SD) Mean (SD) Mean (SD) Mean (SD) p-value p-value p-value
P1 480.9 (242.6) 478.3 (237.4) 471.7 (245.0) 477.0 (238.8) 0.9991 0.9888 0.9942
P2 475.1 (241.4) 476.8 (246.4) 497.8 (255.9) 483.2 (245.2) 0.9997 0.9377 0.9462
P3 487.8 (263.4) 468.7 (259.5) 495.0 (264.7) 483.8 (259.6) 0.9598 0.9942 0.9253
P4 511.6 (236.4) 515.4 (269.6) 541.3 (273.1) 522.8 (257.4) 0.9984 0.9046 0.9265
P5 501.0 (241.9) 509.2 (276.3) 507.4 (262.6) 505.9 (257.5) 0.9923 0.9953 0.9996
P6 521.5 (228.1) 537.5 (247.5) 554.5 (240.2) 537.8 (236.2) 0.9661 0.8635 0.9616
P7 473.6 (231.4) 504.8 (264.0) 501.3 (238.7) 493.2 (242.5) 0.8828 0.9064 0.9984
P8 459.5 (236.5) 492.5 (261.2) 499.6 (259.5) 483.9 (250.2) 0.8766 0.8240 0.9940
P9 499.4 (250.0) 520.3 (273.7) 538.4 (250.6) 519.3 (255.7) 0.9505 0.8391 0.9631
P10 506.1 (244.0) 505.9 (252.1) 539.2 (260.4) 517.1 (249.7) 1.0000 0.8758 0.8745
P11 507.4 (255.2) 547.5 (253.3) 545.7 (244.2) 533.5 (248.6) 0.8213 0.8357 0.9996
P12 508.0 (246.2) 540.8 (242.6) 528.8 (258.8) 525.9 (246.6) 0.8750 0.9476 0.9823
P13 516.0 (245.4) 533.2 (246.6) 551.2 (249.0) 533.5 (244.5) 0.9632 0.8554 0.9600
P14 488.2 (244.8) 513.7 (249.4) 535.6 (233.5) 512.5 (240.5) 0.9184 0.7457 0.9390
Pleft 493.1 (232.2) 505.3 (241.0) 517.8 (242.7) 505.4 (236.0) 0.9800 0.9212 0.9793
Pright 497.7 (235.2) 515.3 (254.5) 526.1 (244.2) 513.1 (242.1) 0.9609 0.9013 0.9850
Pall 495.4 (232.7) 510.3 (246.2) 522.0 (242.2) 509.2 (237.8) 0.9708 0.9105 0.9821
Table 5Mean (standard deviation: SD) pressure pain thresholds (kPa) assessed over the overall low back Pall (representing the average of the 14 PPT assessments) and level of significance (p-values) among trials using gender and a median split for age, body mass index (BMI) and, pain intensity. See“Procedure to mark the 14 anatomical locations”for explanation concerning the locations of PPT assessments
Trial 1 Trial 2 Trial 3 T1-T2-T3 T1−T2 T1−T3 T2−T3
Mean (SD) Mean (SD) Mean (SD) Mean (SD) p-value p-value p-value
Males 565.6* 230.0 580.7 238.2 587.3 231.9 587.3 231.9 0.9817 0.9627 0.9965
Females 403.3 201.1 413.7 223.8 428.1 228.3 415.0 212.5 0.9919 0.9547 0.9844
Age≤41 498.6 227.7 495.8 231.5 506.0 230.7 500.1 224.7 0.9994 0.9957 0.9919
Age > 41 486.7 238.7 516.6 262.9 526.6 258.1 510.0 247.8 0.9479 0.9092 0.9940
BMI≤25 470.6 197.9 474.2 204.9 484.0 187.9 476.3 192.3 0.9987 0.9823 0.9906
BMI > 25 513.7 259.7 535.3 277.7 545.8 283.7 531.6 267.9 0.9744 0.9449 0.9940
Pain≤2.5 572.7 230.5 606.0* 237.0 613.4* 227.3 597.4* 226.6 0.9236 0.8884 0.9961
Pain > 2.5 418.3 207.7 412.4 215.6 425.0 221.2 418.6 210.0 0.9968 0.9960 0.9858
* significant difference between groups (p< 0.05)
[image:8.595.56.539.585.724.2]composed of men and women, different age, BMI and pain intensity. Consequently, we conducted new analyses using a median split [54]. In line with literature, we found lower PPT values for women and workers report-ing pain above 2.5 on a VAS [36, 56]. However, the com-puted ICC, SEM and MDC remained similar to values found for the entire population. Future studies assessing PPTs values between pain-free workers and workers suf-fering from WMSDs adjusted for individual factors are thus warranted. Although no link between PPTs and risk of future low back pain and no PPT differences among workers with or without recurrent low back pain have been reported [47, 57], a larger sample size could help to establish a set of normative PPTs’ values for vine-workers [20]. Finally, since PPT is increasingly used to assess the effect of physical training on pain sensitivity [58] or to monitor the effectiveness of an intervention [33, 59, 60], PPT could be used as a pain biomarker among vine-workers to assess over time the effects of ergonomic interventions or physical training programs specifically designed to prevent WMSDs.
Conclusions
The present study showed PPTs assessed over the low back region of vine-workers have excellent relative and absolute reliability. Reliable PPT assessments can be equally achieved when using the mean of three PPT measurement or with
the first measurement. The relative and absolute reliability remained similar to the ones obtained for the entire popu-lation when taking gender, age, BMI and pain intensity in consideration but PPT were lower for women and in pres-ence of pain. The findings suggest that the assessment of PPT over the low back region of vine-workers can be used to measure the effects of interventions.
Acknowledgements
The authors are grateful to the Château Larose-Trintaudon (Saint-Laurent Médoc, France), the Château Pichon-Baron (Pauillac, France) and all the vineyard workers for their active participation. This work is also part of a larger pluri-disciplinary project called‘EWS’(Ergonomics at Work and in Sports). EWS project has benefited from support from the Blåtand French-Danish scientific cooperation program (Institut Français du Danemark), the Direction des Relations Territoriales et Internationales from Univ. Grenoble Alpes (France) and Aalborg University (Denmark). The authors would like to thank anonymous reviewers for helpful comments and suggestions.
Funding
The presented work is part of the joint PhD thesis of Romain Balaguier at Univ. Grenoble Alpes (France) and Aalborg University (Denmark), who was supported by a grant of the French Ministry of Higher Education and Research.
Availability of data and materials
The datasets generated during and/or analysed during the current study are not publicly available. Regarding data availability, ethical restrictions prevent deposition in a public repository, but data are available from the
corresponding author on reasonable request.
Authors’contributions
RB, PM and NV conceived the research idea. RB, PM and NV discussed and wrote the initial protocol as well as the design of the study. RB was responsible for
Table 6Mean difference between trials (95 % confidence interval (CI)) in pressure pain threshold (PPT, kPa) for the 14 locations (P1 to P14) covering the low back region, for left and right side (Pleftand Pright) as well as overall low back (Pall). See“Procedure to mark
the 14 anatomical locations”for explanation concerning the locations of PPT assessments
Trial 1−Trial 2 Trial 1−Trial 3 Trial 2−Trial 3
Mean PPT difference (95 % CI) Mean PPT difference (95 % CI) Mean PPT difference (95 % CI)
P1 2.6 (0.6 to 4.6) 9.2 (8.3 to 10.1) 6.6 (3.7 to 9.5)
P2 −1.6 (−3.6 to 0.3) −22.6 (−28.2 to−17.1) −21.0 (−24.6 to−17.4)
P3 19.1 (17.7 to 20.6) −7.2 (−7.7 to−6.7) −26.4 (−28.3 to−24.4)
P4 −3.8 (−16.4 to 8.8) −29.7 (−43.7 to−15.7) −25.9 (−27.3 to−24.5)
P5 −8.3 (−21.4 to 4.9) −6.4 (−14.3 to 1.4) 1.8 (−3.4 to 7.1)
P6 −16.0 (−23.4 to−8.6) −33.0 (−37.6 to−28.3) −17.0 (−19.8 to−14.2)
P7 −31.2 (−43.6 to−18.8) −27.7 (−30.5 to−24.9) 3.5 (−6.1 to 13.1)
P8 −33.0 (−42.5 to−23.6) −40.1 (−48.8 to - 31.3) −7.0 (−7.7 to−6.4)
P9 −21.0 (−30.0 to−11.9) −39.0 (−39.2 to−38.8) −18.0 (−26.9 to−9.2)
P10 0.2 (−2.9 to 3.3) −33.1 (−39.4 to−26.9) −33.3 (−36.5 to−30.1)
P11 −40.1 (−40.9 to−39.4) −38.3 (−42.5 to−34.1) 1.8 (−1.6 to 5.3)
P12 −32.8 (−34.2 to−31.5) −20.8 (−25.6 to−16.0) 12.0 (5.8 to 18.2)
P13 −17.2 (−17.7 to 16.8) −35.2 (−36.5 to−33.8) −18.0 (−18.9 to−17.0)
P14 −25.5 (−27.3 to−23.7) −47.4 (−36.5 to−33.8) −21.9 (−28.0 to−15.9)
Pleft −12.2 (−15.5 to−8.9) −24.6 (−28.6 to−20.6) −12.4 (−13.1 to−11.8)
Pright −17.6 (−24.9 to−10.3) −28.4 (−31.9 to−25.0) −10.8 (−14.7 to−6.9)
Pall −14.9 (−20.0 to−9.8) −26.5 (−30.2 to−22.9) −11.6 (−13.1 to−10.1)
drafting the paper. RB, PM and NV discussed the analyses. RB performed the measurements. RB, PM and NV analysed the data. All authors have read and commented on the draft version and approved the final version of the manuscript.
Competing interests
The authors declare that they have no competing interests.
Consent for publication
Not applicable.
Ethics approval and consent to participate
The study was conducted in accordance with the Declaration of Helsinki and approved by the national ethics committee (French society for independent-living technologies and gerontechnology). Written informed consent was obtained from all individual workers included in this study.
Author details
1Université Grenoble-Alpes, EA AGEIS, La Tronche, France.2Physical Activity and Human Performance group - SMI, Department of Health Science and Technology, Aalborg University, Aalborg, Denmark.3Institut Universitaire de France, Paris, France.
Received: 3 December 2015 Accepted: 10 August 2016
References
1. Bevan S, Quadrello T, McGee R, Mahdon M, Vavrosky A, Barham L. Fit for work-musculoskeletal disorders in the European workforce. The Work Foundation. 2009;1–143. http://www.theworkfoundation.com/ DownloadPublication/Report/224_Fit%20for%20Work%20pan-European%20report.pdf.
2. Schneider E, Irastorza X, Copsey S, Verjans M, Eeckelaert L, Broeck V. OSH in figures: Work-related musculoskeletal disorders in the EU - Facts and figures. Luxembourg: European Agency for Safety and Health at Work; 2010. 3. Punnett L. Musculoskeletal disorders and occupational exposures: How
should we judge the evidence concerning the causal association? Scand J Public Health. 2014;42 Suppl 13:49–58.
4. Andersen LL, Mortensen OS, Hansen JV, Burr H. A prospective cohort study on severe pain as a risk factor for long-term sickness absence in blue-and white-collar workers. Occup Environ Med. 2011;68(8):590–2.
5. Madeleine P, Lundager B, Voigt M, Arendt-Nielsen L. Sensory manifestations in experimental and work-related chronic neck-shoulder pain. Eur J Pain. 1998;2:251–60.
6. Andersson GB. Epidemiological features of chronic low-back pain. Lancet. 1999;354:581–5.
7. Freburger JK, Holmes GM, Agans RP, Jackman AM, Darter JD, Wallace AS, Castel LD, Kalsbeek WD, Carey TS. The rising prevalence of chronic low back pain. Arch Intern Med. 2009;169(3):251–8.
8. Hoy D, Brooks P, Blyth F, Buchbinder R. The epidemiology of low back pain. Best Pract Res Clin Rheumatol. 2010;24(6):769–81.
9. Bernard C, Courouve L, Bouée S, Adjémian A, Chrétien JC, Niedhammer I. Biomechanical and psychosocial work exposures and musculoskeletal symptoms among vineyard workers. J Occup Health. 2011;53:297–311. 10. Roquelaure Y, Dano C, Dusolier G, Fanello S, Penneau-Fontbonne D.
Biomechanical strains on the hand–wrist system during grapevine pruning. Inter Arch Occup Environ Health. 2002;75:591–5.
11. Chapman JR, Norvell DC, Hermsmeyer JT, Bransford RJ, DeVine J, McGirt MJ, Lee MJ. Evaluating common outcomes for measuring treatment success for chronic low back pain. Spine. 2011;36:S54–68.
12. Kuorinka I, Jonsson B, Kilbom A, Vinterberg H, Biering-Sørensen F, Andersson G, Jørgensen K. Standardised Nordic questionnaires for the analysis of musculoskeletal symptoms. Appl Ergon. 1987;18:233–7. 13. Mannion AF, Balagué F, Pellisé F, Cedraschi C. Pain measurement in patients
with low back pain. Nat Clin Pract Rheumatol. 2007;3:610–8.
14. Williamson A, Hoggart B. Pain: a review of three commonly used pain rating scales. J Clin Nurs. 2005;14:798–804.
15. Andersen H, Ge HY, Arendt-Nielsen L, Danneskiold-Samsøe B, Graven-Nielsen T. Increased trapezius pain sensitivity is not associated with increased tissue hardness. J Pain. 2010;11:491–9.
16. Baker SJ, Kelly NM, Eston RG. Pressure pain tolerance at different sites on the quadriceps femoris prior to and following eccentric exercise. Eur J Pain. 1997;1:229–33.
17. Ge HY, Fernández de las Peñas C, Madeleine P, Arendt-Nielsen L. Topographical mapping and mechanical pain sensitivity of myofascial trigger points in the infraspinatus muscle. Eur J Pain. 2008;12:859–65. 18. Gold JE, Punnett L, Katz JN. Pressure pain thresholds and musculoskeletal
morbidity in automobile manufacturing workers. Int Arch Occup Environ Health. 2006;79:128–34.
19. Ylinen J. Pressure algometry. Aust J Physiother. 2007;53(3):207. 20. Arendt-Nielsen L, Yarnitsky D. Experimental and clinical applications of
quantitative sensory testing applied to skin, muscles and viscera. J Pain. 2009;10:556–72.
21. Hogeweg J, Langereis M, Bernards A, Faber J, Helders P. Algometry. Measuring pain threshold and characteristics in healthy subjects. Scand J Rehabil Med. 1992;24:99–103.
22. Soee ABL, Thomsen LL, Tornoe B, Skov L. Reliability of four experimental mechanical pain tests in children. J Pain Res. 2013;6:103.
23. Persson A, Brogardh C, Sjolund BH. Tender or not tender: test-retest repeatability of pressure pain thresholds in the trapezius and deltoid muscles of healthy women. J Rehabil Med. 2004;36:17–27. 24. Jørgensen R, Ris I, Falla D, Juul-Kristensen B. Reliability, construct and
discriminative validity of clinical testing in subjects with and without chronic neck pain. BMC Musculoskelet Disord. 2014;15:408.
25. Pelfort X, Torres-Claramunt R, Sánchez-Soler JF, Hinarejos P, Leal-Blanquet J, Valverde D, Monllau JC. Pressure algometry is a useful tool to quantify pain in the medial part of the knee: An intra-and inter-reliability study in healthy subjects. Orthop Traumatol: Surg Res. 2015;101:559–63.
26. Ohrbach R, Gale EN. Pressure pain thresholds in normal muscles: reliability, measurement effects, and topographic differences. Pain. 1989;37:257–63. 27. Fabio Antonaci MD. Pressure algometry in healthy subjects: inter-examiner
variability. Scand J Rehab Med. 1998;30:3–8.
28. Vanderweeen L, Oostendorp RAB, Vaes P, Duquet W. Pressure algometry in manual therapy. Man Ther. 1996;1:258–65.
29. Paungmali A, Sitilertpisan P, Taneyhill K, Pirunsan U, Uthaikhup S. Intrarater reliability of pain intensity, tissue blood flow, thermal pain threshold, pressure pain threshold and lumbo-pelvic stability tests in subjects with low back pain. Asian J Sports Med. 2012;3:8.
30. Farasyn A, Meeusen R. Pressure pain thresholds in healthy subjects: influence of physical activity, history of lower back pain factors and the use of endermology as a placebo-like treatment. J Bodyw Mov Ther. 2003;7:53–61. 31. Balaguier R, Madeleine P and Vuillerme N. Is One Trial Sufficient to Obtain
Excellent Pressure Pain Threshold Reliability in the Low Back of Asymptomatic Individuals? A Test-Retest Study. PloS One. 2016; doi: 10.1371/journal.pone.0160866
32. Chesterton LS, Sim J, Wright CC, Foster NE. Interrater reliability of algometry in measuring pressure pain thresholds in healthy humans, using multiple raters. Clin J Pain. 2007;23:760–6.
33. Madeleine P, Hoej BP, Fernandez-de-Las-Peñas C, Rathleff MS, Kaalund S. Pressure pain sensitivity changes after use of shock-absorbing insoles among young soccer players training on artificial turf: a randomized controlled trial. J Orthop Sports Phys Ther. 2014;44:587–94.
34. Waller R, Straker L, O’Sullivan P, Sterling M, Smith A. Reliability of pressure pain threshold testing in healthy pain free young adults. Scand J Pain. 2015;9:38–41.
35. Walton D, MacDermid J, Nielson W, Teasell R, Chiasson M, Brown L. Reliability, standard error, and minimum detectable change of clinical pressure pain threshold testing in people with and without acute neck pain. J Orthop Sports Phys Ther. 2011;41:644–50.
36. Binderup AT, Arendt-Nielsen L, Madeleine P. Pressure pain sensitivity maps of the neck-shoulder and the low back regions in men and women. BMC Musculoskelet Disord. 2010;11:234.
37. Binderup AT, Holtermann A, Søgaard K, Madeleine P. Pressure pain sensitivity maps, self-reported musculoskeletal disorders and sickness absence among cleaners. Int Arch Occup Environ Health.
2011;84:647–54.
38. Falla D, Gizzi L, Tschapek M, Erlenwein J, Petzke F. Reduced task-induced variations in the distribution of activity across back muscle regions in individuals with low back pain. Pain. 2014;155:944–53.
39. Madeleine P, Lundager B, Voigt M, Arendt-Nielsen L. The effects of neck-shoulder pain development on sensory-motor interactions among female
workers in poultry and fish industry. A prospective study. Int Arch Occup Environ Health. 2003;76:39-49.
40. Fernández-de-las-Peñas C, Madeleine P, Martínez-Perez A, Arendt-Nielsen L, Jiménez-García R, Pareja JA. Pressure pain sensitivity maps reveal bilateral hyperalgesia of the hands in patients with unilateral carpal tunnel syndrome. Arthritis Care Res. 2010;62:1055–64.
41. Nie H, Graven-Nielsen T, Arendt-Nielsen L. Spatial and temporal summation of pain evoked by mechanical pressure stimulation. Eur J Pain. 2009;13:592–9. 42. Andersen CH, Andersen LL, Zebis MK, Sjøgaard G. Effect of scapular function
training on chronic pain in the neck/shoulder region: a randomized controlled trial. J Occup Rehabil. 2014;24(2):316–24.
43. Nielsen PK, Andersen LL, Olsen HB, Rosendal L, Sjøgaard G, Søgaard K. Effect of physical training on pain sensitivity and trapezius muscle morphology. Muscle Nerve. 2010;41(6):836–44.
44. Landis JR, Koch GG. An application of hierarchical kappa-type statistics in the assessment of majority agreement among multiple observers. Biometrics. 1977;33:363–74.
45. Harvill LM. Standard error of measurement. Educ Meas: Issues Pract. 1991;10:33–41.
46. Bland JM, Altman DG. Statistical methods for assessing agreement between two methods of clinical measurement. Lancet. 1986;327(8476):307–10. 47. Schenk P, Laeubli T, Klipstein A. Validity of pressure pain thresholds in female workers with and without recurrent low back pain. Eur Spine J. 2007;16:267–75.
48. Sullivan GM, Feinn R. Using effect size-or why the P value is not enough? J Grad Med Educ. 2012;4(3):279–82.
49. Cohen J. Things I, have learned (so far). Am Psychol. 1990;45(12):1304. 50. Nussbaum EL, Downes L. Reliability of clinical pressure-pain algometric
measurements obtained on consecutive days. Phys Ther. 1998;78:160–9. 51. Binderup AT, Arendt-Nielsen L, Madeleine P. Pressure pain threshold
mapping of the trapezius muscle reveals heterogeneity in the distribution of muscular hyperalgesia after eccentric exercise. Eur J Pain. 2010;14:705–12. 52. Lacourt TE, Houtveen JH, van Doornen LJ. Experimental pressure-pain
assessments: test–retest reliability, convergence and dimensionality. Scand J Pain. 2012;3:31–7.
53. Fischer AA. Application of pressure algometry in manual medicine. J Man Med. 1990;5:145–50.
54. De Rui M, Marini I, Bartolucci ML, Inelmen EM, Bortolotti F, Manzato E, Gatto MR, Ghecchi L, Sergi G. Pressure pain threshold of the cervico-facial muscles in healthy elderly people: the role of gender, age and dominance. Gerodontology. 2015;32(4):274–80.
55. van Leeuwen RJ, Szadek K, de Vet H, Zuurmond W, Perez R. Pain pressure threshold in the region of the sacroiliac joint in patients diagnosed with sacroiliac joint pain. Pain Physician. 2016;19(3):147–54.
56. Ge HY, Vangsgaard S, Omland O, Madeleine P, Arendt-Nielsen L: Mechanistic experimental pain assessment in computer users with and without chronic musculoskeletal pain. BMC Musculoskelet Disord. 2014;15. 57. O’Neill S, Kjær P, Graven-Nielsen T, Manniche C, Arendt-Nielsen L. Low
pressure pain thresholds are associated with, but does not predispose for, low back pain. Eur Spine J. 2011;20:2120–5.
58. Ylinen J, Takala EP, Kautiainen H, Nykänen M, Häkkinen A, Pohjolainen T, Karppi SL, Airaksinen O. Effect of long-term neck muscle training on pressure pain threshold: A randomized controlled trial. Eur J Pain. 2005;9:673–673. 59. Ruiz-Sáez M, Fernández-de-las-Peñas C, Blanco CR, Martínez-Segura R,
García-León R. Changes in pressure pain sensitivity in latent myofascial trigger points in the upper trapezius muscle after a cervical spine manipulation in pain-free subjects. J Manipulative Physiol Ther. 2007;30:578–83.
60. Murray M, Lange B, Nørnberg BR, Søgaard K, Sjøgaard G. Specific exercise training for reducing neck and shoulder pain among military helicopter pilots and crew members: a randomized controlled trial protocol. BMC Musculoskelet Disord. 2015;16:198.
• We accept pre-submission inquiries
• Our selector tool helps you to find the most relevant journal
• We provide round the clock customer support
• Convenient online submission
• Thorough peer review
• Inclusion in PubMed and all major indexing services
• Maximum visibility for your research
Submit your manuscript at www.biomedcentral.com/submit