R E S E A R C H A R T I C L E
Open Access
Prevalence of osteoporosis in the Italian
population and main risk factors: results
of
BoneTour
Campaign
Loredana Cavalli
1, Andrea Guazzini
2, Luisella Cianferotti
1, Simone Parri
1, Tiziana Cavalli
1, Alessia Metozzi
1,
Francesca Giusti
1, Caterina Fossi
1, Dennis M. Black
3and Maria Luisa Brandi
1*Abstract
Background:BoneTouris a campaign conducted throughout the Italian territory for the assessment of Italian people bone status and for the prevention of osteoporosis.
Methods:A total of 7305 sequential subjects of both sexes were screened, collecting clinical data through the FRAX™questionnaire, and measuring heel bone stiffness by Quantitative Ultrasonography (QUS). The 10-year risk for hip and major osteoporotic fractures was calculated taking into account personal or family history of fragility fracture, smoking, alcohol abuse, rheumatoid arthritis, prolonged steroids assumption. Additional risk factors were evaluated, including early menopause, poor sunlight exposure, low dietary calcium intake, physical inactivity, number of pregnancies, months of lactation, tobacco cigarettes smoked per year, specific causes of secondary osteoporosis. Through a correlation study, the influence of each factor on the development of osteoporosis was analyzed.
Results:As many as 18 % of women suffer from osteoporosis, as defined by QUS T-score. The calculation of FRAX™ confirmed the weight of the already known risk factors. The correlation study revealed the significance of some additional factors, such as hyperthyroidism, nephrolithiasis, Crohn disease, ulcerative colitis, celiac disease, poor sun exposure, and oophorectomy before age 50.
Conclusions:The high prevalence of secondary osteoporosis in the Italian population clearly indicates the importance of additional risk factors not yet included in the FRAX™algorithm, for which preventive measures should be considered. Screening campaigns may allow both early diagnosis and access to treatment.
Keywords:Osteoporosis, Fracture, Prevention, Epidemiology, Risk factors, FRAX, QUS
Background
Osteoporosis, estimated to affect 22 millions of women and 5.5 millions of men in the European Union in 2010 [1], is known asthe silent epidemic because it does not manifest until a fracture occurs. Despite advances in risk assessment and treatment, osteoporosis is still often either not recognized or untreated.
FRAX™ is a widely used risk algorithm, developed by the World Health Organization to predict the 10-year risk of hip and major osteoporotic fractures [2–4]. FRAX
includes a concise set of clinical risk factors (e.g., Age, sex, BMD, etc.) but dietary factors and other chronic dis-eases potentially affecting bone mass and quality are not included. In case DXA BMD is not available, FRAX can be calculated based on non- BMD risk factors only.
In many parts of the world, in some countries and in some less well-served areas, DXA is not easily available and therefore some alternative measurements of bone strength, i.e., ultrasound, have been suggested as a practical alterna-tive to help raise awareness of the disease [5–9].
In this report, the results of a large epidemiological campaign conducted via a mobile van carried out throughout Italy in 2011 and 2012, called “BoneTour”, are described.
* Correspondence:marialuisa.brandi@unifi.it
1Department of Surgery and Translational Medicine, University of Florence,
Viale Pieraccini, 6-50139 Florence, Italy
Full list of author information is available at the end of the article
There are 3 principal aims of BoneTour campaign using a motor home: i) to carry out a population screening in order to identify individuals at risk for osteoporosis and to educate them; ii) to obtain National epidemiological results that could enable the development of prevention measures aimed at groups at risk and iii) to correlate individual risk factors with bone quality, assessed by Quantitative Ultra-sonography (QUS), as well as previous fragility fractures.
Methods
BoneTour campaign and recruitment of participants
Data deriving from a screening campaign promoted by Fondazione Italiana Ricerca Malattie Ossee (F.I.R.M.O.), a non-profit organization devoted to the study of bone diseases, is reported in this paper. The study was ap-proved by the Internal Review Board of the University of Florence. Subjects of both sexes were recruited on a voluntary basis in major Italian cities as representative of the different regions of belonging. Thus, no age restric-tions or recruitment criteria were applied.
The evaluation was carried out on May-June 2011 and on September 2012 in a mobile ambulatory (motor home) with a staff composed by physicians, technicians and nutri-tionists. Subjects were administered the“One Minute Risk Test” questionnaire (https://www.iofbonehealth.org/sites/ default/files/PDFs/2012-IOF_risk_test-english[WEB].pdf ), including FRAX™risk factors and additional questions on different causes of secondary osteoporosis (i.e., hyperthy-roidism, calcium nephrolithiasis, celiac disease, Crohn’s disease, and ulcerative colitis). Further information regard-ing number of pregnancies, months of lactation, age of menopause, and quantified cigarette smoking (pack-years) were also collected.
Once the individual risk of fracture was established, the medical staff handed out practical advice for the pre-vention of osteoporosis. After the obtainment of an in-formed consent, data were anonymously reported into an electronic database to allow pooled analysis.
Assessments and measurements
Quantitative ultrasonometry (QUS) was performed by Achilles Insight (Lunar, GE), a portable, easy-to-operate, radiation-free device suitable for low-cost, rapid, large screening of bone status (bone density, structure and composition) [10, 11]. Since many studies demonstrated the association of QUS results with BMD measured by DXA, both in men and post-menopausal women, as well as QUS effectiveness in identifying osteoporotic subjects and estimating their risk of femoral fracture, subjects have been classified as normal, osteopenic and osteopor-otic according to ultrasound T-score (> −1, between −1 and−2.4, and≤ −2.5, respectively) [12–16].
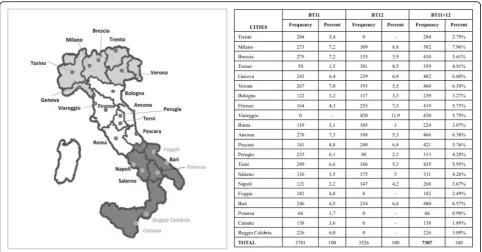
The 2011 BoneTour (BT11) and the 2012 BoneTour (BT12) campaigns were carried out in 3779 individuals
(belonging to 20 cities) and in 3526 subjects (17 cities) respectively (Fig. 1). In BT12, weight and height were also measured by a mechanical scale with an altimeter aboard the motor home and used to calculate the body mass index (BMI).
The questionnaire investigated the risk factors for which numerous evidence support premenopausal and peri-menopausal women screening: prolonged use of corti-costeroids (≥5 mg of prednisone for 3 months or longer), protracted amenorrhea, rheumatoid arthritis (RA), and prolonged hyperthyroidism [17, 18]. As regards hyper-parathyroidism (HPT), this being a condition often un-recognized by the patient, we investigated the history of recurrent and/or familiar nephrolithiasis, which can be as-sociated with loss of BMD even when not due to HPT [19]. In the assessment ofmodifiable risk factors, some data were provided through a dichotomous question (presence of diseases affecting bone mass, history of oophorectomy before age 50). Other quantitative data were collected in the form of continuous variable, such as BMI, age of menopause, estimated average number of cigarettes smoked per year (reported as “pack-years”: the average number of daily cigarette multiplied by the number of years of smoking). Further data derived from a question detecting the overcoming of a threshold for a healthy be-havior: “Is your daily level of physical activity less than 30 min per day?”; “Do you regularly drink more than 2 units of alcohol a day?”;“Do you spend less than 10 min per day exposed to sunlight?”
Data analysis
The results of the survey were pooled for the epide-miological macroarea analysis, since the local samples were homogeneous in size and characteristics. These data were afterwards examined in order to calculate the 10-years risk for hip B) and major osteoporotic fractures (FRAX-A), by considering the abovementioned specific risk factors associated with weight and height values [20]. FRAX-A and FRAX-B were calculated for each subject by entering in the algorithm FRAX® version 3.7 Italy model the follow-ing data: age, sex, weight (kg), height (cm), previous frac-ture, parent hip fracfrac-ture, smoking, glucocorticoids, RA, secondary osteoporosis, and alcohol intake ≥3 units/day. Results are expressed as the mean ± standard deviation.
distribution allowed the use of parametric tests as infer-ential statistics, the process of drawing conclusions from a dataset, which is subject to random variation. Finally, the analysis of Pearson correlations was carried out be-tween continuous risk factors and clinical quantitative parameters assumed as describing bone health status (FRAX-A, FRAX-B, Z-score and T-Score). As a general procedure, the continuous observables have been dis-cretized properly according to the adopted statistical analysis, if the technical requirements were fulfilled. In order to satisfy the conditions required from the para-metric statistics taking into account the dimension of the study, a Monte Carlo method of Bootstrap was ap-plied for each variable in order to extract subsamples of comparable size, followed by the execution of the t test or of the ANOVA test.
Results
Study group
The demographic features of the experimental sample (BT11 and BT12, total range n=7305 subjects) are pre-sented in Tables 1 and 2 with respect of their gender-and age-related frequency distribution.
Females largely outnumbered males in the whole sam-ple (n=6114, 83,7 %, versusn=1191, 16,3 %).
Regarding age, the sample showed a Gaussian distribu-tion. Mean subject age was 58.3 ± 12.4 years (range 17–97), in particular 57.6 ± 12.0 for women (range 17–97) and 62.0 ± 13.6 for men (range 22–92). In the female group, 3691 patients (60.4 %) were postmenopausal.
The percentage of women and men was comparable in the two groups (women: 82.0 % in BT11 vs 85.5 % in BT12; men: 18.0 % in BT11 vs 14.5 % in BT12).
Herein, the analysis of the whole group will be described.
Bone status according to calcaneus ultrasonography
Regarding BMD, 18.1 % of the study group resulted osteoporotic (age 65.3 ± 11.0, range 22–97), 42.1 % osteopenic (age 59.4 ± 11.3, range 19–89), while 39.8 % normal (age 54.1 ± 12.6, range17-92).
In the women subgroup, 20.2 % were osteoporotic (age 65.2 ± 110.7, range 22–97), 44.1 % osteopenic (age 58.7 ± 11.0, range 19–89), and 35.7 % normal (age 52.0 ± 11.5, range 17–85).
In the men subgroup 7.4 % were osteoporotic (age 67.4 ± 14.1, range 25–92), 32.4 % osteopenic (age 63.9 ± 12.7, range 25–89), and 60.2 % normal (age 60.6 ± 13.5, range 22–92).
Prevalence of risk factors for osteoporosis
[image:3.595.57.540.87.339.2]18.3 % of the sample reported a previous fragility fracture.
The mean age of menopause was 49.3 ± 10.1 years. Among the group of postmenopausal women (n=3691), 23.9 % had premature ovarian failure (i.e., age of meno-pause≤45 years and negative history for hormonal re-placement therapy).
As regards physical exercise, 19 % of the subjects performed inadequate physical activity (i.e., less than 30 min a day).
As much as 38 % of the sample reported current or prior tobacco smoking habit, in particular men. The prevalence of this risk factor was also assessed for sub-groups, with a statistically significant difference according to sex (men 52.1 % women 35.1 %,χ2= 121.9,p < 0.01).
Regarding alcohol intake, sun exposure and dairy products assumption, 4.4 % of all the interviewees con-sumed more than 2 units a day of alcoholic drinks, 24.3 % expose to sunlight for less than ten minutes a day, 15.8 % avoided dairy products without even assum-ing any calcium supplement.
Recurrent nephrolithiasis, hyperthyroidism, celiac dis-ease, ulcerative colitis and Crohn’s disease were assessed both singularly and pooled together under the name of “secondary osteoporosis”. As a whole, secondary osteo-porosis causes were reported by 3.9 % of the sample (2.7 % men and 4.1 % women).
[image:4.595.304.538.144.279.2] [image:4.595.57.288.151.724.2]We also took into account the number of behavioral risk factors concurrent in the same subject, finding that, on average, each person has 2.6 ± 1.2 total risk factors (habits), with an average for the modifiable factors of 1.5 ± 1.0. Moreover, the distribution appeared as not “Normal” (i.e., skewedness and kurtosis are not within the range [1, −1]); in particular, a negative exponential-like trend was observed, making the concurrence of
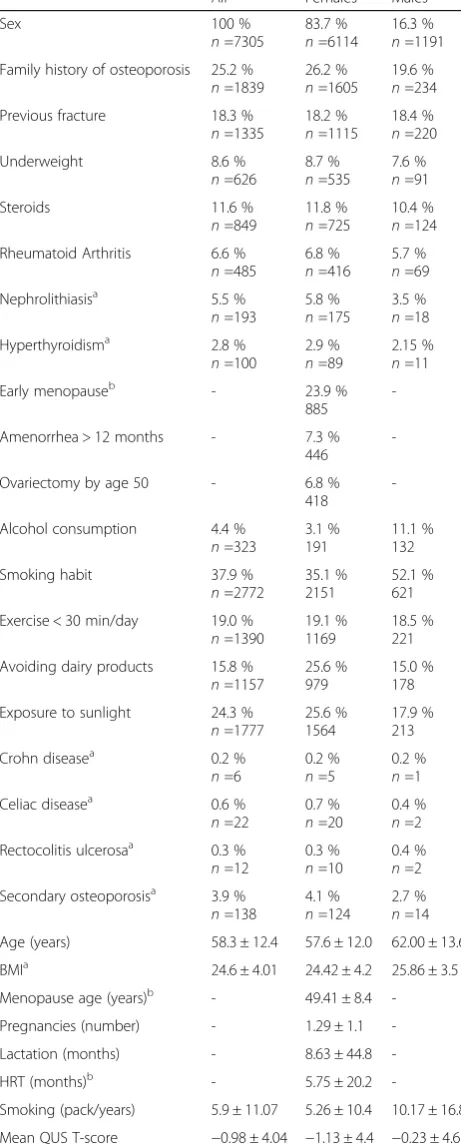
Table 1Description of the screened population: prevalence of
nominal risk factors in the general screened population and by sex (as expressed in % and absolute numbernof the total subjects, of females and of males respectively) scalar parameters (mean ± SD)
All Females Males
Sex 100 %
n=7305
83.7 % n=6114
16.3 % n=1191 Family history of osteoporosis 25.2 %
n=1839
26.2 % n=1605
19.6 % n=234
Previous fracture 18.3 %
n=1335
18.2 % n=1115
18.4 % n=220
Underweight 8.6 %
n=626
8.7 % n=535
7.6 % n=91
Steroids 11.6 %
n=849
11.8 % n=725
10.4 % n=124 Rheumatoid Arthritis 6.6 %
n=485
6.8 % n=416
5.7 % n=69
Nephrolithiasisa 5.5 %
n=193
5.8 % n=175
3.5 % n=18
Hyperthyroidisma 2.8 %
n=100
2.9 % n=89
2.15 % n=11
Early menopauseb - 23.9 %
885
-Amenorrhea > 12 months - 7.3 %
446
-Ovariectomy by age 50 - 6.8 %
418
-Alcohol consumption 4.4 % n=323
3.1 % 191
11.1 % 132
Smoking habit 37.9 %
n=2772
35.1 % 2151
52.1 % 621
Exercise < 30 min/day 19.0 % n=1390
19.1 % 1169
18.5 % 221
Avoiding dairy products 15.8 % n=1157
25.6 % 979
15.0 % 178
Exposure to sunlight 24.3 % n=1777
25.6 % 1564
17.9 % 213
Crohn diseasea 0.2 %
n=6
0.2 % n=5
0.2 % n=1
Celiac diseasea 0.6 %
n=22
0.7 % n=20
0.4 % n=2 Rectocolitis ulcerosaa 0.3 %
n=12
0.3 % n=10
0.4 % n=2 Secondary osteoporosisa 3.9 %
n=138
4.1 % n=124
2.7 % n=14 Age (years) 58.3 ± 12.4 57.6 ± 12.0 62.00 ± 13.6
BMIa 24.6 ± 4.01 24.42 ± 4.2 25.86 ± 3.5
Menopause age (years)b - 49.41 ± 8.4
-Pregnancies (number) - 1.29 ± 1.1
-Lactation (months) - 8.63 ± 44.8
-HRT (months)b - 5.75 ± 20.2
-Smoking (pack/years) 5.9 ± 11.07 5.26 ± 10.4 10.17 ± 16.8
Mean QUS T-score −0.98 ± 4.04 −1.13 ± 4.4 −0.23 ± 4.6
Table 1Description of the screened population: prevalence of nominal risk factors in the general screened population and by sex (as expressed in % and absolute numbernof the total subjects, of females and of males respectively) scalar parameters (mean ± SD)(Continued)
Mean QUS Z-score 0.17 ± 2.01 0.07 ± 1.9 0.67 ± 3.2
Mean FRAX-A scorea(% value) 7.87 ± 7.09 8.22 ± 8.3 5.79 ± 4.6
Mean FRAX-Bascore (% value) 3.04 ± 5.09 3.14 ± 6.2 2.43 ± 3.7
Prevalence of QUS T-score <−2.5
18,1 % 1212 20,2 % 1128 7,4 % 84 Prevalence of QUS Z-score <−2.5
1,1 % 76 1 % 58 1,6 % 18 Prevalence of FRAX-A score <10 %
77 % 2710 75,4 % 2266 87,1 % 444 Prevalence of FRAX-B score <3 %
75,8 % 2653 75,7 % 2264 76,3 % 389 a
As calculated in BT12 group (subset ofn=3526 subjects);b
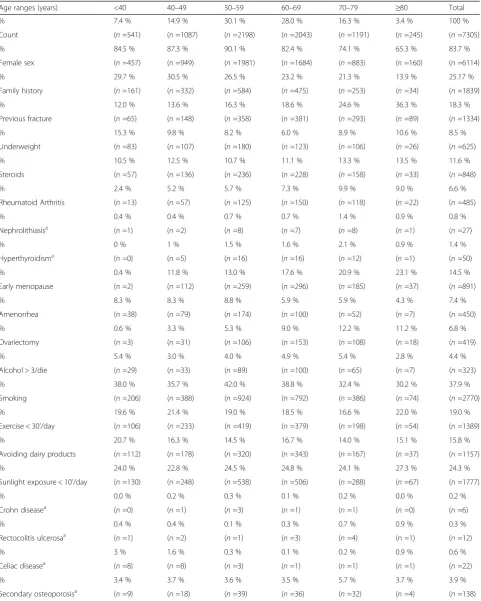
Table 2Distribution of nominal risk factors for the considered age ranges the general screened population and by sex (as expressed in % of the age group and absolute number,n, of subjects)
Age ranges (years) <40 40–49 50–59 60–69 70–79 ≥80 Total
% 7.4 % 14.9 % 30.1 % 28.0 % 16.3 % 3.4 % 100 %
Count (n=541) (n=1087) (n=2198) (n=2043) (n=1191) (n=245) (n=7305)
% 84.5 % 87.3 % 90.1 % 82.4 % 74.1 % 65.3 % 83.7 %
Female sex (n=457) (n=949) (n=1981) (n=1684) (n=883) (n=160) (n=6114)
% 29.7 % 30.5 % 26.5 % 23.2 % 21.3 % 13.9 % 25.17 %
Family history (n=161) (n=332) (n=584) (n=475) (n=253) (n=34) (n=1839)
% 12.0 % 13.6 % 16.3 % 18.6 % 24.6 % 36.3 % 18.3 %
Previous fracture (n=65) (n=148) (n=358) (n=381) (n=293) (n=89) (n=1334)
% 15.3 % 9.8 % 8.2 % 6.0 % 8.9 % 10.6 % 8.5 %
Underweight (n=83) (n=107) (n=180) (n=123) (n=106) (n=26) (n=625)
% 10.5 % 12.5 % 10.7 % 11.1 % 13.3 % 13.5 % 11.6 %
Steroids (n=57) (n=136) (n=236) (n=228) (n=158) (n=33) (n=848)
% 2.4 % 5.2 % 5.7 % 7.3 % 9.9 % 9.0 % 6.6 %
Rheumatoid Arthritis (n=13) (n=57) (n=125) (n=150) (n=118) (n=22) (n=485)
% 0.4 % 0.4 % 0.7 % 0.7 % 1.4 % 0.9 % 0.8 %
Nephrolithiasisa (
n=1) (n=2) (n=8) (n=7) (n=8) (n=1) (n=27)
% 0 % 1 % 1.5 % 1.6 % 2.1 % 0.9 % 1.4 %
Hyperthyroidisma (
n=0) (n=5) (n=16) (n=16) (n=12) (n=1) (n=50)
% 0.4 % 11.8 % 13.0 % 17.6 % 20.9 % 23.1 % 14.5 %
Early menopause (n=2) (n=112) (n=259) (n=296) (n=185) (n=37) (n=891)
% 8.3 % 8.3 % 8.8 % 5.9 % 5.9 % 4.3 % 7.4 %
Amenorrhea (n=38) (n=79) (n=174) (n=100) (n=52) (n=7) (n=450)
% 0.6 % 3.3 % 5.3 % 9.0 % 12.2 % 11.2 % 6.8 %
Ovariectomy (n=3) (n=31) (n=106) (n=153) (n=108) (n=18) (n=419)
% 5.4 % 3.0 % 4.0 % 4.9 % 5.4 % 2.8 % 4.4 %
Alcohol > 3/die (n=29) (n=33) (n=89) (n=100) (n=65) (n=7) (n=323)
% 38.0 % 35.7 % 42.0 % 38.8 % 32.4 % 30.2 % 37.9 %
Smoking (n=206) (n=388) (n=924) (n=792) (n=386) (n=74) (n=2770)
% 19.6 % 21.4 % 19.0 % 18.5 % 16.6 % 22.0 % 19.0 %
Exercise < 30’/day (n=106) (n=233) (n=419) (n=379) (n=198) (n=54) (n=1389)
% 20.7 % 16.3 % 14.5 % 16.7 % 14.0 % 15.1 % 15.8 %
Avoiding dairy products (n=112) (n=178) (n=320) (n=343) (n=167) (n=37) (n=1157)
% 24.0 % 22.8 % 24.5 % 24.8 % 24.1 % 27.3 % 24.3 %
Sunlight exposure < 10’/day (n=130) (n=248) (n=538) (n=506) (n=288) (n=67) (n=1777)
% 0.0 % 0.2 % 0.3 % 0.1 % 0.2 % 0.0 % 0.2 %
Crohn diseasea (
n=0) (n=1) (n=3) (n=1) (n=1) (n=0) (n=6)
% 0.4 % 0.4 % 0.1 % 0.3 % 0.7 % 0.9 % 0.3 %
Rectocolitis ulcerosaa (
n=1) (n=2) (n=1) (n=3) (n=4) (n =1) (n=12)
% 3 % 1.6 % 0.3 % 0.1 % 0.2 % 0.9 % 0.6 %
Celiac diseasea (
n=8) (n=8) (n=3) (n=1) (n=1) (n=1) (n=22)
% 3.4 % 3.7 % 3.6 % 3.5 % 5.7 % 3.7 % 3.9 %
Secondary osteoporosisa (
n=9) (n=18) (n=39) (n=36) (n=32) (n=4) (n=138)
a
factors in the same person less probable when the num-ber of factors increased. Thus, the occurrence of mul-tiple risk factors in the same person was a rare event. Only the 0.2 % of the sample examined showed no risk factors at all, while the 31.5 % of the sample had no modifiable risk factors.
FRAX was calculated in the BT12 group, comprising 3526 people, in which body weight and height were known. Mean BMI value resulted 24.6 ± 4.01. Eighty-one out of 3526 subjects had a BMI compatible with under-weight, a known risk factor for osteoporosis. Indeed, the 78.6 % of the underweight subjects showed reduced (i.e., T-score <−1) bone stiffness independently of other risk factors; in particular, 30 % of them showed a QUS T-score under −2.5, 48.6 % subjects had osteopenia, and only 21.4 % had a normal T-score.
The average value reported with respect to the FRAX-A was 7.87 ± 7.9, while the FRAX-B resulted of 3.04 ± 5.9. In the female group FRAX-A and FRAX-B were higher than males (FRAX-A: 8.22 ± 8.3 and 5.79 ± 4.6, in women and men, respectively; FRAX-B: 3.14 ± 6.2 and 2.43 ± 3.7 in women and men, respectively). Both the distributions showed a right long tail, indicating how the majority of the sample obtained a score near zero. Thus, 33 % of the BT12 sample (24.6 % of women and 12.9 % of men) re-ported FRAX-A >10 %, while 24.2 % of BT12 (24.3 % of women and 23.7 % of men) had a FRAX-B >3 %.
Analysis of the results according to gender, previous fracture and age
A gender analysis was performed for risk factors. The prevalence of smoking habit resulted signifi-cantly higher among men (53.2 %) than women (39.1 %) (Chi2= 35.819, p< 0.01). Similarly, the preva-lence of declared excessive alcohol consumption appeared strongly different between males (12.3 %) and females (3.1 %) (Chi2= 88.303,p< 0.01).
With respect to low sun exposure (i.e., spending less than 10 min outdoors), women resulted significantly less exposed to sunlight than men (26.7 and 19.2 %, respect-ively, Chi2= 13.220,p< 0.01).
The prevalence of risk factors was then assessed with respect to the history of fragility fractures.
The percentage of patients with previous fractures was greater (26.1 %) in subjects with a positive family history, than in people with negative family history of osteopor-osis (17.3 %) (Chi2= 22.584,p< 0.01).
As much as 16 % of fractured subjects, versus 9.3 % of the non-fractured ones had reported to have taken gluco-corticoids for at least 3 consecutive months (Chi2= 24.835, p< 0.01).
The positive finding of previous fragility fractures was significantly higher in subjects affected by reumathoid
arthritis (4 %) than in unaffected people (2.1 %) (Chi2= 6.941,p< 0.01).
With respect to alcohol use/abuse the probability of observing a previous fracture in subjects assuming at least 3 daily units of alcohol was higher (6.7 %) than in those who drink fewer (4 %) (Chi2= 7.335,p< 0.01).
The incidence of fractures in women who underwent oophorectomy before age 50 was significantly higher (8.2 %) compared to the sample without this clinical event (5.2 %) (Chi2= 6.246,p< 0.01).
The conditions resulting not statistically related to age were: steroid use, hyperthyroidism, calcium nephrolithia-sis, physical inactivity, scarce sunlight exposure, ulcera-tive colitis and Crohn’s disease.
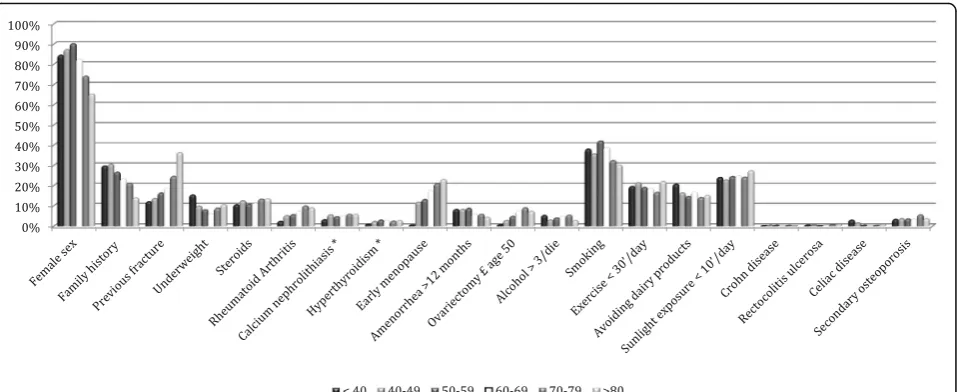
In order to analyze the age effect on the observed vari-ables of interest, the age of the subjects was discretized along a six-levels scale (<40 years; 40–49 years; 50–59 years; 60–69 years; 70–79 years; ≥80 years) and the prevalence of osteoporosis risk factors, an analysis of their frequency distribution in the different age ranges was performed (Table 3 and Fig. 2). Conversely, the other known risk factors have a significantly different prevalence according to the age group. Female gender shows the high-est proportion in the sixth decade (χ2= 222.759, p< 0.01). Family history of osteoporosis was mostly reported in the age range 50–59 years (χ2= 51.685, p< 0.01). A previous fracture was mostly present in the age range 60–69 years, as well as rheumatoid arthritis, scarce dairy products as-sumption and alcohol abuse, whereas smoking habit is more common in the age group 50–59, like underweight (χ2= 52.319,p< 0.01); as much as 4.8 % of fractured people in the whole sample is younger than 40.
[image:6.595.305.539.564.731.2]In order to estimate the statistical relationship between the gender and the FRAX-A score, given the unbalanced sampling of gender, a discretization procedure should be administered to the continuous variable FRAX-A in the
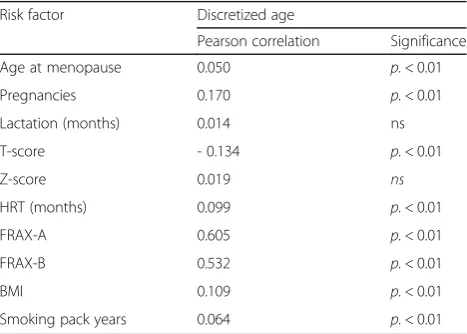
Table 3Correlations between scalar parameters and
discretized age
Risk factor Discretized age
Pearson correlation Significance
Age at menopause 0.050 p.< 0.01
Pregnancies 0.170 p.< 0.01
Lactation (months) 0.014 ns
T-score - 0.134 p.< 0.01
Z-score 0.019 ns
HRT (months) 0.099 p.< 0.01
FRAX-A 0.605 p.< 0.01
FRAX-B 0.532 p.< 0.01
BMI 0.109 p.< 0.01
BT12 group. The statistical relations between discretized age and the other risk factors are reported in Table 3.
In particular, when the whole cohort FRAX-A average score (7.87 ± 7.9) has been taken as cut-off/threshold in order to separate the sample into two subgroups, the 10-years risk of major fractures is lower for men (19.4 % = FRAX-A more than average value) than for women (32.9 %) (Chi2= 37.861, p< 0.01). Conversely, the average scores FRAX-B does not show any signifi-cant difference with respect to gender.
Increasing age results positively correlated to a longer hormone replacing therapy, a major FRAX –A and –B score, a higher BMI, number of pregnancies, and smok-ing, while it is negatively related to T-score as measured by heel QUS, as expected.
Parametric inferential statistics
As regards subjects assuming excessive alcohol, they re-sulted heavier (t =−2.108,p< 0.05) and more likely smoker than the non-drinking people (t =−3.042,p< 0.01). Note-worthy, they also showed higher T-score values (t =−2.128, p< 0.05).
Avoiding dairy products appeared associated with a greater number of packs of cigarettes smoked per year (t =−2.159, p< 0.05). Women who did not take dairy products reported a longer duration of hormone replace-ment therapy after menopause (t =−2.045,p< 0.05).
As expected, people affected by celiac disease were younger (t = 2.271, p< 0.05), lighter (t = 2.561, p< 0.05) and with a lower BMI compared to people without celiac disease (t = 2.844,p< 0.01).
Considering physical exercise, people who declared to do at least 30 min of daily activity was significantly
leaner (t =−3.788,p< 0.01) and with a lower pack-years value (t =−2.714,p< 0.01) than sedentary people.
Subjects who exposed themselves to sunlight for less than 10 min per day showed an older age (t =−2.152, p< 0.05), a higher BMI (t =−2.201, p< 0.01), and more importantly a more elevated FRAX-A (t =−2.210,p< 0.05) and–B risk (t =−1.925,p= 0.05).
Women reporting history of amenorrhea protracted more than twelve consecutive months resulted youn-ger than those without this risk factor (t = 3.045, p< 0.01).
The cases of nephrolithiasis showed a significantly lower T-score (t = 2.041,p< 0.05) and Z-score (t = 2.351, p< 0.05), as well as a higher FRAX-A (t =−2.028,p< 0.05).
People who had suffered from hyperthyroidism had a higher FRAX-A (t =−3.3, p< 0.01) and FRAX–B values (t =−2.817, p< 0.01), and were older than people with-out this endocrine disorder (t =−2.544,p< 0.05).
People with a previous fracture resulted heavier (t =−3.692, p< 0.01) and older (t =−5.171, p< 0.01) than the non-fractured people, and showed a lower T-score (t = 3.089, p< 0.05) and a higher number of concurrent risk fac-tors (t =−2.083,p< 0.05).
The presence of secondary osteoporosis, encompassing a positive medical history of Crohn’s disease, ulcerative colitis, celiac disease, hypercalciuria or hyperthyroidism, was associated with lower T- (t = 3.073, p< 0.01) and Z-scores (t = 2.696,p< 0.01), as well as with higher FRAX-A (t =−4.684,p< 0.01) and FRAX–B values (t =−4.119, p< 0.01).
Women who underwent ovariectomy by age 50 re-sulted to have a higher FRAX-A risk (t =−2.276, p< 0.05). Noteworthy the duration of lactation did not show any significant correlation with osteoporosis.
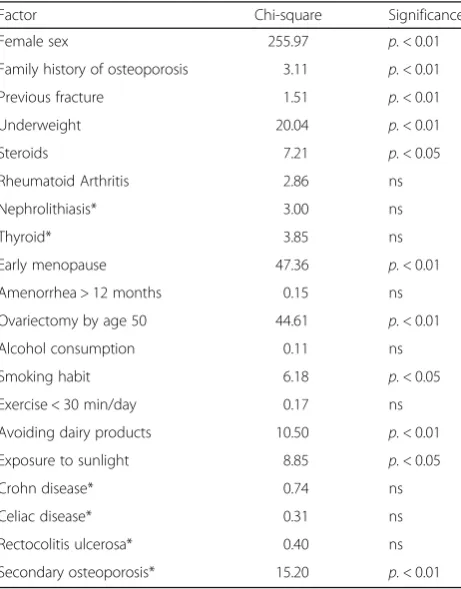
[image:7.595.60.539.87.283.2]Through a multinomial logistic regression, each risk fac-tor was analyzed related to discretized T-score (classified as lower or higher than mean T-score value, i.e., −0.98) and results are reported in Table 4. Among factors belong-ing to FRAX algorithm, female gender, family history of osteoporosis, previous fracture, low body weight, use of steroids, smoking habit, secondary osteoporosis resulted significantly associated with a lower T-score; among the other risk factors, the presence of one of the following fac-tors including early menopause, ovariectomy by age 50, avoiding dairy products, low exposure to sunlight, appear to be significantly associated with lower T-score values (Chi2= 9.702,p< 0.01). Physical inactivity and scarce sun exposure also show to have a certain role, although not statistically significant (Chi2= 3.423,p= 0.064 and Chi2= 3.650,p= 0.056 respectively).
Discussion
Osteoporosis-related fractures are among the main causes of adult disability in developed countries. How-ever, bone fragility is still poorly recognized and treated, since it may remain asymptomatic for years. For these reasons, campaigns to assess bone status should be car-ried out in the general population in order to identify “at-risk” individuals. With this purpose, our screening program was conducted to identify subjects at risk for
fragility fractures in order to plan appropriate further testing and treatment. The BoneTour campaign targeted all the subjects who spontaneously underwent assess-ment of fracture risk by means of ultrasound den-sitometry and clinical questionnaire. It involved as much as n =7305 subjects throughout 21 Italian cities. As regards bone status, this campaign is comparable to ESOPO study, by which the clinical usefulness of quanti-tative ultrasound was assessed for the first time in Italy (2000) to define the prevalence of osteoporosis and osteo-penia and their association with fractures [15]. In the BoneTour sample, 18.1 % of the subjects (20.2 % of total women and 7.4 % of total men) were osteoporotic accord-ing to ultrasound T-score values, while 42.1 % (44.1 % of total women and 32.4 % of total men) were osteopenic.
The majority of the sample (83.7 %) was composed by women, and this reflects the common awareness that female gender commonly perceives an higher risk of ex-periencing osteoporosis and fragility fractures, either be-cause of a smaller muscle and bone mass compared to male, either because of the sudden drop in estrogens that occurs with the onset of menopause. Indeed, women in their 50s were the mainly represented category.
As a direct evidence of this difference between genders, the average FRAX-A risk calculated for the subsample of men resulted lower than that of women, despite the habit of smoke and alcohol assumption resulted more incident among males. The older mean age of males compared to fe-males was probably due to the fact that in the collective opinion osteoporosis is still seen as a threat only for women. The average age of the subjects who took part in the screening was 58.3 years, while an earlier check of bone status would really be useful, in particular in the presence of a risk factor. The increased risk of fracture with age is only partly due to the reduction in BMD. Poor balance and muscle hypotonia have an obvious role in the elderly because they favor both sedentary lifestyle and risk of falls. In addition, with advancing age, vitamin D insufficiency/ deficiency is becoming increasingly common and import-ant for bone health [21]. We acknowledge that the inci-dence of falls or the muscular performance were not taken into account in the present analysis, and vitamin D status was only inferred by evaluation of sun exposure.
The BoneTour database confirmed the heavy impact that the parental history of osteoporosis has on skeleton health [22]. Interestingly, as much as 30,5 % of people under fifty years of age referred a family history of frac-ture, and this prevalence seems to decrease with aging.
[image:8.595.58.289.429.724.2]Analogously, most of fractured subjects declared to have one or more notorious risk factor, such as alcohol excessive intake, use of steroids, RA, oophorectomy be-fore 50. In turn, previous fractures were significantly correlated with a reduced QUS T-score, and conse-quently a higher risk of further fractures [23].
Table 4Logistic regression evaluating discretized T-score effect versus nominal risk factors: likelihood ratio test
Factor Chi-square Significance
Female sex 255.97 p.< 0.01
Family history of osteoporosis 3.11 p.< 0.01
Previous fracture 1.51 p.< 0.01
Underweight 20.04 p.< 0.01
Steroids 7.21 p.< 0.05
Rheumatoid Arthritis 2.86 ns
Nephrolithiasis* 3.00 ns
Thyroid* 3.85 ns
Early menopause 47.36 p.< 0.01
Amenorrhea > 12 months 0.15 ns
Ovariectomy by age 50 44.61 p.< 0.01
Alcohol consumption 0.11 ns
Smoking habit 6.18 p.< 0.05
Exercise < 30 min/day 0.17 ns
Avoiding dairy products 10.50 p.< 0.01
Exposure to sunlight 8.85 p.< 0.05
Crohn disease* 0.74 ns
Celiac disease* 0.31 ns
Rectocolitis ulcerosa* 0.40 ns
Secondary osteoporosis* 15.20 p.< 0.01
Underweight resulted associated with reduced bone stiffness. In this respect, different studies reported con-flicting data on the influence of BMI on BMD. A Mexican study on postmenopausal women either with normal weight, overweight, or different degrees of obesity revealed that a positive and significant association between BMI and BMD at lumbar spine, total hip and femoral neck measured by DXA [24]. However, as reported in recent literature, visceral adiposity has been shown to be an independent inverse determinant of bone density in over-weight subjects. This association may be mediated by adipokines and a chronic inflammatory state [25]. Other authors examined the relationship of serum leptin con-centration with age, body weight, BMI and BMD in main-land Chinese women, finding that age-related changes in serum leptin concentration depends on BMI, but is not a direct determinant of BMD [26]. Regarding underweight, a study on adolescent female athletes found that, although weight-bearing exercise is typically associated with an increase in BMD, amenorrheic athletes have lower BMD than eumenorrheic athletes and nonathletic controls, likely as a consequence of low energy availability and sub-sequent hypogonadism [27].
Notably, as much as 8.3 % of women aged 40–49 re-ported the history of amenorrhea lasted over 12 months. The loss of bone mass associated with early meno-pause is the result of the catabolic effect of estrogen de-ficiency, which sums the linear age-related loss of bone mass [28]. The earlier the cessation of ovarian activity occurs, the longer the exposition of the skeleton to the risk of trauma, and the greater the loss of BMD in the years to come. About 79 % of surveyed women were in menopause. The average age of onset of menopause was found to be 49,3 years (SD 4,6). Almost 12 % of them had an early menopause (≤45 years), with brief or absent hormone replacement therapy (HRT). As much as 37.4 % of early postmenopausal women resulted osteo-penic, and 22.8 % osteoporotic.
Tobacco smoking appeared to be the most widespread behavioral risk factor, as regarding 38 % of the sample.
Combined analysis of studies involving about 60,000 people in Canada, USA, Europe, Australia and Japan shows that the smoking habit increases the risk of hip fracture by 1.5 times [29]. Although the risks associated with smoking grow along with age, the effects of cigarette smoking begin to occur early. Swedish studies showed, in a group of young male smokers between 18 and 20 years, a reduction in BMD and thinning of cortical bone, the component that gives most of its strength. Thus, at a young age, smoke re-duces the bone mass peak, increasing the risk of osteopor-osis in later years [30]. As for alcohol assumption, the risk of fracture related to smoking is in part due to loss of bone stiffness, especially in women after menopause. Studies in the UK suggest that postmenopausal smokers have a much
more rapid decline in BMD [31]. In our sample, the larger proportion of smokers regarded the age range 50–59 (42.2 %).
One of the main behavioral protective factors is phys-ical activity. Besides maintaining bone strength, the main goal of exercise is to increase muscle mass and function, as well as to maintain good balance and strength, in order to prevent falls. In particular, resistance exercises become even more important with increasing age, and besides it is difficult to build bone mineral after adult-hood, exercise has been shown to lead to modest in-creases in BMD (1–2 %) [32]. Moreover, the correction of sedentary lifestyle would even allow health gain as regards the prevention of diabetes, overweight and car-diovascular disease.
Over 19 % of the people interviewed admitted to perform less than 30 min of physical activity per day, including walking, gardening and housework. When re-lated to T-score, exercise factor shows a p-value very close to statistical significance.
It is not surprising that daily exposure to sunlight, cru-cial for the synthesis of vitamin D, did not last more than 10 min for over 24 % of the people. The scarce ex-posure to sunlight may belong to a vicious cycle that characterizes various pathological conditions affecting the developed countries population. Indeed, sunlight in-duces specialized light-sensitive retinal ganglion cells to release glutamate in the suprachiasmatic nucleus, and targets depression-associated neurotransmitter systems (serotonin, noradrenalin, and dopamine) [33]. Psycho-logical distress, so prevalent in our society, has been as-sociated both with health-damaging behaviour, such as excessive assumption of alcohol, smoking, sedentary and unhealthy diet, both with inflammation, all of which could increase the risk of developing a variety of path-ologies [34], such as metabolic syndrome, cerebro- and cardio-vascular diseases [35], as well as osteoporosis [36]. In turn, the abovementioned pathologies can lead people not to perform exercise, especially outdoors, fur-ther increasing the distress condition.
Patients with RA display an increased risk of osteopor-osis and fragility fractures [36]. Indeed this disease affected 2.38 % of our sample and presented a strong correlation with the history of fragility fracture (p< 0.01), independ-ently of steroid use.
Considerably, also each of the other causes of secondary osteoporosis [37–40], i.e., Crohn’s disease, ulcerative colitis, celiac disease, hypercalciuria and hyperthyroidism, resulted as statistically significant in conditioning both QUS T-score and FRAX-A and–B.
conditions likely to result in malabsorption (that is Crohn’s disease, ulcerative colitis, celiac disease, steatorrhoea, blind loop syndrome)” and “Other endocrine conditions (thyro-toxicosis, primary or secondary hyperparathyroidism, Cushing’s syndrome)”[41].
In literature controversial data exist about the possible role of the number of pregnancies and breastfeeding duration in influencing the availability of calcium to the maternal bone [42]. In our sample, the number of preg-nancies and the duration of lactation did not affect QUS T-score significantly, probably because the environmen-tal conditions protect mothers from calcium deficiency.
In summary, the results of the BoneTour 2012 cam-paign confirmed the influence of all the variables con-sidered by FRAX algorithm on bone status (female gender, age, family history of osteoporosis, previous frac-ture, underweight, alcohol abuse, secondary osteoporosis and RA). Further factors, such as sunlight exposure, hyperthyroidism, calcium nephrolithiasis, ovariectomy before age 50, physical inactivity, have shown a correl-ation with a high FRAX-score and reduced T-score.
The original version of FRAX™, based on five regional estimates of hip fracture risk undertaken up to 20 years previously, has been updated in 2013 on the basis of the new fracture incidence rates reported in the Italian na-tional hospitalization database for the year 2008 [43]. The revision resulted close to the original version, except for a lower 10-year probability estimated in the younger age groups, and a higher one in the oldest [43].
To verify fracture risk evaluated by BoneTour cam-paign, a 10-year follow-up of the whole sample should be performed, assessing the incidence of osteoporotic fracture, as done by Lapi and colleagues [44], who followed up a selected group of patients (aged 50–85) of 900 Primary Care Physicians until the occurrence of a fragility fracture. This study revealed a positive associ-ation between advanced age, history of fracture, use of steroids, rheumatoid arthritis, underweight (BMI < 20) and gastrointestinal disease, thus according to our data, as well as depression, liver disease, chronic obstructive pulmonary disease, use of anticonvulsants [44].
In light of these data, the accuracy of FRAX™could be improved by comparing in the long term the incidence of occurring fractures to the risk predicted by the calcu-lator; epidemiological studies like BoneTour campaign, assessing bone status, history of fractures and clinical parameters known to influence fracture risk, should be used to increase the reliability of the algorithm.
Conclusions
The prevalence rate of osteoporosis was approximately 18.7 %, while the rate of osteopenia was about 42.6 %. The 10-year-fracture-risk calculated by FRAX™algorithm dis-played variation across Italy. The results confirmed the
importance of variables already present in FRAX™(female gender, age, family or personal history of osteoporotic fracture, alcohol use, steroids, rheumatoid arthritis), but showed that secondary forms of osteoporosis (Crohn dis-ease, ulcerative colitis, hyperthyroidism, calcium nephro-lithiasis), poor sun exposure, and of oophorectomy before age 50 added to FRAX prediction. These conditions de-serve to be taken into account by the physician since they may impact bone strength. A screening campaign, as well as being helpful for the people to assess their bone status, raise awareness and learn how to prevent osteoporosis, is useful for the health system, which can then modify the intervention at the territorial and hospital level depending on the presence of specific risk factors in that region.
Acknowledgements
We are grateful to Mrs. Donatella Bernini for the full organization of the Bonetour events.
Funding
This work was supported with an unrestricted grant from F.I.R.M.O. Fondazione Raffaella Becagli to MLB.
Availability of data and materials
Data obtained during BoneTour campaign were partially presented at VIII OrtoMed congress which took place in Florence, Italy, in 2013.
Authors’contribution
MLB designed and organized the Bonetour campaign, with the support of F.I.R.M.O. (Fondazione Italiana per la Ricerca sulle Malattie Ossee) Fondazione Raffaella Becagli. LCa, TC, AM, FG and CF performed the screening campaign across Italy, collected data and built up the Bonetour database. AG and SP did the statistical analysis, contributing to figure and tables’construction. LCa and LCi wrote the paper. MLB and DB gave critical final revision of the paper. Each author approved the final version to be published.
Competing interests
The authors declare that they have no competing interests.
Consent for publication
Each participant was adult and signed an informed consent to publish the results of their personal data collected in an anonymous way.
Ethics approval and consent to participate
The study was approved by the local Internal Review Board of the University of Florence. An informed consent was obtained from each subject to participate to the screening and to collect clinical data although in an anonymous way.
Author details
1Department of Surgery and Translational Medicine, University of Florence,
Viale Pieraccini, 6-50139 Florence, Italy.2Department of Education and Psychology and Center for the Study of Complex Dynamics, VirtHuLab, University of Florence, Florence, Italy.3Department of Epidemiology and Biostatistics, University of California, San Francisco, CA, USA.
Received: 21 April 2016 Accepted: 9 September 2016
References
1. Hernlund E, Svedbom A, Ivergard M, Compston J, Cooper C, Stenmark J, et al. A report prepared in collaboration with the International Osteoporosis Foundation (IOF) and the European Federation of Pharmaceutical Industry Associations (EFPIA). Arch Osteoporos. 2013;8:136.
3. Bolland MJ, Siu ATY, Mason BH, Mason BH, Horne AM, Ames RW, Grey AB, et al. Evaluation of the FRAX and Garvan fracture risk calculators in older women. J Bone Miner Res. 2011;26:420.
4. Kanis JA, Melton III LJ, Christiansen C, Johnston CC, Khaltaev N. The diagnosis of osteoporosis. J Bone Miner Res. 1994;9:1137.
5. Looker AC, Wahner HW, Dunn WL, Calvo MS, Harris TB, Heyse SP. Updated data on proximal femur bone mineral levels of US adults. Osteoporos Int. 1998;8:468.
6. Kanis JA, McCloskey EV, Johansson H, Oden A, Melton 3rd LJ, Khaltaev N. A reference standard for the description of osteoporosis. Bone. 2008;42:467. 7. Leslie WD, Lix LM. Comparison between various fracture risk assessment
tools. Osteoporos Int. 2013. doi:10.1007/s00198-013-2409-3. 8. Cranney A, Jamal SA, Tsang JF, Josse RG, Leslie WD. Low bone mineral
stiffness and fracture burden in postmenopausal women. CMAJ. 2007;177:575.
9. Hussein R, Al-Bugami M, Balharith S, Moawad M, El-Shaker M, Hassan A, et al. Updated recommendations for the diagnosis and management of osteoporosis: a local perspective. Ann Saudi Med. 2011;31:111.
10. Baroncelli G. Quantitative ultrasound methods to assess bone mineral status in children: technical characteristics, performance, and clinical application. Pediatr Res. 2008;63:220.
11. Beerhorst K, Tan J, Tan IY, Verschuure P, Aldenkamp AP. Dual-energy X-ray absorptiometry versus quantitative ultrasonography in diagnosing osteoporosis in patients with refractory epilepsy and chronic antiepileptic drug use. Ther Adv Musculoskelet Dis. 2013;5:59.
12. Grabe DW, Cerulli J, Stroup JS, Kane MP. Comparison of the Achilles Express ultrasonometer with central dual-energy X-ray absorptiometry. Ann Pharmacother. 2006;40:830.
13. Krieg MA, Barkmann R, Gonnelli S, Stewart A, Bauer DC, Del Rio Barquero L, et al. Quantitative ultrasound in the management of osteoporosis: the 2007 ISCD official positions. J Clin Densitom. 2008;11:163.
14. Thompson PW, Taylor J, Oliver R, Fisher A. Quantitative ultrasound (QUS) of the heel predicts wrist and osteoporosis-related fractures in women age 45–75 years. J Clin Densitom. 1998;1:219.
15. Maggi S, Noale M, Gonnelli S, Nuti R, Di Munno O, de Feo D, et al. Quantitative ultrasound calcaneous measurements: normative data for the Italian population. the ESOPO study. J Clin Densitom. 2007;10:340. 16. Gonnelli S, Cepollaro C, Gennari L, Montagnani A, Caffarelli C, Merlotti D, et
al. Quantitative ultrasound and dual-energy X-ray absorptiometry in the prediction of fragility fracture in men. Osteoporos Int. 2005;16:963. 17. Khan AA. Premenopausal women and low bone density. Can Fam Physcian.
2006;52:743.
18. Recommendations for the prevention and treatment of glucocorticoid-induced osteoporosis: 2001 update. American College of Rheumatology Ad Hoc Committee on Glucocorticoid-Induced Osteoporosis. Arthritis Rheum. 2001;44:1496–503
19. Sakhaee K, Maalouf NM, Kumar R, Pasch A, Moe OW. Nephrolithiasis-associated bone disease: pathogenesis and treatment options. Kidney Int. 2011;79:393.
20. WHO Fracture Risk Assessment Tool FRAX®: http://www.shef.ac.uk/FRAX/ tool.jsp?lang=en. Accessed Sept 2016.
21. Wilkins CH. Osteoporosis screening and risk management. Clin Interv Aging. 2007;2:389.
22. Meadows ES, Mitchell BD, Bolge SC, Johnston JA, Col NF. Factors associated with treatment of women with osteoporosis or osteopenia from a national survey. BMC Womens Health. 2012;12:1.
23. Lindsay R, Silverman SL, Cooper C, Hanley DA, Barton I, Broy SB, et al. Risk of new vertebral fracture in the year following a fracture. JAMA. 2001;285:320. 24. Méndez JP, Rojano-Mejía D, Pedraza J, Coral-Vázquez RM, Soriano R,
García-García E, et al. Bone mineral density in postmenopausal Mexican-Mestizo women with normal body mass index, overweight, or obesity. Menopause. 2013;20:568.
25. Russell M, Mendes N, Miller KK, Rosen CJ, Lee H, Klibanski A, et al. Visceral fat is a negative predictor of bone density measures in obese adolescent girls. J Clin Endocrinol Metab. 2010;95:1247.
26. Zhong N, Wu XP, Xu ZR, Wang AH, Luo XH, Cao XZ, et al. Relationship of serum leptin with age, body weight, body mass index, and bone mineral density in healthy mainland Chinese women. Clin Chim Acta. 2005;351:161. 27. Russell M, Misra M. Influence of ghrelin and adipocytokines on bone
mineral density in adolescent female athletes with amenorrhea and eumenorrheic athletes. Med Sport Sci. 2010;55:103.
28. Pouillès JM, Trémollières F, Bonneu M, Ribot C. Influence of early age at menopause on vertebral bone mass. J Bone Miner Res. 1994;9:311. 29. Kanis JA, Johnell O, Oden A, Johansson H, De Laet C, Eisman JA, et al.
Smoking and fracture risk: a meta-analysis. Osteoporos Int. 2005;16:155. 30. Lorentzon M, Mellström D, Haug E, Ohlsson C. Smoking is associated with
lower bone mineral density and reduced cortical thickness in young men. J Clin Endocrinol Metab. 2007;92:497.
31. Law MR, Hackshaw AK. A meta-analysis of cigarette smoking, bone mineral density and risk of hip fracture: recognition of a major effect. BMJ. 1997;315:841.
32. IOF. Exercise Raccomandations. https://www.iofbonehealth.org/exercise-recommendations. Accessed Sept 2016.
33. Lieverse R, Van Someren EJ, Nielen MM, Uitdehaag BM, Smit JH, Hoogendijk WJ. Bright light treatment in elderly patients with nonseasonal major depressive disorder: a randomized placebo-controlled trial. Arch Gen Psychiatry. 2011;68:61. 34. Puustinen PJ, Koponen H, Kautiainen H, Mäntyselkä P, Vanhala M. Psychological
distress predicts the development of the metabolic syndrome: a prospective population-based study. Psychosom Med. 2011;73:158.
35. Hamer M, Molloy GJ, Stamatakis E. Psychological distress as a risk factor for cardiovascular events: pathophysiological and behavioral mechanisms. J Am Coll Cardiol. 2008;52:2156.
36. Solomon DH, Katz JN, Cabral D, Patrick AR, Bukowski JF, Coblyn JS. Osteoporosis management in patients with rheumatoid arthritis: evidence for improvement. Arthritis Rheum. 2006;55:873.
37. Gorka J, Taylor-Gjevre RM, Arnason T. Metabolic and clinical consequences of hyperthyroidism on bone density. Int J Endocrinol. 2013;638727. 38. Ogrin C. Evaluation of parathyroid levels and bone densitometry after
cinacalcet treatment in severe primary hyperparathyroidism. Minerva Endocrinol. 2013;38:337.
39. Compston JE, Judd D, Crawley EO, Evans WD, Evans C, Church HA, Reid EM, Rhodes J. Osteoporosis in patients with inflammatory bowel disease. Gut. 1987;28:410.
40. Xing Y, Morgan SL. Celiac disease and metabolic bone disease. J Clin Densitom. 2013;16:439.
41. Hippisley-Cox J, Coupland C. Derivation and validation of updated QFracture algorithm to predict risk of osteoporotic fracture in primary care in the United Kingdom: prospective open cohort study. BMJ. 2012;344, e3427.
42. Yumusakhuylu Y, Turgut ST, Icagasioglu A, Baklacioglu HS, Atlig RS, Murat S, Suer N. Bone mineral changes during pregnancy and lactation. Gynecol Endocrinol. 2013;29:763.
43. Piscitelli P, Chitano G, Johannson H, Brandi ML, Kanis JA, Black DM. Updated fracture incidence rates for the Italian version of FRAX®. Osteoporos Int. 2013;24:859.
44. Lapi F, Simonetti M, Michieli R, Pasqua A, Brandi ML, Frediani B, et al. Assessing 5-year incidence rates and determinants of osteoporotic fractures in primary care. Bone. 2012;50:85.
• We accept pre-submission inquiries
• Our selector tool helps you to find the most relevant journal
• We provide round the clock customer support
• Convenient online submission
• Thorough peer review
• Inclusion in PubMed and all major indexing services
• Maximum visibility for your research
Submit your manuscript at www.biomedcentral.com/submit