Feasibility Study of Compton Scattering Enchanced
Multiple Pinhole Imager for Nuclear Medicine
L. J. Meng, W. L. Rogers, N. H. Clinthorne, and J. A. Fessler
Abstract—This paper presents a feasibility study of a Compton scattering enhanced (CSE) multiple pinhole imaging system for gamma rays with energy of 140 keV or higher. This system consists of a multiple-pinhole collimator, a position sensitive scintillation detector as used in standard Gamma camera, and a Silicon pad de-tector array, inserted between the collimator and the scintillation detector. The problem of multiplexing, normally associated with multiple pinhole system, is reduced by using the extra information from the detected Compton scattering events. In order to compen-sate for the sensitivity loss, due to the low probability of detecting Compton scattered events, the proposed detector is designed to col-lect both Compton scattering and non-Compton events. It has been shown that with properly selected pinhole spacing, the proposed detector design leads to an improved image quality.
Index Terms—Compton scattering enhancement, multiple pin-hole.
I. INTRODUCTION
P
ARALLEL hole and pinhole are by far the most often used collimation methods for nuclear medicine applica-tions, although fanbeam and conebeam collimators are also applied [1], [2]. These collimators have the advantage of being nonmultiplexing and therefore every detected gamma ray defines a unique angular region, within which the gamma ray was generated or scattered. However, this uniqueness of information is achieved at the cost of losing all photons that do not fall into those possible paths defined by the collimator. Several mechanical collimators involving certain degrees of multiplexing have been studied in the past. These include the use of coded apertures, multiple pinholes, and rotating slits [3], [4], which allows a better raw detection sensitivity to be achieved. Unfortunately, this improvement is usually achieved at the expense of the amount of information conveyed by each detected photon. This tradeoff is similar for Compton cameras. The angular information carried by the detected photon is di-luted into a conical surface. Furthermore the angular accuracy achievable is also limited by the effect of Doppler broadening and electronic noise, especially at lower energies [5]. It has been shown that at 140 keV, to compete with conventional gamma camera, the design of Compton camera may require an unrealistic amount of semiconductor material for the scattering detector to provide enough detected scattering events [6].Manuscript received January 27, 2003; revised April 21, 2003.
L. J. Meng, W. L. Rogers, and N. H. Clinthorne are with the Department of Radiology, University of Michigan, Ann Arbor, MI 48109 USA (e-mail: [email protected]).
J. A. Fessler is with the Department of Electrical Engineering and Computer Science, University of Michigan, Ann Arbor, MI 48109 USA.
[image:1.612.319.533.165.323.2]Digital Object Identifier 10.1109/TNS.2003.817956
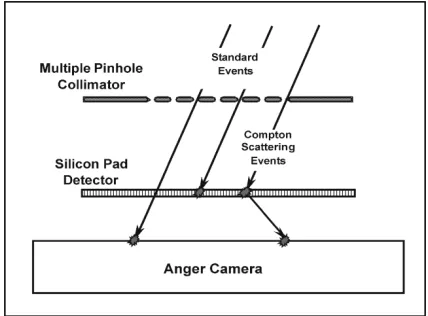
Fig. 1. Schematic of the Compton scattering enhanced multiple pinhole imaging system.
The idea of using combined mechanical and electronic colli-mations was previously proposed by Uritani et al. [7]. In their detector, a multiple parallel plate collimator was placed in front of a Compton camera. It reduces the effect of multiplexing, whilst maintains a relatively high open fraction on the colli-mator. The results showed an improved signal-to-noise ratio for imaging Tc tracer. However, the raw detection sensitivity is limited by the relatively low probability of detecting photons through Compton scattering effect. In this paper, we present an alternative detector configuration based on the similar principle. It consists of a multiple pinhole collimator placed in front of a less optimized Compton camera. The choice of using multiple pinhole collimator offers a wide range of freedom in selecting the open fraction of the collimator and spatial coding scheme for different applications. The proposed imager is designed to collect events both Compton scattered between the two detec-tors and interact with either the first or the second detector only. Therefore, the raw sensitivity is not limited by the relatively low probability of detecting an incoming photon through Compton scattering. To evaluate the detector performance, we used the variance-resolution tradeoff curve calculated based on the max-imum a posteriori (MAP) reconstruction methods [8], [9].
II. THEDETECTORCONCEPT
The proposed detector system is essentially the combination of a Gamma camera using a multiple pinhole collimator and a Silicon scattering detector inserted between the Anger camera and the collimator, as shown in Fig. 1. For a detected Compton scattered event, the energy loss in the first detector and the loca-tions of interacloca-tions on both detectors help to restrict the origin
TABLE I
PARAMETERSUSED IN THESIMULATION
of the photon to a broadened conical surface started from the first interaction location. This extra information not only en-ables one to say that the detected photon is from one of the pin-holes in the collimator, but also assigns a different probability for each pinhole. The proposed detector system also makes use of those events that interact with either the first or the second detector only. The data containing both Compton scattered and non-Compton scattered events are used in list-mode image re-construction. The Compton aperture is not designed for imaging by itself, but rather for restricting the already restricted angular uncertainty (through the mechanical aperture). It is possible to use a less optimized Compton camera whilst still provide useful extra information. For simplicity, we will use the term “CSE de-tector” for the proposed design and “MPH dede-tector” for standard multiple pinhole detector. The key question that we would like to answer is “would the extra information provided by Compton scattering be sufficient for compensating the loss in the number of photons collected?”
III. METHODS FORCOMPARISONS
A. Detector Simulation and Image Reconstruction
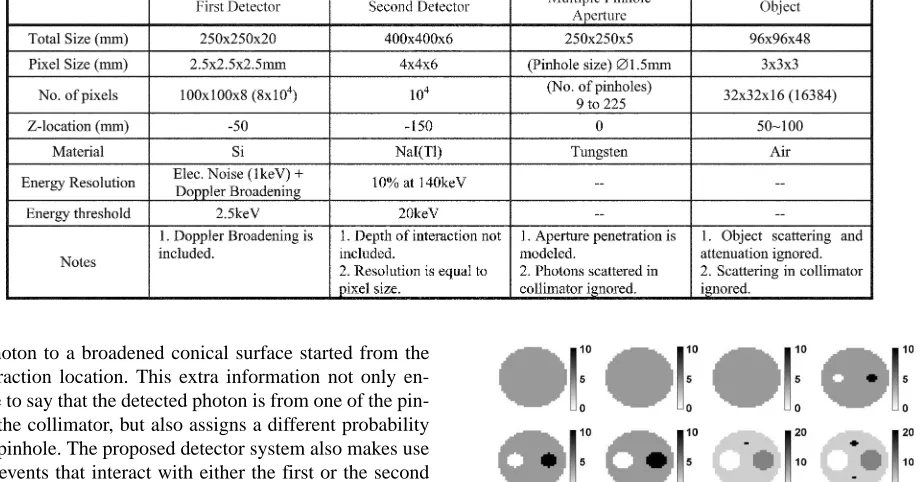
[image:2.612.76.536.96.337.2]The basic detector and source configurations used in this study are shown in Table I. In order to study the effect of the amount of multiplexing on the detector performance, five dif-ferent multiple pinhole configurations were simulated, with 9, 25, 49, 121, and 225 pinholes, respectively. The corresponding pinhole distances were 3.0, 2.0, 1.5, 1.0, and 0.6 cm. The multiple pinholes were placed in square patterns. The actual pinhole positions were randomized by a small amount (1–2 mm) around the grid points to reduce the possible artifacts, which may arise as a result of sampling the object at some discrete spatial frequencies. In these studies, the aperture pene-tration is modeled by calculating the path length of gamma rays inside the aperture volume. Two such detectors were placed above and below the object. For simulating the penetration effect on the knife-edge of the pinholes, we developed a ray tracing algorithm that first divides the aperture into small volumes and then the total path length is derived based on the number of small volumes went through by the gamma ray and incident angle. An interesting approach for modeling
Fig. 2. The phantom used in 3-D study.
the aperture penetration was proposed by Metzler et al. that provides an analytical expression which is useful for speeding up the calculation of the system response function [10], [11].
Due to the large number of detector bins and source voxels involved, it is impractical to precalculate and store the entire system response function (SRF). Instead, we precalculated and stored several sub-SRFs corresponding to factors such as colli-mator transfer function, probabilities of Compton scattering at every possible angle and detection after scattering, etc. The data were generated in list-mode and SRF corresponding to a partic-ular data realization was precomputed and stored in memory for reconstruction. This precomputation is very time consuming. It also limits the total number of counts that can be reconstructed to less than 1 million. The object simulated was assigned an ac-tivity distribution as shown in Fig. 2. It contains four hot or cold spheres, superimposed on a continuous background.
B. Variance-Resolution Tradeoff
based on some very simple and somehow unrealistic imaging tasks. It has been shown that the simplicity of these tasks limited their use in optimizing system design. Uniform Cramer–Rao bound (Uniform CR bound) has been used to study the vari-ance-bias tradeoff of an estimator [12], [13]. It gives the lowest possible variance at a certain bias described by the bias gradient. This method requires the inversion of the related Fisher infor-mation matrix (FIM) and therefore a huge computational load for a relatively complicated detector system.
Fessler and Rogers proposed an approach that analyzes the mean, variance, and spatial resolution properties of images esti-mated through optimizing an implicitly defined object function, such as the penalized likelihood or maximum a priori (MAP) estimators [14], [15]. This method was used in developing a preconditioner for conjugate gradient PET image reconstruction [16]. Qi et al. further explored this idea by adopting this pre-conditioner as an approximation of the inverse of the Hessian matrix and developed a closed form approximation for resolu-tion and variance. This later development utilized Fourier trans-form theory and the assumption that the system modeled are “locally shift-invariant” [17], [18]. It has been shown that the variance and resolution derived had very good agreement with the Monte Carlo simulations. Another important feature about this approach is that it does not require the inversion of the Hes-sian matrix. Therefore the computation load is greatly reduced. In this study, we adopted this approach to demonstrate the ben-efit of adding the Compton scatter aperture.
One could easily argue that the spatial resolution and vari-ance properties derived using this approach are only based on a particular of reconstruction algorithm. The arguments we would use to support this choice are the following. Theoretically, it has been shown that the uniform CR bound can be achieved by MAP reconstruction with a quadratic prior [12]. Practically, this is a method that we have relatively comprehensive theoretical un-derstanding and experimental verification. It also requires only modest computational resources, which makes it attractive for our study.
The details of the development leading to this method can be found in the references cited above. Here we briefly restate some of the key steps. Given a measured data set , the log-likelihood of an estimator , of the underlying object is
(1)
where is the unknown image and is the
measured data. The mean of the data is related to the image through transformation
(2)
where is the detector response function and is the mean contribution from object scattering events and background radi-ation. The MAP estimate is achieved by maximizing an object function
(3)
where is the parameter that controls the amount smoothing applied to the image. For simplicity, we only used the quadratic roughness penalty with the form
(4)
(5)
where is the weighting factor. is the neighborhood matrix whose definition can be found in [17] and is an arbitrary vector.
So that the MAP estimator is defined as
(6)
For a nonlinear estimator, one can use the local impulse response (LIR) as a measure of the spatial resolution property. For the th voxel it is defined as
(7) where E[.] is the expectation operator. Using the first order Taylor expansion and chain rule, one can approximate the local impulse response by its linearized representation [21]
(8)
where is the Fisher information matrix
(FIM). The covariance of MAP reconstruction can be approxi-mated as
(9)
By using the recipe presented in [14], one can calculate the local impulse response function and variance at a certain point through calculating a row of the inversed matrix .
This method involves the inversion of Hessian matrix or solving related linear equations. For the detector geometry and the 3-D source object used in this study, calculating the FIM (or even a column of FIM) is a very challenging task. To make the calculation computationally practical, we need to make further simplification by assuming the system is “locally shift-in-variant” [18]. One can bring the diagonal matrix sandwiched between and outside so that
(10)
and similarly
(11)
where the diagonal matrix with
Fig. 3. The probability of a detected event being originated from each source pixel. The brightness of a pixel is proportional to this probability. The central 16 transaxial slices are shown and the 49 pinhole collimator was used in simulation. CSE stands for Compton scattering enhancement and “with CSE” means that the directional information obtained from the detected Compton scattering was included in the image reconstruction.
and with
(13)
where . Substituting (10) and (11) into (8), one gets the approximation for the local impulse response
(14)
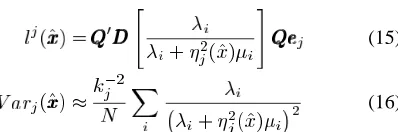
Using the locally shift-invariant approximation, the eigen-values, and , of the block-circulant representations of and can be derived using the 3-D Fourier transform. This property was used to develop closed form expressions for the LIR and variance of MAP reconstruction [17]
(15)
(16)
where and are the unitary 3-D discrete Fourier transform operator and its transpose. The th element of the LIR is defined as contrast recovery coefficient (CRC).
One difficulty in using resolution-variance tradeoff for detector optimization is defining the spatial resolution. Many quantities, such as full width at half maximum (FWHM), full width at one-tenth maximum (FWTM), and contrast recovery coefficient (CRC) have been used in the past. However, none of them can fully quantify the spatial resolution property in reconstructed images. In this study, we choose to use CRC as a resolution index based on its simplicity and known correlation to FWHM. It can also be related to the ability of quantifying the activity concentrations in preset regions-of-interest (ROIs) and lesion detection tasks, through the quantity “point-wise signal to noise ratio” [17]
(17)
IV. RESULTS
A. Reconstructions in 3-D
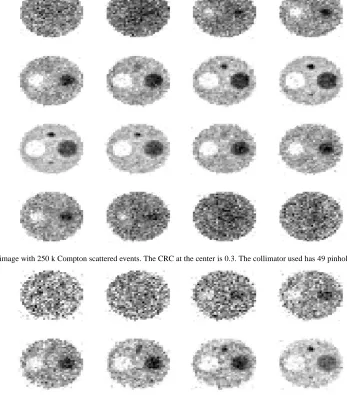
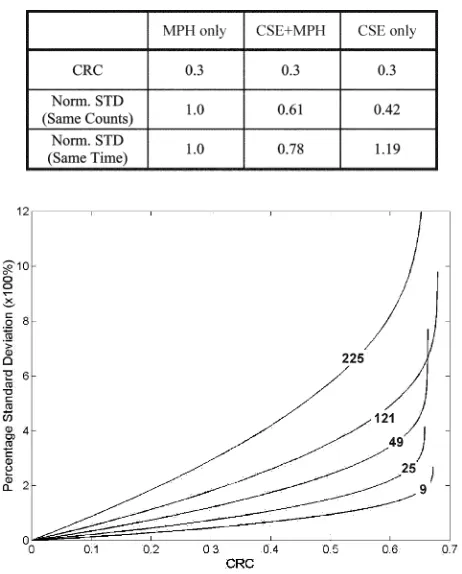
Fig. 3 shows the back-projected probability distribution across each of the 16 slices of the source object for a detected event. It is easily seen that the angular ambiguity is greatly reduced by adding the Compton scattering information. This was translated into an improved image quality as shown in Figs. 4–6. The list-mode MAP algorithm with quadratic penalty function [as shown in (4) and (5)] was used for these recon-structions. All three data sets contained the same number of counts. Using the Compton scattering information significantly reduced the variance at the same value of CRC. It also helped to achieve a better reconstruction in the cold region. This should improve the accuracy of quantifying the activity concentration within a preset region-of-interest. When comparing the detector performances based on the same measuring time, the detector, using only Compton scattered events, suffered from the low sensitivity and produced the highest standard deviation at the same CRC (resolution). This can be improved if one also makes use of the non-Compton events. These results are shown in Table II.
B. Resolution-Variance Tradeoff
To further evaluate the proposed detector design, we compared the image quality using the variance-resolution tradeoff curve achieved at the image center. This study took the following steps. First, we compared the relative detector performance as a function of the amount of multiplexing in the data, with collimators having different pinhole configurations. Second, based on the results achieved, we compared the “best” CSE detector (amongst the detectors compared) with the “best” standard MPH detector to show the benefit of combining Compton aperture with mechanical collimation. Finally, we briefly discussed results from resolution-variance trade-off study and highlighted the limitations of this approach.
Fig. 4. Reconstructed image with 250 k Compton scattered events. The CRC at the center is 0.3. The collimator used has 49 pinholes.
Fig. 5. Reconstructed image with 250 k events, including both Compton scattered and non-Compton scattered events. The CRC at the center is 0.3. The ratio of Compton scattered events used is determined based on the proposed detector design (see Table I for details).
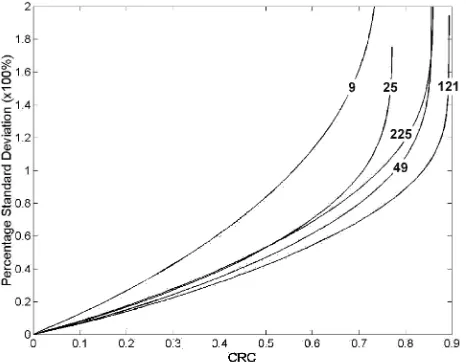
measuring time and shown in Figs. 7–10. For the standard MPH detector, the best variance-resolution (CRC) was achieved with the 25 pinhole collimator, given the same measuring time. The difference between detectors using the 25 pinhole and 9 pin-hole collimators is very small. This indicates that a collimator with relatively small amount of multiplexing is preferred if no extra information is available. When Compton information is added, a larger open fraction on the collimator provided im-ages with the lowest variance. The best variance-CRC (resolu-tion) tradeoff was achieved with the 121 pinhole collimator. It
is worth noting that the standard deviation versus CRC curves may go across each other when CRC is relatively large. This is due to changes in the shape of LIRs, which will be discussed later in this section. Fortunately, all useful reconstructions were achieved when CRC is between 0.2 and 0.6. Therefore, we used the curves within this range for comparing the performances of detectors.
Fig. 6. Reconstructed image with 250 k multiple pinhole events (with no Compton scattering information) events.
TABLE II
[image:6.612.49.280.385.672.2]IMAGEPROPERTIES AT THECENTRE OF THERECONSTRUCTEDIMAGES FOR DETECTORSUSING THE49 PINHOLECOLLIMATOR
Fig. 7. Standard deviation as a function CRC for detector using standard MPH events (no Compton scattering information used at all). Five MPH configurations were used and curves are normalized to the same counts.
MPH detector using (the 25 pinhole collimator). The results are shown in Fig. 11. It is easily seen that using Compton scattered events only gave the worst performance amongst
Fig. 8. Standard deviation as a function CRC for detector using standard MPH events (no Compton scattering information used). Five MPH configurations were used and curves are normalized to the same measuring time.
the configurations in the sense that it results in the highest variance at the same CRC. This is due to the relatively low sensitivity of the proposed detector. This limitation can be greatly reduced if one also uses the non-Compton events. In practice, the sensitivity for Compton scattering events may also be improved by having thicker Si detector and better angular coverage for the scattered photons. These may further improve the performance of the proposed detector.
Fig. 9. Standard deviation as a function CRC for detector using 100% CSE events. Five MPH configurations were used (number on curves indicates the number of pinholes in the collimator) and curves are normalized to the same counts in the data.
Fig. 10. Standard deviation as a function CRC for detector using 100% CSE events. Five MPH configurations were used and curves are normalized to the same measuring time.
spread wider to the entire source object space. Therefore the en-ergy left within the region surrounding the peak is reduced. To keep the CRC value unchanged, the FWHM of the LIR need to be reduced. These results provided some interesting indications about the limitations of this approach.
• Using CRC (or more precisely, any single-variate index, including FWHM and FWTM) in resolution-variance tradeoff study could lead to biased results because it can not fully represent the point-spread function.
• The change in the shape of the LIR implies differences in the so-called “noise structure” or covariance in the images. This is not taken into account in the resolution-variance tradeoff studies. Other detector performance indices, such as observer performance may be desired.
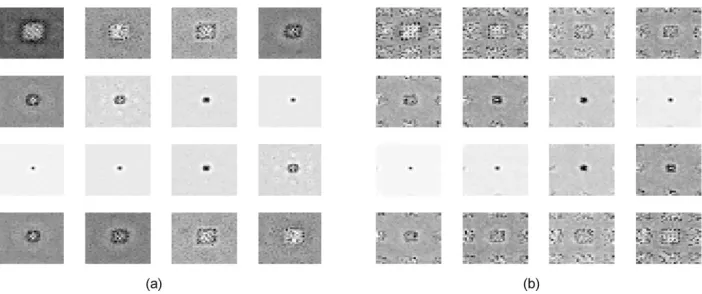
[image:7.612.48.281.305.486.2]For example, comparing variance at a given resolution (CRC) leads to the conclusion that a 25 pinhole MPH detector is better than the 121 pinhole CSE detector using only Compton scat-tered events. However, both reconstructed images (Fig. 12) and
Fig. 11. Comparison between the “best” MPH and CSE detectors.
TABLE III
IMAGEPROPERTY AT THECENTER OF THERECONSTRUCTEDIMAGE
corresponding LIRs (Fig. 13) showed that the latter suffers much less from noise propagation. Although with higher variance, the reconstruction has better reproduction of the low-activity region and attractive visual appearance. It is, therefore, important to optimize the detector performance using criteria that take into account both variance and covariance in the reconstructed im-ages.
V. CONCLUSION ANDDISCUSSIONS
We presented a comparative study between the standard mul-tiple pinhole detector and the Compton-scattering-enhanced multiple pinhole detector. The results achieved are summarized as follows.
• The proposed CSE detector design results in an improved imaging performance compared with standard MPH de-tectors.
• It provides not only lower variance but also lower covari-ance in the image. This should be beneficial for both de-tection and quantification tasks.
• In order to compensate for the low probability of detecting Compton scattered events, one needs to use collimator with relatively large open fraction and make use of those non-Compton events.
Fig. 12. Comparing reconstructed image with data collected using (a) the 121 pinhole CSE detector and (b) 25 pinhole MPH detector. The same measuring time was used and CRC was kept to 0.3 at image center for both images. The operating points for both reconstructions are shown in Fig. 11.
Fig. 13. Comparing the LIRs at image center for (a) the 121 pinhole CSE detector and (b) 25 pinhole MPH detector. The same measuring time was used and CRC was kept to 0.3. The operating points for both reconstructions are shown in Fig. 11.
diagonal matrix out of the FIM [see (10)]. It is also pos-sible to use the Monte Carlo integration techniques [20], [21] to calculate the FIM. When the calculation involves a complicated detector system, this approach would be a valuable alternative.
The results presented also highlighted the limitations of using variance-resolution tradeoff for detector optimizations. Corre-lating the results from this calculation with that from task-based observer study is a topic worth effort, because the later also takes into account the covariance or so called “noise structure” in the image. It has been shown that the chanalized hotelling ob-server (CHO) [22], [23] can also be related to human obob-server response. Therefore, it would be highly desirable to compare detector performances using CHO study if one can incorporate a more realistic imaging task.
REFERENCES
[1] B. M. W. Tusi and G. T. Gillberg et al., “Design and clinical utility of a fan beam collimator for SPECT imaging of the head,” J. Nucl. Med., vol. 27, pp. 810–819, 1986.
[2] R. J. Jaszczak and C. E. Floyd et al., “Cone beam collimation for single photon-emission computed-tomography,” Med. Phys. Biol., vol. 37, pp. 507–534, 1992.
[3] H. H. Barrett and W. Swindell, Radiological Imaging. New York: Aca-demic, 1981, ch. 8.
[4] S. R. Meikle and R. R. Fulton et al., “An investigation of coded aperture imaging for small animal SPECT,” IEEE Trans. Nucl. Sci., vol. 48, pp. 816–821, June 2001.
[5] J. W. LeBlanc and N. H. Clinthorne et al., “C-SPRINT: a prototype Compton camera system for low energy gamma ray imaging,” IEEE
Trans, Nucl. Sci., vol. 45, pp. 943–949, June 1998.
[6] C. H. Hua, N. H. Clinthorne, S. J. Wilderman, J. W. LeBlanc, and W. L. Rogers, “Quantitative evaluation of information loss for Compton cam-eras,” IEEE Trans. Nucl. Sci., vol. 46, pp. 587–593, June 1999. [7] A. Uritani, N. H. Clinthorne, and J. E. Gormley,
“Electronically-col-limated gamma camera with a parallel plate collimator for Tc-99 m imaging,” IEEE Trans. Nucl. Sci., vol. 44, pp. 894–898, June 1997. [8] J. Qi, R. M. Leahy, S. R. Cherry, A. Chatziioannou, and T. H. Farquhar,
“High resolution 3D Bayesian image reconstruction using MicorPET small animal scanner,” Phys. Med. Biol., vol. 43, no. 4, pp. 1001–1013, 1998.
[9] J. Y. Qi, R. M. Leahy, C. Hsu, T. H. Farquhar, and S. R. Cherry, “Fully 3D Bayesian image reconstruction for ECAT EXACT HR+,” IEEE Trans.
Nucl. Sci., vol. 45, pp. 1096–1103, June 1998.
[10] S. D. Metzler, J. E. Bowsher, K. L. Greer, and R. J. Jaszczak, “Analytic determination of the pinhole collimator’s point-spread function and rms resolution with penetration,” IEEE Trans. Med. Imaging, vol. 21, pp. 878–887, Aug. 2002.
[11] H. H. Barrett, J. Denny, R. Wagner, and K. Myers, “Objective assessment of image quality II: Fisher information, Fourier crosstalk and figure of merit for task performance,” J. Opt. Soc. Amer. A, vol. 12, pp. 834–852, 1995.
[12] A. O. Hero, J. A. Fessler, and M. Usman, “Exploring estimator bias-variance tradeoffs using the uniform CR bound,” IEEE Trans. Signal
Processing, vol. 44, pp. 2026–2041, Aug. 1996.
[13] A. Hero and J. A. Fessler, “A recursive algorithm for computing Cramer-Rao-type bounds on estimator covariance,” IEEE Trans. Info.
Theory, vol. 40, pp. 1205–1212, 1994.
[14] J. A. Fessler, “Mean and variance of implicitly defined biased estimator (such as penalized maximum likelihood): Application to tomography,”
IEEE Trans. Image Processing, vol. 5, pp. 493–506, Mar. 1996.
[15] J. A. Fessler and W. L. Rogers, “Spatial resolution properties of pe-nalized-likelihood image reconstruction: Space-invariant tomographs,”
IEEE Trans. Image Processing, vol. 5, pp. 1346–1358, Sept. 1996.
[16] J. A. Fessler and S. D. Booth, “Conjugate-gradient preconditioning methods for shift-variant PET image reconstruction,” IEEE Trans.
[image:8.612.122.473.243.390.2][17] J. Y. Qi, “A theoretical study of the contrast recovery and variance of MAP reconstructions from PET data,” IEEE Trans. Med. Imaging, vol. 18, pp. 293–305, 1999.
[18] J. Y. Qi and R. M. Leahy, “Resolution and noise properties of MAP reconstruction for fully 3-D PET,” IEEE Trans. Med. Imaging, vol. 19, pp. 493–506, May 2000.
[19] J. W. Stayman and J. A. Fessler, “Efficient calculation of resolution and covariance for fully-3D SPECT,” IEEE Trans. Med. Imaging, vol. 19, pp. 601–615, June 2003.
[20] L. Parra and H. H. Barrett, “List-mode likelihood: EM algorithm and image quality estimation demonstrated on 2-D PET,” IEEE Trans. Med.
Imaging, vol. 17, pp. 228–235, Apr. 1998.
[21] Numerical Recipes in C, Cambridge Univ. Press, Cambridge, U.K., ch. 7.
[22] H. H. Barrett, T. Gooley, and K. Girodias, “Linear discriminants and image quality,” Image Vision Comput., vol. 10, pp. 451–460, 1992. [23] R. D. Fiete, H. H. Barrett, and W. E. Smith, “Hotelling trace criterion and