R E S E A R C H A R T I C L E
Open Access
Systematic review of quantitative imaging
biomarkers for neck and shoulder
musculoskeletal disorders
Judith E. Gold
1,5*, David M. Hallman
1, Fredrik Hellström
1, Martin Björklund
1,2, Albert G. Crenshaw
1,
Svend Erik Mathiassen
1, Mary F. Barbe
3and Sayed Ali
4Abstract
Background:
This study systematically summarizes quantitative imaging biomarker research in non-traumatic neck
and shoulder musculoskeletal disorders (MSDs). There were two research questions: 1) Are there quantitative imaging
biomarkers associated with the presence of neck and shoulder MSDs?, 2) Are there quantitative imaging biomarkers
associated with the severity of neck and shoulder MSDs?
Methods:
PubMed and SCOPUS were used for the literature search. One hundred and twenty-five studies met primary
inclusion criteria. Data were extracted from 49 sufficient quality studies.
Results:
Most of the 125 studies were cross-sectional and utilized convenience samples of patients as both cases and
controls. Only half controlled for potential confounders via exclusion or in the analysis. Approximately one-third reported
response rates. In sufficient quality articles, 82% demonstrated at least one statistically significant association between
the MSD(s) and biomarker(s) studied. The literature synthesis suggested that neck muscle size may be decreased in neck
pain, and trapezius myalgia and neck/shoulder pain may be associated with reduced vascularity in the trapezius
and reduced trapezius oxygen saturation at rest and in response to upper extremity tasks. Reduced vascularity in
the supraspinatus tendon may also be a feature in rotator cuff tears. Five of eight studies showed an association
between a quantitative imaging marker and MSD severity.
Conclusions:
Although research on quantitative imaging biomarkers is still in a nascent stage, some MSD biomarkers
were identified. There are limitations in the articles examined, including possible selection bias and inattention to
potentially confounding factors. Recommendations for future studies are provided.
Keywords:
MRI, MSD, Near-infrared spectroscopy, Pain, Ultrasound
Background
Soft tissue neck and shoulder musculoskeletal disorders
(MSDs), namely, disorders of the muscles, tendons,
liga-ments, nerves, or blood vessels, are prevalent worldwide
[1
–
4], are a common cause of work absence and
disabi-lity [5], and impose a sizeable societal economic burden
[1, 3, 4, 6
–
11].
Most options for screening, surveillance and diagnosis
of proximal upper extremity MSDs depend on symptoms.
Improved diagnostic and screening methods, especially
objective techniques, are needed [12, 13]. A biomarker has
been defined as
“
a characteristic that is objectively
mea-sured and evaluated as an indicator of normal biologic
processes, pathogenic processes, or pharmacologic
re-sponses to a therapeutic intervention
”
[14]. Quantitative
medical imaging techniques are increasingly used in
clin-ical practice and MSD research, and enable detection of
potential MSD biomarkers, including functional and
mor-phological changes. The Quantitative Imaging Biomarkers
Alliance and the Terminology Working Group define a
quantitative imaging biomarker as
“
an objective
characte-ristic derived from an in vivo image measured on a ratio
or interval scale as an indicator of normal biological
* Correspondence:JudithEGold@gmail.com 1
Centre for Musculoskeletal Research, Department of Occupational and Public Health Sciences, University of Gävle, Gävle, Sweden
5Gold Standard Research Consulting, 830 Montgomery Ave, Bryn Mawr, PA, USA
Full list of author information is available at the end of the article
© The Author(s). 2017Open AccessThis article is distributed under the terms of the Creative Commons Attribution 4.0
processes, pathogenic processes or a response to a
thera-peutic intervention
”
[15]. Valid and reliable biomarkers
could improve diagnosis and screening methods [16] and
provide objective means to evaluate medical treatments
and workplace interventions. Use of such biomarkers may
also elucidate MSD pathomechanisms.
Three biomarkers classes are conventionally described:
exposure, effect (disease), and susceptibility [17]. Herein,
we have reviewed biomarkers of effect, defined as
“
any
change that is qualitatively or quantitatively predictive of
health impairment or potential impairment
…”
[17].
Through measurement of biomarkers of effect,
patho-physiological processes may be illuminated and used to
stage MSD severity, such as early biomarkers that
pre-cede disease diagnosis versus late biomarkers in already
diagnosed subjects.
Previous biomarker reviews
Prior reviews on this topic include a pioneering paper
highlighting the potential for MSD biomarkers to detect
subclinical disease and monitor MSD severity [18], and a
later MSD review article [19] focused on biochemical
markers. Neither paper mentioned medical imaging. Our
recent systematic review also focused on biochemical
biomarkers in MSDs [20]. To our knowledge, there have
been no published reviews of quantitative imaging
bio-markers in neck and shoulder MSDs.
The purpose of this systematic review was to conduct
a comprehensive assessment of quantitative imaging
bio-markers in neck and shoulder MSDs. We aimed to
an-swer the following two research questions:
1. Are there quantitative imaging biomarkers associated
with the presence of neck and shoulder MSDs?
2. Are there quantitative imaging biomarkers associated
with the severity of neck and shoulder MSDs?
Methods
Review team and process overview.
Our review team
consisted of eight researchers with expertise in
musculo-skeletal radiology and in epidemiologic, intervention and
experimental studies, including studies on
pathome-chanisms within the field of work-related MSD research.
The review process was as follows: 1) research questions
were formulated; 2) principal concepts of the review
were defined; 3) a search strategy and terms were
devel-oped (Additional file 1); 4) PubMed and Scopus
data-bases were searched, with results pooled with articles
identified from the authors
’
files; 5) identified papers
were screened based on pre-defined criteria (Additional
files 1, 2 and 3) using a two-step procedure of primary
(title and abstract) and secondary (quality) screens; 6)
summary tables were created from sufficient quality
pa-pers; and 7) evidence was synthesized with respect to
the two research questions. A consensus process was
used throughout the review process. See Gold et al. for
further details [20].
Neck and shoulder MSDs
were defined as clinical
diagnoses or musculoskeletal symptoms in the neck
and shoulder region. These included both specific and
non-specific conditions related to muscles, tendons,
nerves, blood vessels or ligaments [21]. The scope of
this review encompassed MSDs that occur in a
work-related context [22].
Quantitative imaging biomarker
was defined as an
ob-jective characteristic derived from an in vivo image or
from an in vivo signal captured in response to
electro-magnetic radiation to detect morphology or function,
measured on a ratio or interval scale as an indicator of
normal biological or pathogenic processes [15]. We have
focused on minimally invasive/non-invasive methods.
Potential quantitative imaging biomarkers could be
de-rived through MRI, ultrasound, far infrared
thermog-raphy, near infrared spectroscopy (NIRS), laser Doppler
flowmetry, and other modalities. Thus, for example,
muscle oxygenation as measured through NIRS was
in-cluded in this review. Because plain radiographs (x-rays)
are best utilized in evaluating bone abnormalities and
have poor contrast resolution, this imaging modality is
not routinely indicated in soft tissue evaluation [23
–
26].
Thus, studies using only plain radiography were
ex-cluded from this review.
Severity
was operationalized as encompassing
longitu-dinal and cross-sectional differences in symptoms.
Inclusion criteria.
The current review was limited to
studies on adults (age > 18 years) with non-traumatic
neck and shoulder MSDs, published between June 4,
1988 and October 14, 2016 and written in English
lan-guage. Potential biomarkers were examined for the
fol-lowing specific MSDs, as categorized by Boocock, et al.
[21]: rotator cuff syndrome/shoulder tendonitis,
shoul-der capsulitis and thoracic outlet syndrome. Other
spe-cific MSDs included are listed in Boocock, et al. [21]
Table 2, although status post-whiplash, cervico-brachial
fibromyalgia, and joint-related conditions were excluded.
Upper extremity non-specific regional pain, namely,
“
neck pain
”
,
“
shoulder pain
”
, and
“
neck/shoulder pain
”
,
was also included. We included articles that met our
in-clusion criteria, even if some parts of the study were
consistent with the exclusion criteria; however, only
re-sults in compliance with our criteria were included.
Exclusion criteria
are summarized in Additional file 2.
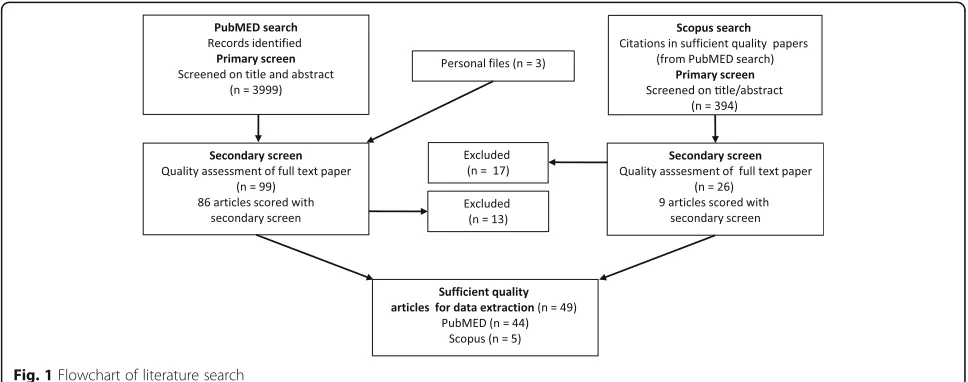
Literature search
conducted using Scopus. Additional file 1 provides an
overview of the search strategy, while Fig. 1 illustrates
the overall search strategy and selection procedure.
PubMed search terms included both MESH terms and
key words selected for two categories: neck and shoulder
MSDs, and biomarkers. Search terms within each
cat-egory were combined using the
“
OR
”
operator, while
search terms between categories were combined using
“
AND
”
. A systematic procedure was carried out for
se-lection of appropriate MESH terms and key words,
where each search term was entered by a step-wise
pro-cedure. Fifteen articles were identified by the review
team and used for refining the search and testing its
sen-sitivity. See Additional file 4 for the search string.
A total of 4002 articles were examined by members of
the review team. The final PubMed search resulted in
3999 articles; three additional papers were added from
the team members
’
personal files. Primary and secondary
screens were implemented (see below and Additional
files 1, 2 and 3). The Scopus search identified recently
published articles in PubMed that still lacked assigned
MESH terms. Since a PubMed search may miss relevant
studies in other databases, the Scopus search reduced
this potential search strategy bias. To assure clarity and
limit reviewer bias, pilot testing of evaluation criteria
was conducted at each stage of the review process.
Primary screen-selection of articles
The primary screen was conducted by two independent
reviewers assessing each title and abstract for eligibility
based on inclusion and exclusion criteria (Additional
file 2), after importing all records from PubMed into
systematic review software (EPPI-reviewer4 v4.3.4,
EPPI-Centre, Social Science Research Unit, Institute of
Education, University of London, UK). The full text was
read if necessary. A
“
yes
”
answer on any question in
Additional file 2 resulted in article exclusion. Results
were compared between reviewers, and consensus
agreement was reached in all cases (with input from a
third person in case of disagreement between
re-viewers). The same procedure was repeated for articles
from personal files and articles found in Scopus.
Secondary screen-quality assessment and data extraction
All articles passing the primary screen were scored for
quality by five review team members. The articles were
randomly allocated to five different clusters; each
reviewer was assigned randomly to two of these clusters.
In the quality screen, each article was assessed by two
independent reviewers, scores were compared, and a
consensus agreement was reached after discussing
disagreements (using a third reviewer as needed).
Additional file 3 lists questions used for the quality
as-sessment. These questions were derived from reporting
guidelines and checklists for quality assessment in
health-related research studies [27
–
31]. Seventeen items
were included in the scoring system, with each item
scored as either
“
yes
”
(1 point),
“
unknown or not
appli-cable
”
(0) or
“
no
”
(0). Scores were summed for each
paper (range: 0
–
17). Articles scoring at or above 70% of
the maximum (12/17) were labeled as
“
sufficient quality
”
and were included for data extraction. Articles scoring
“
no
”
on question 15 were excluded from data extraction.
These included papers with less than appropriate
statis-tical analysis methods, such as multiple comparisons
without adjustment, and modeling without accounting
for repeated measures. Data extraction items are listed
in Additional file 5.
Research synthesis
Ulitizing a best evidence synthesis approach, we
evalu-ated the number of sufficient quality articles in order to
[image:3.595.56.540.535.726.2]identify a particular biomarker or class of biomarkers in
their potential association with MSD(s) [32].
Consider-ing the biomarker heterogeneity, it was not possible to
conduct a meta-analysis. However, it was possible to
group results according to the MSD, and then by
physio-logical process or morphology, e.g., hemodynamic and/
or oxygenation indicators or muscle dimensions, within
diagnoses or symptom designations. An association
be-tween a biomarker and an MSD in three or more
suffi-cient quality studies (and at most one suffisuffi-cient quality
study with a null finding) was regarded as evidence that
an indicator could serve as a MSD quantitative imaging
biomarker. We did not design our review to present
dif-ferent levels of evidence.
Results
Of the 3999 articles identified through the PubMed
(pri-mary) search (Fig. 1), and the three papers added from
authors
’
files, 99 met secondary screening criteria. Ten
papers were excluded after reading the entire article, and
three eliminated due to inadequate statistical methods,
leaving 86 articles to be scored in the secondary (quality)
screen. Forty-four of these met the sufficient quality
cri-teria score. The Scopus database search of these 44
suffi-cient quality papers yielded 394 citations of which 26
were determined to be non-duplicates and relevant
through title and abstract review. Seventeen were
elimi-nated at the secondary screening stage after reading the
entire article. Nine articles were scored during the
sec-ondary screen, although one was eliminated from data
extraction for less than appropriate statistical methods.
Of the remaining Scopus identified articles, five scored
at
≥
12. These five were added to the 44 PubMed
identi-fied and similarly scored articles. Thus, 49 studies were
regarded to be of sufficient quality for data extraction.
Secondary screen-quality assessment overview
Additional file 6 shows quality scores of all papers that
had undergone secondary screening (
n
= 96; 86 from
PubMed and 9 from Scopus). The majority had clearly
defined aims, biomarkers, MSDs, and results. All but
two unique studies (one longitudinal cohort represented
by [33
–
35] and the other by [36]) had a cross-sectional
design, and most utilized convenience samplings of
pa-tients, for both cases and referents. Just over half of the
studies controlled for confounding factors through
ex-clusion to a particular age or gender, or through a
statis-tical adjustment in the analysis. Thirty-four studies
(37%) explicitly stated that those analyzing biomarkers
were blinded to case status.
Data extraction from sufficient quality studies
Additional file 7 gives a descriptive overview of the
in-cluded studies. The bulk of sufficient quality studies
examined neck pain, rotator cuff tears, and trapezius
myalgia and other neck/shoulder pain conditions. No
sufficient quality studies examined thoracic outlet
syn-drome. Approximately three-quarters (19/25) of the
shoulder disorder studies were conducted in populations
with at least one analysis group having an average age of
≥
50 years. In contrast, the mean age by analysis groups
in the neck pain studies ranged from 22 to 34 years,
while the mean age in neck/shoulder studies ranged
from 23 to 48 years.
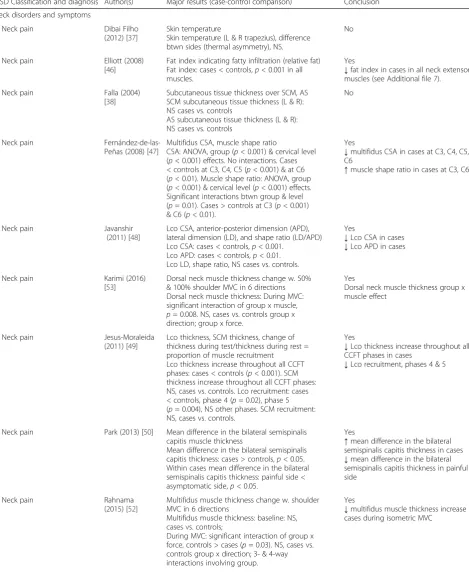
Are there quantitative imaging biomarkers associated
with the presence of neck and shoulder MSDs?
The majority of studies demonstrated an association
be-tween at least one biomarker and the MSD(s) examined
(Table 1). Only 9/49 (18%) studies reported insignificant
findings throughout [37
–
45].
Neck pain (10 studies)
Ten studies examined neck pain [37, 38, 46
–
53].
De-creased muscle dimensions were observed in cases in
the cervical multifidus during rest [47]. In Rahnama et
al. [52], no difference in multifidus muscle thickness was
observed during baseline, but there was a smaller
in-crease in cases than in controls in muscle thickness from
baseline values during isometric maximum voluntary
contraction (MVC). An increased muscle shape ratio
(ratio between lateral and anterior-posterior dimensions)
was seen in the multifidus of cases [47]. Reduced muscle
dimensions were also observed in the longus colli
[48, 49], and in the semispinalis capitis on cases
’
painful
side [50]. Dorsal neck muscle thickness change from rest
to MVC was different in neck pain cases than in
con-trols, with a tendency toward increased semispinalis
capitis thickness in controls, and increased semispinalis
cervicis thickness in cases [53]. There was no difference
in subcutaneous tissue thickness above the
sternocleido-mastoid or anterior scalene muscles [38].
Greater serratus anterior muscle activity, measured
using fMRI, was observed at thoracic vertebral level 6 in
cases [51]. However, less longus colli recruitment,
mea-sured by muscle thickness, was found at the greatest
flexion angle during incremental nodding [49]. Elliott et
al. [46] detected less fat infiltration in neck extensors in
neck pain vs. whiplash patients. No difference in
trapez-ius skin temperature, or temperature asymmetry
be-tween the left and right trapezii was observed in neck
pain vs. controls [37].
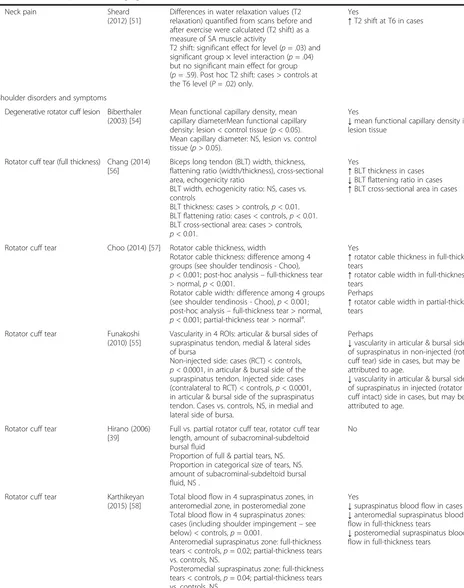
Rotator cuff tear (11 studies)
Table 1
Are there quantitative imaging biomarkers associated with the presence of neck and shoulder MSDs?
MSD Classification and diagnosis Author(s) Major results (case-control comparison) Conclusion
Neck disorders and symptoms
Neck pain Dibai Filho
(2012) [37]
Skin temperature
Skin temperature (L & R trapezius), difference btwn sides (thermal asymmetry), NS.
No
Neck pain Elliott (2008) [46]
Fat index indicating fatty infiltration (relative fat) Fat index: cases < controls,p< 0.001 in all muscles.
Yes
↓fat index in cases in all neck extensor muscles (see Additional file7).
Neck pain Falla (2004) [38]
Subcutaneous tissue thickness over SCM, AS SCM subcutaneous tissue thickness (L & R): NS cases vs. controls
AS subcutaneous tissue thickness (L & R): NS cases vs. controls
No
Neck pain Fernández-de-las-Peñas (2008) [47]
Multifidus CSA, muscle shape ratio
CSA: ANOVA, group (p< 0.001) & cervical level (p< 0.001) effects. No interactions. Cases < controls at C3, C4, C5 (p< 0.001) & at C6 (p< 0.01). Muscle shape ratio: ANOVA, group (p< 0.001) & cervical level (p< 0.001) effects. Significant interactions btwn group & level (p= 0.01). Cases > controls at C3 (p< 0.001) & C6 (p< 0.01).
Yes
↓multifidus CSA in cases at C3, C4, C5, C6
↑muscle shape ratio in cases at C3, C6
Neck pain Javanshir
(2011) [48]
Lco CSA, anterior-posterior dimension (APD), lateral dimension (LD), and shape ratio (LD/APD) Lco CSA: cases < controls,p< 0.001.
Lco APD: cases < controls,p< 0.01. Lco LD, shape ratio, NS cases vs. controls.
Yes
↓Lco CSA in cases
↓Lco APD in cases
Neck pain Karimi (2016) [53]
Dorsal neck muscle thickness change w. 50% & 100% shoulder MVC in 6 directions Dorsal neck muscle thickness: During MVC: significant interaction of group x muscle, p= 0.008. NS, cases vs. controls group x direction; group x force.
Yes
Dorsal neck muscle thickness group x muscle effect
Neck pain Jesus-Moraleida (2011) [49]
Lco thickness, SCM thickness, change of thickness during test/thickness during rest = proportion of muscle recruitment
Lco thickness increase throughout all CCFT phases: cases < controls (p< 0.001). SCM thickness increase throughout all CCFT phases: NS, cases vs. controls. Lco recruitment: cases < controls, phase 4 (p= 0.02), phase 5 (p= 0.004), NS other phases. SCM recruitment: NS, cases vs. controls.
Yes
↓Lco thickness increase throughout all CCFT phases in cases
↓Lco recruitment, phases 4 & 5
Neck pain Park (2013) [50] Mean difference in the bilateral semispinalis capitis muscle thickness
Mean difference in the bilateral semispinalis capitis thickness: cases > controls,p< 0.05. Within cases mean difference in the bilateral semispinalis capitis thickness: painful side < asymptomatic side,p< 0.05.
Yes
↑mean difference in the bilateral semispinalis capitis thickness in cases
↓mean difference in the bilateral semispinalis capitis thickness in painful side
Neck pain Rahnama
(2015) [52]
Multifidus muscle thickness change w. shoulder MVC in 6 directions
Multifidus muscle thickness: baseline: NS, cases vs. controls;
During MVC: significant interaction of group x force, controls > cases (p= 0.03). NS, cases vs. controls group x direction; 3- & 4-way interactions involving group.
Yes
(Continued)
Neck pain Sheard
(2012) [51]
Differences in water relaxation values (T2 relaxation) quantified from scans before and after exercise were calculated (T2 shift) as a measure of SA muscle activity
T2 shift: significant effect for level (p= .03) and significant group × level interaction (p= .04) but no significant main effect for group (p= .59). Post hoc T2 shift: cases > controls at the T6 level (P= .02) only.
Yes
↑T2 shift at T6 in cases
Shoulder disorders and symptoms
Degenerative rotator cuff lesion Biberthaler (2003) [54]
Mean functional capillary density, mean capillary diameterMean functional capillary density: lesion < control tissue (p< 0.05). Mean capillary diameter: NS, lesion vs. control tissue (p> 0.05).
Yes
↓mean functional capillary density in lesion tissue
Rotator cuff tear (full thickness) Chang (2014) [56]
Biceps long tendon (BLT) width, thickness, flattening ratio (width/thickness), cross-sectional area, echogenicity ratio
BLT width, echogenicity ratio: NS, cases vs. controls
BLT thickness: cases > controls,p< 0.01. BLT flattening ratio: cases < controls,p< 0.01. BLT cross-sectional area: cases > controls, p< 0.01.
Yes
↑BLT thickness in cases
↓BLT flattening ratio in cases
↑BLT cross-sectional area in cases
Rotator cuff tear Choo (2014) [57] Rotator cable thickness, width
Rotator cable thickness: difference among 4 groups (see shoulder tendinosis - Choo), p< 0.001; post-hoc analysis–full-thickness tear > normal,p< 0.001.
Rotator cable width: difference among 4 groups (see shoulder tendinosis - Choo),p< 0.001; post-hoc analysis–full-thickness tear > normal, p< 0.001; partial-thickness tear > normala.
Yes
↑rotator cable thickness in full-thickness tears
↑rotator cable width in full-thickness tears
Perhaps
↑rotator cable width in partial-thickness tears
Rotator cuff tear Funakoshi (2010) [55]
Vascularity in 4 ROIs: articular & bursal sides of supraspinatus tendon, medial & lateral sides of bursa
Non-injected side: cases (RCT) < controls, p< 0.0001, in articular & bursal side of the supraspinatus tendon. Injected side: cases (contralateral to RCT) < controls,p< 0.0001, in articular & bursal side of the supraspinatus tendon. Cases vs. controls, NS, in medial and lateral side of bursa.
Perhaps
↓vascularity in articular & bursal sides of supraspinatus in non-injected (rotator cuff tear) side in cases, but may be attributed to age.
↓vascularity in articular & bursal sides of supraspinatus in injected (rotator cuff intact) side in cases, but may be attributed to age.
Rotator cuff tear Hirano (2006) [39]
Full vs. partial rotator cuff tear, rotator cuff tear length, amount of subacrominal-subdeltoid bursal fluid
Proportion of full & partial tears, NS. Proportion in categorical size of tears, NS. amount of subacrominal-subdeltoid bursal fluid, NS .
No
Rotator cuff tear Karthikeyan (2015) [58]
Total blood flow in 4 supraspinatus zones, in anteromedial zone, in posteromedial zone Total blood flow in 4 supraspinatus zones: cases (including shoulder impingement–see below) < controls,p= 0.001.
Anteromedial supraspinatus zone: full-thickness tears < controls,p= 0.02; partial-thickness tears vs. controls, NS.
Posteromedial supraspinatus zone: full-thickness tears < controls,p= 0.04; partial-thickness tears vs. controls, NS.
Yes
↓supraspinatus blood flow in cases
↓anteromedial supraspinatus blood flow in full-thickness tears
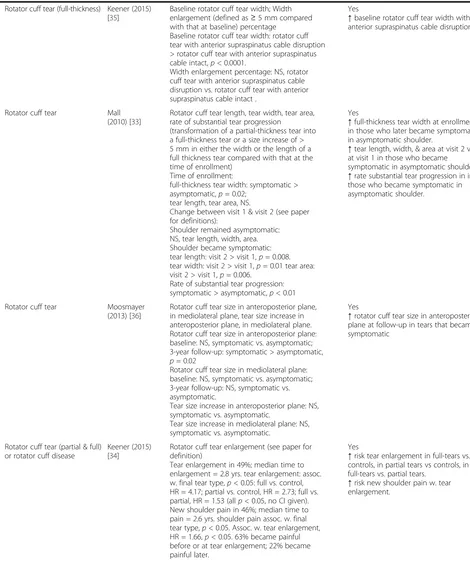
[image:6.595.60.524.97.685.2]Table 1
Are there quantitative imaging biomarkers associated with the presence of neck and shoulder MSDs?
(Continued)
Rotator cuff tear (full-thickness) Keener (2015) [35]
Baseline rotator cuff tear width; Width enlargement (defined as≥5 mm compared with that at baseline) percentage
Baseline rotator cuff tear width: rotator cuff tear with anterior supraspinatus cable disruption > rotator cuff tear with anterior supraspinatus cable intact,p< 0.0001.
Width enlargement percentage: NS, rotator cuff tear with anterior supraspinatus cable disruption vs. rotator cuff tear with anterior supraspinatus cable intact .
Yes
↑baseline rotator cuff tear width with anterior supraspinatus cable disruption.
Rotator cuff tear Mall (2010) [33]
Rotator cuff tear length, tear width, tear area, rate of substantial tear progression
(transformation of a partial-thickness tear into a full-thickness tear or a size increase of > 5 mm in either the width or the length of a full thickness tear compared with that at the time of enrollment)
Time of enrollment:
full-thickness tear width: symptomatic > asymptomatic,p= 0.02;
tear length, tear area, NS.
Change between visit 1 & visit 2 (see paper for definitions):
Shoulder remained asymptomatic: NS, tear length, width, area. Shoulder became symptomatic: tear length: visit 2 > visit 1,p= 0.008. tear width: visit 2 > visit 1,p= 0.01 tear area: visit 2 > visit 1,p= 0.006.
Rate of substantial tear progression: symptomatic > asymptomatic,p< 0.01
Yes
↑full-thickness tear width at enrollment in those who later became symptomatic in asymptomatic shoulder.
↑tear length, width, & area at visit 2 vs. at visit 1 in those who became symptomatic in asymptomatic shoulder.
↑rate substantial tear progression in in those who became symptomatic in asymptomatic shoulder.
Rotator cuff tear Moosmayer (2013) [36]
Rotator cuff tear size in anteroposterior plane, in mediolateral plane, tear size increase in anteroposterior plane, in mediolateral plane. Rotator cuff tear size in anteroposterior plane: baseline: NS, symptomatic vs. asymptomatic; 3-year follow-up: symptomatic > asymptomatic, p= 0.02
Rotator cuff tear size in mediolateral plane: baseline: NS, symptomatic vs. asymptomatic; 3-year follow-up: NS, symptomatic vs. asymptomatic.
Tear size increase in anteroposterior plane: NS, symptomatic vs. asymptomatic.
Tear size increase in mediolateral plane: NS, symptomatic vs. asymptomatic.
Yes
↑rotator cuff tear size in anteroposterior plane at follow-up in tears that became symptomatic
Rotator cuff tear (partial & full) or rotator cuff disease
Keener (2015) [34]
Rotator cuff tear enlargement (see paper for definition)
Tear enlargement in 49%; median time to enlargement = 2.8 yrs. tear enlargement: assoc. w. final tear type,p< 0.05: full vs. control, HR = 4.17; partial vs. control, HR = 2.73; full vs. partial, HR = 1.53 (allp< 0.05, no CI given). New shoulder pain in 46%; median time to pain = 2.6 yrs. shoulder pain assoc. w. final tear type,p< 0.05. Assoc. w. tear enlargement, HR = 1.66,p< 0.05. 63% became painful before or at tear enlargement; 22% became painful later.
Yes
↑risk tear enlargement in full-tears vs. controls, in partial tears vs controls, in full-tears vs. partial tears.
(Continued)
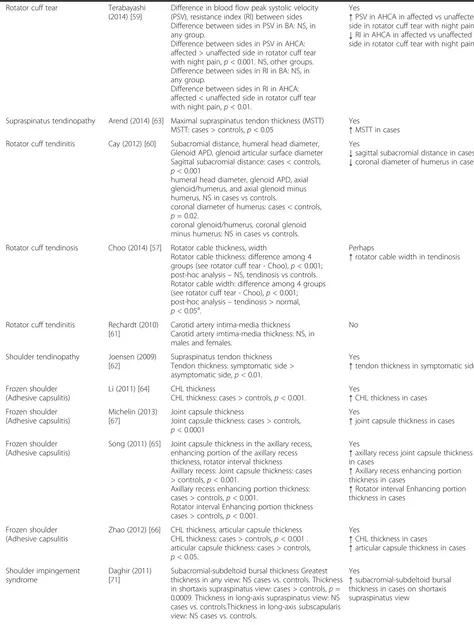
Rotator cuff tear Terabayashi (2014) [59]
Difference in blood flow peak systolic velocity (PSV), resistance index (RI) between sides Difference between sides in PSV in BA: NS, in any group.
Difference between sides in PSV in AHCA: affected > unaffected side in rotator cuff tear with night pain,p< 0.001. NS, other groups. Difference between sides in RI in BA: NS, in any group.
Difference between sides in RI in AHCA: affected < unaffected side in rotator cuff tear with night pain,p< 0.01.
Yes
↑PSV in AHCA in affected vs unaffected side in rotator cuff tear with night pain.
↓RI in AHCA in affected vs unaffected side in rotator cuff tear with night pain.
Supraspinatus tendinopathy Arend (2014) [63] Maximal supraspinatus tendon thickness (MSTT) MSTT: cases > controls,p< 0.05
Yes
↑MSTT in cases Rotator cuff tendinitis Cay (2012) [60] Subacromial distance, humeral head diameter,
Glenoid APD, glenoid articular surface diameter Sagittal subacromial distance: cases < controls, p< 0.001
humeral head diameter, glenoid APD, axial glenoid/humerus, and axial glenoid minus humerus, NS in cases vs controls.
coronal diameter of humerus: cases < controls, p= 0.02.
coronal glenoid/humerus, coronal glenoid minus humerus: NS in cases vs controls.
Yes
↓sagittal subacromial distance in cases
↓coronal diameter of humerus in cases
Rotator cuff tendinosis Choo (2014) [57] Rotator cable thickness, width
Rotator cable thickness: difference among 4 groups (see rotator cuff tear - Choo),p< 0.001; post-hoc analysis–NS, tendinosis vs controls. Rotator cable width: difference among 4 groups (see rotator cuff tear - Choo),p< 0.001; post-hoc analysis–tendinosis > normal, p< 0.05a.
Perhaps
↑rotator cable width in tendinosis
Rotator cuff tendinitis Rechardt (2010) [61]
Carotid artery intima-media thickness Carotid artery imtima-media thickness: NS, in males and females.
No
Shoulder tendinopathy Joensen (2009) [62]
Supraspinatus tendon thickness Tendon thickness: symptomatic side > asymptomatic side,p< 0.01.
Yes
↑tendon thickness in symptomatic side
Frozen shoulder (Adhesive capsulitis)
Li (2011) [64] CHL thickness
CHL thickness: cases > controls,p< 0.001.
Yes
↑CHL thickness in cases Frozen shoulder
(Adhesive capsulitis)
Michelin (2013) [67]
Joint capsule thickness
Joint capsule thickness: cases > controls, p< 0.0001
Yes
↑joint capsule thickness in cases
Frozen shoulder (Adhesive capsulitis)
Song (2011) [65] Joint capsule thickness in the axillary recess, enhancing portion of the axillary recess thickness, rotator interval thickness Axillary recess: Joint capsule thickness: cases > controls,p< 0.001.
Axillary recess enhancing portion thickness: cases > controls,p< 0.001.
Rotator interval Enhancing portion thickness cases > controls,p< 0.001.
Yes
↑axillary recess joint capsule thickness in cases
↑Axillary recess enhancing portion thickness in cases
↑Rotator interval Enhancing portion thickness in cases
Frozen shoulder (Adhesive capsulitis
Zhao (2012) [66] CHL thickness, articular capsule thickness CHL thickness: cases > controls,p< 0.001 . articular capsule thickness: cases > controls, p< 0.05.
Yes
↑CHL thickness in cases
↑articular capsule thickness in cases
Shoulder impingement syndrome
Daghir (2011) [71]
Subacromial-subdeltoid bursal thickness Greatest thickness in any view: NS cases vs. controls. Thickness in shortaxis supraspinatus view: cases > controls,p= 0.0009. Thickness in long-axis supraspinatus view: NS cases vs. controls.Thickness in long-axis subscapularis view: NS cases vs. controls.
Yes
[image:8.595.59.533.101.726.2]Table 1
Are there quantitative imaging biomarkers associated with the presence of neck and shoulder MSDs?
(Continued)
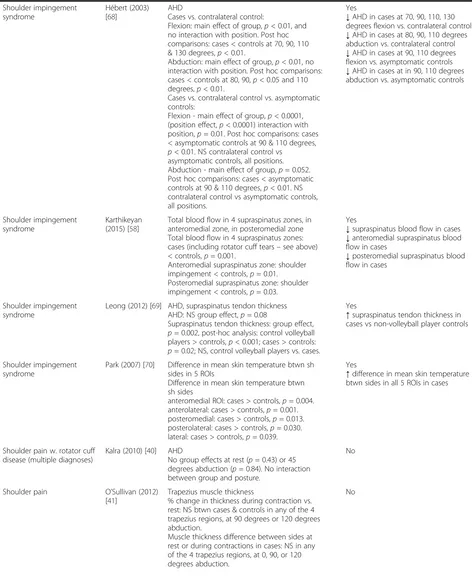
Shoulder impingement syndrome
Hébert (2003) [68]
AHD
Cases vs. contralateral control:
Flexion: main effect of group,p< 0.01, and no interaction with position. Post hoc comparisons: cases < controls at 70, 90, 110 & 130 degrees,p< 0.01.
Abduction: main effect of group,p< 0.01, no interaction with position. Post hoc comparisons: cases < controls at 80, 90,p< 0.05 and 110 degrees,p< 0.01.
Cases vs. contralateral control vs. asymptomatic controls:
Flexion - main effect of group,p< 0.0001, (position effect,p< 0.0001) interaction with position,p= 0.01. Post hoc comparisons: cases < asymptomatic controls at 90 & 110 degrees, p< 0.01. NS contralateral control vs
asymptomatic controls, all positions. Abduction - main effect of group,p= 0.052. Post hoc comparisons: cases < asymptomatic controls at 90 & 110 degrees,p< 0.01. NS contralateral control vs asymptomatic controls, all positions.
Yes
↓AHD in cases at 70, 90, 110, 130 degrees flexion vs. contralateral control
↓AHD in cases at 80, 90, 110 degrees abduction vs. contralateral control
↓AHD in cases at 90, 110 degrees flexion vs. asymptomatic controls
↓AHD in cases at in 90, 110 degrees abduction vs. asymptomatic controls
Shoulder impingement syndrome
Karthikeyan (2015) [58]
Total blood flow in 4 supraspinatus zones, in anteromedial zone, in posteromedial zone Total blood flow in 4 supraspinatus zones: cases (including rotator cuff tears–see above) < controls,p= 0.001.
Anteromedial supraspinatus zone: shoulder impingement < controls,p= 0.01. Posteromedial supraspinatus zone: shoulder impingement < controls,p= 0.03.
Yes
↓supraspinatus blood flow in cases
↓anteromedial supraspinatus blood flow in cases
↓posteromedial supraspinatus blood flow in cases
Shoulder impingement syndrome
Leong (2012) [69] AHD, supraspinatus tendon thickness AHD: NS group effect,p= 0.08
Supraspinatus tendon thickness: group effect, p= 0.002, post-hoc analysis: control volleyball players > controls,p< 0.001; cases > controls: p= 0.02; NS, control volleyball players vs. cases.
Yes
↑supraspinatus tendon thickness in cases vs non-volleyball player controls
Shoulder impingement syndrome
Park (2007) [70] Difference in mean skin temperature btwn sh sides in 5 ROIs
Difference in mean skin temperature btwn sh sides
anteromedial ROI: cases > controls,p= 0.004. anterolateral: cases > controls,p= 0.001. posteromedial: cases > controls,p= 0.013. posterolateral: cases > controls,p= 0.030. lateral: cases > controls,p= 0.039.
Yes
↑difference in mean skin temperature btwn sides in all 5 ROIs in cases
Shoulder pain w. rotator cuff disease (multiple diagnoses)
Kalra (2010) [40] AHD
No group effects at rest (p= 0.43) or 45 degrees abduction (p= 0.84). No interaction between group and posture.
No
Shoulder pain O’Sullivan (2012) [41]
Trapezius muscle thickness
% change in thickness during contraction vs. rest: NS btwn cases & controls in any of the 4 trapezius regions, at 90 degrees or 120 degrees abduction.
Muscle thickness difference between sides at rest or during contractions in cases: NS in any of the 4 trapezius regions, at 0, 90, or 120 degrees abduction.
(Continued)
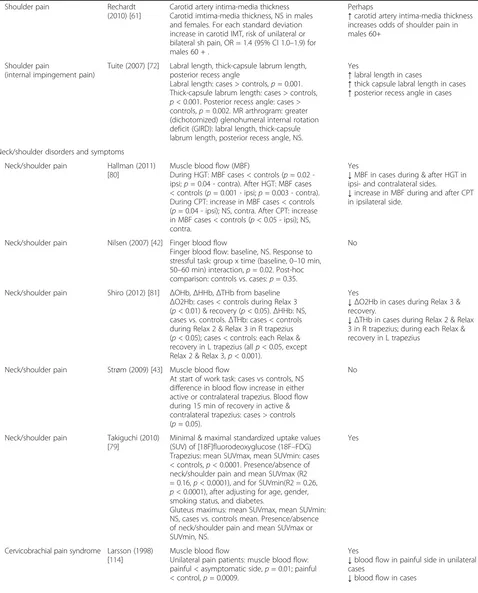
Shoulder pain Rechardt (2010) [61]
Carotid artery intima-media thickness Carotid imtima-media thickness, NS in males and females. For each standard deviation increase in carotid IMT, risk of unilateral or bilateral sh pain, OR = 1.4 (95% CI 1.0–1.9) for males 60 + .
Perhaps
↑carotid artery intima-media thickness increases odds of shoulder pain in males 60+
Shoulder pain
(internal impingement pain)
Tuite (2007) [72] Labral length, thick-capsule labrum length, posterior recess angle
Labral length: cases > controls,p= 0.001. Thick-capsule labrum length: cases > controls, p< 0.001. Posterior recess angle: cases > controls,p= 0.002. MR arthrogram: greater (dichotomized) glenohumeral internal rotation deficit (GIRD): labral length, thick-capsule labrum length, posterior recess angle, NS.
Yes
↑labral length in cases
↑thick capsule labral length in cases
↑posterior recess angle in cases
Neck/shoulder disorders and symptoms
Neck/shoulder pain Hallman (2011) [80]
Muscle blood flow (MBF)
During HGT: MBF cases < controls (p= 0.02 -ipsi;p= 0.04 - contra). After HGT: MBF cases < controls (p= 0.001 - ipsi;p= 0.003 - contra). During CPT: increase in MBF cases < controls (p= 0.04 - ipsi); NS, contra. After CPT: increase in MBF cases < controls (p< 0.05 - ipsi); NS, contra.
Yes
↓MBF in cases during & after HGT in ipsi- and contralateral sides.
↓increase in MBF during and after CPT in ipsilateral side.
Neck/shoulder pain Nilsen (2007) [42] Finger blood flow
Finger blood flow: baseline, NS. Response to stressful task: group x time (baseline, 0–10 min, 50–60 min) interaction,p= 0.02. Post-hoc comparison: controls vs. cases:p= 0.35.
No
Neck/shoulder pain Shiro (2012) [81] ΔOHb,ΔHHb,ΔTHb from baseline ΔO2Hb: cases < controls during Relax 3 (p< 0.01) & recovery (p< 0.05).ΔHHb: NS, cases vs. controls.ΔTHb: cases < controls during Relax 2 & Relax 3 in R trapezius (p< 0.05); cases < controls: each Relax & recovery in L trapezius (allp< 0.05, except Relax 2 & Relax 3,p< 0.001).
Yes
↓ΔO2Hb in cases during Relax 3 & recovery.
↓ΔTHb in cases during Relax 2 & Relax 3 in R trapezius; during each Relax & recovery in L trapezius
Neck/shoulder pain Strøm (2009) [43] Muscle blood flow
At start of work task: cases vs controls, NS difference in blood flow increase in either active or contralateral trapezius. Blood flow during 15 min of recovery in active & contralateral trapezius: cases > controls (p= 0.05).
No
Neck/shoulder pain Takiguchi (2010) [79]
Minimal & maximal standardized uptake values (SUV) of [18F]fluorodeoxyglucose (18F–FDG) Trapezius: mean SUVmax, mean SUVmin: cases < controls,p< 0.0001. Presence/absence of neck/shoulder pain and mean SUVmax (R2 = 0.16,p< 0.0001), and for SUVmin(R2 = 0.26, p< 0.0001), after adjusting for age, gender, smoking status, and diabetes.
Gluteus maximus: mean SUVmax, mean SUVmin: NS, cases vs. controls mean. Presence/absence of neck/shoulder pain and mean SUVmax or SUVmin, NS.
Yes
Cervicobrachial pain syndrome Larsson (1998) [114]
Muscle blood flow
Unilateral pain patients: muscle blood flow: painful < asymptomatic side,p= 0.01; painful < control,p= 0.0009.
Yes
↓blood flow in painful side in unilateral cases
[image:10.595.60.538.102.695.2]patients with unilateral rotator cuff tears with night
pain, increased peak systolic velocity and decreased
resistance index in the anterior humeral circumflex
artery was observed in the symptomatic side in
com-parison to the asymptomatic side [59].
Initially asymptomatic full-thickness rotator cuff
tears were examined in two unique longitudinal
co-horts. Increased tear dimension and tear progression
rate was found in asymptomatic rotator cuff tears that
became symptomatic
versus those that remained
asymptomatic [33]. In this same cohort, Keener et al.
[34] found an increased tear enlargement risk in
asymptomatic full-thickness tears and in
asymptom-atic partial-thickness tears versus those with rotator
cuff disease, but no tear. In the other longitudinal
study, greater rotator cuff tear size was observed in
the anteroposterior plane in tears that became
symp-tomatic at 3-year follow-up, although there was no
difference in the tear size at baseline [36]. No such
increase was observed in the other planes examined.
In a cross-sectional study, there was no difference
be-tween symptomatic and asymptomatic rotator cuff
tears in subacromial-subdeltoid bursal fluid amount,
proportion of full- or partial-thickness tears, or tear
size [39].
[image:11.595.61.533.100.531.2]Concommitant to rotator cuff tears, increased
dimen-sions been observed in particular anatomical structures.
Greater rotator cable (a fibrous band spanning the
in-sertions of the supraspinatus and infraspinatus) width
and thickness were observed in those with full-thickness
Table 1
Are there quantitative imaging biomarkers associated with the presence of neck and shoulder MSDs?
(Continued)
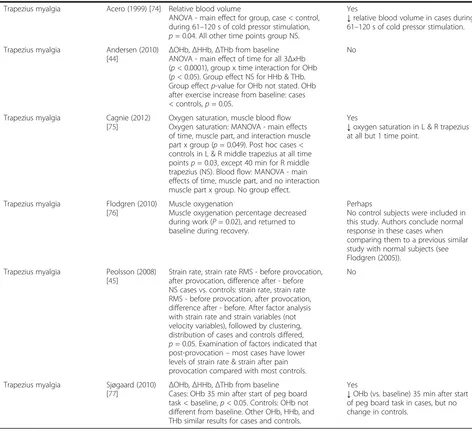
Trapezius myalgia Acero (1999) [74] Relative blood volume
ANOVA - main effect for group, case < control, during 61–120 s of cold pressor stimulation, p= 0.04. All other time points group NS.
Yes
↓relative blood volume in cases during 61–120 s of cold pressor stimulation.
Trapezius myalgia Andersen (2010)
[44] Δ
OHb,ΔHHb,ΔTHb from baseline ANOVA - main effect of time for all 3ΔxHb (p< 0.0001), group x time interaction for OHb (p< 0.05). Group effect NS for HHb & THb. Group effectp-value for OHb not stated. OHb after exercise increase from baseline: cases < controls,p= 0.05.
No
Trapezius myalgia Cagnie (2012) [75]
Oxygen saturation, muscle blood flow Oxygen saturation: MANOVA - main effects of time, muscle part, and interaction muscle part x group (p= 0.049). Post hoc cases < controls in L & R middle trapezius at all time pointsp= 0.03, except 40 min for R middle trapezius (NS). Blood flow: MANOVA - main effects of time, muscle part, and no interaction muscle part x group. No group effect.
Yes
↓oxygen saturation in L & R trapezius at all but 1 time point.
Trapezius myalgia Flodgren (2010) [76]
Muscle oxygenation
Muscle oxygenation percentage decreased during work (P= 0.02), and returned to baseline during recovery.
Perhaps
No control subjects were included in this study. Authors conclude normal response in these cases when comparing them to a previous similar study with normal subjects (see Flodgren (2005)).
Trapezius myalgia Peolsson (2008) [45]
Strain rate, strain rate RMS - before provocation, after provocation, difference after - before NS cases vs. controls: strain rate, strain rate RMS - before provocation, after provocation, difference after - before. After factor analysis with strain rate and strain variables (not velocity variables), followed by clustering, distribution of cases and controls differed, p= 0.05. Examination of factors indicated that post-provocation–most cases have lower levels of strain rate & strain after pain provocation compared with most controls.
No
Trapezius myalgia Sjøgaard (2010) [77]
ΔOHb,ΔHHb,ΔTHb from baseline Cases: OHb 35 min after start of peg board task < baseline,p< 0.05. Controls: OHb not different from baseline. Other OHb, HHb, and THb similar results for cases and controls.
Yes
↓OHb (vs. baseline) 35 min after start of peg board task in cases, but no change in controls.
a
rotator cuff tears than in healthy subjects [57]. In
full-thickness rotator cuff tears, the biceps long tendon
(BLT) showed increased thickness and cross-sectional
area, and decreased BLT flattening ratio
(width/thick-ness) in comparison to controls [56]. In the first
longi-tudinal study referred to above, greater rotator cuff tear
width at baseline was observed in those with anterior
supraspinatus cable disruption vs. those without such
disruption [35]. However, no difference in tear width
en-largement percentage was observed in a minimum of
2 years later.
Rotator cuff tendinitis (5 studies)
Five studies examined rotator cuff tendinitis [57, 60
–
63].
Decreased subacromial distance and humerus diameter
[60] were observed in cases. Joensen et al. [62] found
in-creased supraspinatus tendon thickness in cases
’
symp-tomatic side, while Arend et al. [63] observed a greater
maximal supraspinatus tendon thickness in cases.
Greater rotator cable width was observed in rotator cuff
tendinosis than in healthy subjects [57]. No difference in
carotid artery intima-media thickness was seen in
rota-tor cuff tendinitis vs. controls [61].
Adhesive Capsulitis (4 studies)
Four studies examined adhesive capsulitis (frozen
shoul-der) [64
–
67]. Increased coracohumeral ligament [64, 66],
articular capsule [66], and axillary recess joint capsule
thicknesses [65, 67] were observed in cases. Increased
axillary recess and rotator interval contrast
enhance-ment, along with axillary recess thickening were
ob-served [65].
Shoulder impingement syndrome (5 studies)
Five studies investigated shoulder impingement
syn-drome [58, 68
–
71]. Increased supraspinatus tendon
thickness was observed [69]. Decreased acromiohumeral
distance (i.e., subacromial distance) was found in one
study [68], but not in another [69]. Park et al. [70] found
a difference in mean skin temperature between sides (in
unilateral shoulder impingement syndrome). Decreased
overall supraspinatus blood flow was observed in cases,
with less blood flow in specifically in the medial portions of
the supraspinatus [58]. Increased subacromial-subdeltoid
bursal thickness was observed in one imaging view in
cases [71].
Shoulder pain (4 studies)
Four studies examined shoulder pain [40, 41, 61, 72]. As
the diagnoses were non-specific, we were unable to place
them into one of the other more specific categories.
Tuite et al. [72] saw an increased labral length, thick
capsule labral length and posterior recess angle in cases.
No difference was seen in acromiohumeral distance
(AHD) between cases and controls at rest or at 45
de-grees abduction [40]. Neither was any difference
ob-served between groups in percent change in trapezius
muscle thickness between rest and during muscle
con-traction with shoulder abduction [41]. Rechardt et al.
[61] saw increased carotid artery intima-media thickness
in males 60+ with shoulder pain, but not in females or
in younger cases.
Trapezius myalgia, cervicobrachial syndrome and other
neck/shoulder pain (12 studies)
Seven studies examined trapezius myalgia and
cervico-brachial syndrome, in which muscle hemodynamics,
muscle oxygenation or muscle velocity biomarkers were
assessed in the trapezius [44, 45, 73
–
77]. Decreased
muscle blood flow was observed in cases versus controls
and on the painful side in unilateral cases [78]. A
de-crease was found in muscle relative blood volume during
cold pressor stimulation [74], and oxygen saturation was
reduced at baseline and in response to typing [75]. In
re-sponse to an upper extremity physical task, decreased
oxygenated hemoglobin (compared to baseline) was
ob-served in the trapezius in cases, but not controls [77].
No difference in change in trapezius blood flow, or in
oxygenated or deoxygenated hemoglobin in response to
ergometer exercise was found [44]. Lastly, there was no
change in trapezius strain rate/strain rate RMS, a muscle
velocity measure, between cases and controls in
re-sponse to a provocative upper extremity exercise [45].
Five studies examined neck/shoulder pain [42, 43, 79
–
81].
Decreased trapezius blood flow was seen during and
after hand grip and cold pressor tests [80]. Decreased
trapezius oxygenated hemoglobin and relative blood
volume was observed in response to isometric trapezius
contractions [81], but no difference in trapezius blood
flow was found in response to a computer work task
[43]. Nilsen et al. [42] saw no decrease in finger blood
flow in response to a stressful task. Minimal and
max-imal standardized uptake values of
[18F]fluorodeoxy-glucose (18F
–
FDG), glucose metabolism indicator
evaluated by PET/CT were lower in trapezii of cases
versus controls, but no difference was observed in the
control gluteus maximus, even after adjusting for age,
gender, smoking status and diabetes [79].
In summary, a) neck muscle size appeared to be
de-creased in neck pain, and b) reduced blood flow, relative
blood volume and reduced oxygen saturation was
ob-served in the trapezius at rest and in response to upper
extremity tasks with myalgia and neck/shoulder pain.
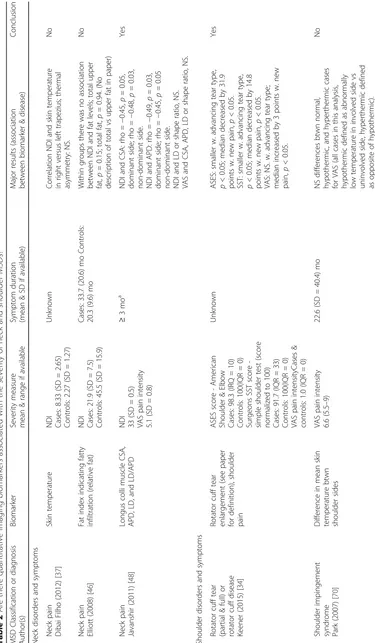
Are there quantitative imaging biomarkers associated
with the severity of neck and shoulder MSDs?
(Table 2). Four studies investigated a quantitative
im-aging biomarker in relation to a severity score or
dis-ease stage assessment determined during a physical
examination. Neck Disability Index (NDI) was
nega-tively correlated with longus colli cross-sectional area
(CSA) and anterior-posterior distance in neck pain
[48]. No correlation was observed between NDI and
trapezius skin temperature [37] or with fat levels in
cervical extensor muscles [46]. In rotator cuff tears or
rotator cuff disease, American Shoulder and Elbow
Score (ASES) was significantly decreased with
advan-cing tear type, and with incident pain in the
asymp-tomatic shoulder [34]. Simple shoulder test score
(SST) was similarly reduced.
Six of eight studies solicited pain ratings from
partici-pants through a VAS or other means. Three
neck/shoul-der pain studies investigated pain severity. In Takiguchi
et al. [79], minimal and maximal standardized 18F
–
FDG
uptake values, a glucose metabolism measure, were
negatively correlated with VAS pain. In one study,
max-imal pain response was correlated with finger skin blood
flow during the first 10 min of a mentally stressful task
in cases, but not controls [42]. In another study, in cases
(but not controls) pain and blood flow was positively
correlated in the active trapezius, and negatively
corre-lated in the contralateral trapezius at the end of a
90 min computer task [43]. No association was observed
between pain rating and longus colli CSA,
anterior-posterior distance, or other quantitative imaging
param-eters examined [48]. Neither was VAS pain related to
mean skin temperature differences in shoulder
impinge-ment syndrome [70].
In summary, very few studies reviewed found
associa-tions between quantitative imaging biomarkers and neck
and shoulder MSD severity. As might be inferred from
re-sults to our first research question, functional impairment
in neck pain may be associated with reduced longus colli
dimensions. Functional impairment in rotator cuff disease
in an asymptomatic shoulder may be correlated with
in-creasing tear type and incident shoulder pain. In neck/
shoulder syndromes, increased pain may be associated with
reduced glucose metabolism and increased blood flow in
the active trapezius in response to a computer task.
Discussion
In this study we have summarized the current state of
quantitative medical imaging marker research in neck
and shoulder MSDs by conducting a comprehensive
systematic review. A critical approach was used to
synthesize results for the two research questions: 1) are
there quantitative medical imaging markers associated
with the presence of neck and shoulder MSDs, and 2)
are there quantitative medical imaging markers
associ-ated with the severity of neck and shoulder MSDs?
Within the studies of sufficient quality, we found
associ-ations between quantitative medical imaging biomarkers
and neck and shoulder MSDs, and were able to identify
several commonalities.
Evidence was found for the following quantitative
imaging biomarkers: With respect to referents,
de-creased neck muscle size was observed in cases with
neck pain [47
–
50, 52]. Reduced trapezius blood flow
and relative blood volume [73, 74, 80, 81] and oxygen
saturation at rest and in response to upper extremity
tasks [75, 77, 81] occurred with trapezius myalgia and
neck/shoulder pain. Lastly, reduced blood flow and
altered vascular parameters were observed in rotator
cuff tears [54, 55, 58, 59].
In contrast to the first research question, associations
between biomarkers and the severity of neck and
shoul-der MSDs were observed in only a few studies. Most
notably, minimal and maximal standardized 18F
–
FDG
uptake values, a biomarker of trapezius metabolism in
neck/shoulder pain, were inversely correlated with pain,
indicating reduced muscle metabolism in this condition.
However, this was found in only one study [79]. The
small sample size resulting in reduced ranges of severity
measures in many studies examining neck and shoulder
MSD severity may have hampered the feasibility of
detecting statistically significant results for our second
research question.
A possible explanation for the decreased size of deep
neck muscles in neck pain cases advanced by several
ar-ticles [47
–
50] is the development of muscle atrophy due
to a long term reduction in muscle activity through
either pain or reflex inhibition. This explanation is
con-sistent with a smaller change in multifidus muscle
thick-ness during MVC from rest in those with neck pain in
comparison to control subjects [52]. In another study,
cases and controls showed different patterns of muscle
thickness alterations during MVC when compared with
rest [53]. A possible mechanism for activity changes
during muscle pain is the redistribution of activity
from painful muscles or painful areas to adjacent or
syn-ergistic muscles, as described in the pain adaptation
model [82]. Subjects with neck pain showed reduction in
deep neck muscle activity in the longus colli [49]. This
was corroborated by prior studies showing reduced
strength and endurance during neck flexion tests in
sub-ject with neck pain [83, 84]. However, causal
relation-ships cannot be deduced due to the cross-sectional
design of sufficient quality studies.
The pathophysiology associated with reduced blood
flow, relative blood volume and oxygen saturation with
trapezius myalgia and neck/shoulder pain is not clear.
Decreased oxygenation as presented by several studies
[75, 77] may be related to a reduction in oxygen delivery
consumption. Previous studies using muscle
microdialy-sis found increased pyruvate and lactate, metabolites
re-lated to increased anaerobic energy production, in painful
trapezius muscles [77, 85]. Findings of reduced trapezius
muscle blood flow in response to physical load [73, 80, 81]
or pain induced during an experiment [74, 80] does not
oppose the hypothesis of reduced oxygen delivery.
Re-duced blood flow may be attributed to an imbalance
be-tween
vasoconstriction
and
dilatation
in
muscle
arterioles [86]. This imbalance could be due to aberrant
activation in the sympathetic nervous system or
down-regulation of adrenoreceptors in the arteriole
epithe-lium in patients with MSDs [87]. Indeed, in some
sufficient quality studies in this review, patients with
MSDs show aberrant sympathetic activity compared to
asymptomatic controls [75, 77, 80], although
adrenore-ceptor expression was not investigated. Together, the
reduction in blood flow and oxygen saturation may
fa-cilitate the production of muscle metabolites like
lac-tate, which are known to influence muscle nociceptor
activity.
Limitations of the review
Other techniques besides imaging are available for
mea-suring some of the functional and morphological features
or processes addressed in this review. However, these other
methods for assessing biomarkers were beyond the scope
of the present review. For instance, our inclusion criteria
allowed for articles on photoplethysmography to measure
blood pressure, but not strain-gauge plethysmography.
Although the term
“
plethysmography
”
was part of our
search string, no papers were found that utilized
strain-gauge plethysmography in neck or shoulder MSDs. Studies
using plain x-rays to the exclusion of other imaging
modal-ities were excluded. Plain radiographs are best utilized in
evaluating osteoarthritis, fractures, dislocations and other
bone abnormalities, and are not routinely indicated in soft
tissue MSDs [23
–
26]. However, we may have missed some
biomarkers that could be of interest such as calcifications,
soft tissue swelling, or acromial abnormalities including
variant acromial morphology and acromial spurs.
Methodological limitations in the articles reviewed
Selection bias - response rate
The response rate to participate could be ascertained in
only 15 (31%) of the 49 sufficient quality studies.
With-out response rates, selection bias cannot be adequately
assessed. Hence, it is unknown if the cases and controls
represent the underlying population, or to what extent
they may be comparable. We recommend including
re-sponse rates for both cases and controls in future
quan-titative imaging studies.
Approximately half of the reviewed sufficient quality
studies controlled for potential confounders, either
through restriction of study subjects (e.g., by age or
gen-der) or through adjustment in the statistical analysis.
With respect to the quantitative imaging parameters
reviewed here, muscle oxygenation, including in the
tra-pezius, was found to be greater in males than females in
many studies [88
–
91]. However, gender had no influence
on erector spinae oxygenation in a sustained trunk
ex-tension test [92]. This latter study also found no
differ-ence in relative blood volume with respect to gender.
But, literature is sparse in this area. Muscle oxygenation
and blood volume responses in limb muscles are
signifi-cantly influenced by both age [93] and level of exercise
training [94], yet no study has looked at the effects on
shoulder and neck muscles.
Trapezius muscle size is greater in males than females
[91]. In a biopsy study, Lindman et al. [95] found that
fe-male trapezius muscle fibers have smaller cross-sectional
areas than males, and more type II fibers. Neck muscle
size may also differ by gender. Zheng et al. [96] found a
greater total neck muscle volume in males versus
females. However, the proportion of each muscle volume
examined in comparison to total neck muscle volume
was similar between genders, except for the
sterno-cleidomastoid, longus capitis, and obliqus capitis
in-ferior. Deep neck posterior muscles and semispinalis
capitis cross-sectional areas were larger in males than
females, but not after adjusting for body weight [97]. In
that study, muscle shape ratio did not differ by gender. Nor
were there any differences in muscle dimension by age.
Although several studies suggested that reduced
vascularity in the supraspinatus tendon may be
associ-ated with rotator cuff tears, two of these studies used
much younger controls than cases [55, 58] (see Additional
file 7). Due to the design of these studies, it is difficult to
determine whether the results were due to age or to
path-ology. Rudzki et al. [98] found reduced blood flow in the
supraspinatus tendon in those over 40 years in their study
of asymptomatic rotator cuff tears, which roughly
corre-sponds to the differentiating age between the two groups
in the above studies.
The above findings suggest that (minimally) age,
gen-der, exercise frequency, and BMI should be collected
from study subjects and controlled for, either during
analysis or through selection.
Directions for future research
shoulder disorders. Conversely, muscle oxygenation and
relative blood volume have been explored in the trapezius,
but not in other neck muscles. Future research should
examine muscle dimensions in the trapezius, and muscle
oxygenation and relative blood volume in other muscles.
The research on muscle dimension, oxygenation and
relative blood volume has been conducted in subjects
with different MSD labels, i.e., in neck pain, trapezius
myalgia and neck/shoulder pain. Here, we used the
diag-nosis or syndrome name presented in the articles. These
diagnoses or syndrome names are based on the painful
region. However, the division between neck and
shoul-der is not clear. For example, when consishoul-dering
func-tional anatomy, the neck and upper trapezius could be
considered as the same region thus rendering definitions
of neck and neck/shoulder regions arbitrary.
Further-more, there are suggestions of a possible common
pathophysiological mechanism in these syndromes [99].
As mentioned previously, a majority of shoulder studies
were conducted in older populations (at least one analysis
group with mean age
≥
50 years), whereas the neck and
neck/shoulder studies were conducted in younger
popula-tions (mean age < 50 years). This could be due partially to
the average age at onset of these disorders. However, given
the potential for a possible spectrum effect [100], it would
be of interest to study a broader range of ages.
Only 12 of the 49 sufficient quality studies in this review
listed the duration of symptoms in patients (range: 9.1
–
114 months), all of which durations are chronic by
defi-nition [36, 38, 40, 41, 46, 47, 64, 66, 68, 70, 73, 76, 80].
One review has determined that blood flow increases to
the site of rotator cuff small tears, but that decreased
vas-cularity is observed as tear size increases and the healing
response fails [101]. This suggests that varying results in
vascularity in the rotator cuff tendons may be influenced
by symptom duration. In view of pathophysiological
mechanism research, we recommend that quantitative
im-aging biomarkers be investigated in MSD patients with
shorter symptom durations. We further recommend that
quantitative imaging biomarker study be report the range
of symptoms and their duration.
Although focused on computed tomography imaging
methods, animal models would suggest that different
quantitative imaging biomarkers and findings are present
at different MSD stages [102
–
105]. In humans, various
quantitative imaging biomarkers reflective of underlying
musculoskeletal changes are valid at different stages of
disease. For instance, the AHD decrease is a late stage
phenomenon. It is detectable in large chronic
full-thickness rotator cuff tears, but not in earlier stages of
rotator cuff disease [106]. The question of which
im-aging modality best captures the particular biomarker
under consideration is beyond the scope of this review.
Determining the most appropriate imaging modality for
a given quantitative imaging biomarker is an essential
area for future research.
Heterogeneity
–
other considerations
Quantitative imaging has the potential to be unbiased
and precise, particularly in comparison to ordinal scales
such as the Bigliani classification [107] sometimes used
in shoulder impingement syndrome. As with all types of
biomarkers, optimally, a complete analytical evaluation
should be conducted for each quantitative imaging
bio-marker under consideration. This evaluation should
in-clude determination of limit of detection, limit of
quantification, reference values in normal subjects, as
well as assessing the reliability and validity of any such
biomarker [108]. There are unique considerations for
quantitative imaging. Sources of variability include the
instrument/acquisition system, and the image
measure-ment algorithm, as well as the patient [109]. For
in-stance, patient motion may affect the performance of the
imaging acquisition system [110], and image processing
software may include a number of steps, each of which
requires validation [108]. See Raunig et al. [109] for a
thorough review of statistical methods for assessing
technical performance in quantitative imaging. These
technical considerations must be addressed prior to
val-idating the clinical utility of any suggested quantitative
imaging biomarker [108, 109].
Recommendations
Below are our brief recommendations for future
quanti-tative imaging biomarker research:
1. Report the response rate for all analysis groups.
2. Carefully consider and report potential confounders,
gather information on these factors from study
subjects, and potentially control for them through
exclusion or through adjustment in the statistical
analysis.
3. Report symptom duration and/or severity in study
subjects.
4. Clearly describe MSD case definition criteria,
including a description of localization of symptoms.
5. Prioritize quantitative imaging biomarker studies
that are longitudinal.
Conclusions
Further research is warranted. In the meantime,
clini-cians may find value in our findings. For instance,
radiol-ogists may wish to adjust imaging scan planes to allow
better volumetric analysis, and refine protocols to better
characterize blood flow. Some quantitative imaging
pa-rameters, e.g., muscle size and blood flow, are not
rou-tinely included in radiology reports. It may behoov the
clinician to do so. Additionally, epidemiologists may
wish to include these biomarkers in cross-sectional and
prospective studies of neck and shoulder MSDs.
Pro-spective high quality studies are needed as this discipline
moves forward. Future testing should be done with
re-gard to MSD symptom duration and severity. Results
should be reported with consideration to the effects of
potentially confounding factors (minimally including
age, gender, and exercise), and response rates of all
ana-lysis groups should be described so that potential
selec-tion bias may be assessed.
Additional files
Additional file 1:Search terms for musculoskeletal disorders (MSDs) and imaging markers. (PDF 14 kb)
Additional file 2:Questions used in the primary screen for exclusion of articles. (PDF 9 kb)
Additional file 3:Questions used in the secondary screen for quality assessment. (PDF 13 kb)
Additional file 4:PubMed search string. (PDF 5 kb)
Additional file 5:Data extraction items. (PDF 9 kb)
Additional file 6:Quality scores for each of the reviewed papers in the primary screen, including the papers of sufficient quality (≥70%) and insufficient quality (< 70%) [114–159]. (DOCX 177 kb)
Additional file 7:Overview with descriptive information of included studies, by anatomical region of the disorder. (DOCX 112 kb)
Abbreviations
18F–FDG:[18F]fluorodeoxyglucose (Glucose analog where one hydoxylgroup has been replaced with a radioacitve fluorine-18 isotope, an indicator of tis-sue glucose uptake in PET); ADP: Anterior-posterior dimension;
AHCA: Anterior humeral circumflex artery; AHD: Acromiohumeral distance; ANOVA: Analysis of Variance; AS: Anterior scalene; ASES: American Shoulder & Elbow Score (A validated instrument to assess shoulder pain and function [111]); Assoc.: Associated; BA: Brachial artery; BLT: Biceps long tendon; BMI: Body mass index (A measure of body fat based on height and weight); C3-C6: Cervical vertebrae; CCFT: Craniocervical flexion test;
CHL: Coracohumeral ligament; CI: Confidence interval; CPT: Cold pressor test (A cardiovascular test involving immersion of the dominant hand up to the wrist for 1–3 min in cold water); CSA: Cross - sectional area; HGT: Static hand grip test (A test in which the subject presses a dynamometer with their dominant hand [80]); HR: Hazard ratio; IQR: Interquartile range; Lco: Longus colli muscle; LD: Lateral dimension; LD/ADP: Muscle shape ratio (ratio between lateral and anterior-posterior dimensions); MANOVA: Multivariate analysis of variance; MBF: Muscle blood flow; MCI: Musculoskeletal complaint severity index (Mean value of 7 pain areas [43]); MR: Magnetic resonance; MRI: Magnetic Resonance Imaging; MSTT: Maximal supraspinatus tendon thickness; MVC: Maximum voluntary contraction; NDI: Neck Disability Index (A validated instrument to assess disability due to neck pain [112]); NIRS: Near infrared spectroscopy; NS: Not significant; OHb: Oxygenated hemoglobin; OR: Odds ratio; PET/CT: Positron-emission tomography/ computerized tomography; PSV: Peak systolic velocity; RCT: Rotator cuff tear; RI: Resistance index (RI = (PSV (see above)–end diastoic velocity)/PSV); RMS: Root mean square; ROI: Region of interest; SA: Serratus anterior muscle;
impingement syndrome; SST: Simple shoulder test score (An instrument to assess shoulder functional disability [113]); SUV: Standardized uptake values (Measurment for quantification in positron-emission tomography); T6-T10: Thoracic vertebrae; TVI: Tissue velocity imaging; VAS: Visual Analogue Scale; VO2max: Maximal oxygen uptake;ΔHHb: Change in de-oxygenated hemoglobin (Determined through NIRS, from a baseline value);
ΔOHb: Change in oxygenated hemoglobin (Determined through NIRS, from a baseline value);ΔTHb: Change in total hemoglobin, interpreted as relative blood volume (Determined through NIRS, from a baseline value)
Acknowledgements None.
Funding
This study was funded by a grant from the Swedish