Blackwell Science, Ltd
Big mice die young: early life body weight predicts
longevity in genetically heterogeneous mice
Richard A. Miller, James M. Harper, Andrzej Galecki
and David T. Burke
Departments of Pathology and Human Genetics, and Geriatrics Center, University of Michigan School of Medicine; University of Michigan Institute of Gerontology; and Ann Arbor DVA Medical Center, Ann Arbor, MI, USA
Summary
Small body size has been associated with long life span in four stocks of mutant dwarf mice, and in two varieties of dietary restriction in rodents. In this study, small body size at ages 2–24 months was shown to be a significant predictor of life span in a genetically heterogeneous mouse population derived from four common inbred mouse strains. The association was strongest for weights measured early in adult life, and somewhat weaker, though still statistically significant, at later ages. The effect was seen both in males and females, and was replicated in an independent population of the same genetic back-ground. Body size at ages 2–4 months was correlated with levels of serum leptin in both males and females, and with levels of IGF-I and thyroid hormone in females only. A genome scan showed the presence of polymorphic alleles on chromosomes 2, 6, 7 and 15 with significant effects on body weight at 2– 4 months, at 10 –12 months, or at both age ranges, showing that weight gain trajectory in this stock is under complex genetic control. Because it provides the earliest known predictor of life span, body weight may be usefully included in screens for induced mutations that alter aging. The evidence that weight in 2-month-old mice is a significant predictor of life span suggests that at least some of the lethal diseases of old age can be timed by factors that influence growth rate in juvenile rodents.
Key words: gene mapping; growth rate; IGF-I; leptin; longevity; thyroid.
Introduction
There is now a good deal of support for the notion that factors which regulate early life growth trajectory and adult body size
may affect the rate of physiological decline and disease risks at the end of the life span. At least four genetic mutations in the mouse lead both to dwarfism and to extended longevity (Brown-Borg et al., 1996; Miller, 1999; Coschigano et al., 2000; Flurkey et al., 2001). All four of these mutations lead to declines in growth hormone and its major mediator insulin-like growth hormone 1 (IGF-I); two of them, the Ames (df) and Snell (dw) dwarf mutations, also involve deficits in thyroid hormones and prolactin. Small body size is also associated with extended longevity in mice or rats subjected to a reduced calorie diet (Weindruch & Walford, 1988), and in rats whose growth is stifled by restriction of the essential amino acid methionine (Orentreich et al., 1993). Lines of mice selected for differences in growth rates over the first 10 –56 days of life show a similar relationship, with mice from the smaller strains likely to live longer than mice of the larger stocks (Miller et al., 2000a). Amongst breeds of dogs, small body size is also associated with longer life span (Li et al., 1996; Miller, 1999) and, in the cases examined, small stature has been explain-able on the basis of diminished IGF-I production (Eigenmann et al., 1984; Eigenmann et al., 1988). There is also some evidence to suggest that the unexplained increase, over the last two decades, in the mean body weight of stocks of inbred F344 rats used for toxicological research, has been accompanied by a corresponding decrease in the proportion of these rats that survive more than 2 years (Turturro et al., 1998).
To see to what extent body size provides a predictor of life expectancy in mice, we have conducted a longitudinal study of weight and survival in a group of 598 animals, bred as the progeny of a cross between CB6F1 females and C3D2F1 males. This breeding scheme produces a population in which each animal is genetically unique, but is, from a genetic perspective, a full sib to every other mouse in the group. We used this genetically heterogeneous test population to minimize the likelihood that our findings would apply only to a single, potentially idiosyncratic genotype. We report that body weight, even when measured in mice as early as the second month of life, is a significant predictor of life span, with lighter mice tending to be longer lived. Small mice tend to have, early in life, relatively low levels of the thyroid hormone T4, the growth hormone mediator IGF-I, and leptin, a key regulator of adipose tissue biology. In addition, the use of genetically heterogeneous mice allowed us to conduct a genome screen to search for quantitative trait loci (QTL) with significant influence on body weight at early and late ages in these mice.
Results
Figure 1 shows mean values for body weight in males and female mice of the UM-HET3 stock at various ages. The mean Correspondence
Richard A. Miller, 5316 CCGCB, Box 0940, University of Michigan, 1500 East Medical Center Drive, Ann Arbor, MI 48109–0940, USA.
Tel.: 734 9362122; fax: 734 6479749; e-mail: [email protected]
Early body weight predicts life span, R. A. Miller et al. 23
weight of the population reaches a plateau at approximately 14 months of age, and begins to decline at approximately 20 months for males and 24 months for females, with wide variation (not shown) among individual animals in the age at which maximum weight is reached. The mean value for maximum lifetime weight was 34 g for females (range: 20–54, with 80% of the mice between 28 and 41 g) and 40 g for males (range: 27–54, with 80% of the mice between 32 and 48 g). By 2 months of age, female mice have on average reached 56% of their individual maximum body weight, and males have reached 64% of their maximum lifetime weight.
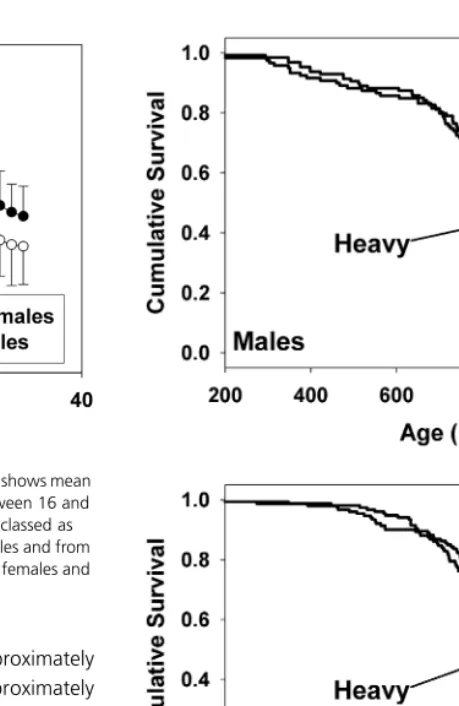
We used Cox proportional hazard regression to test the strength of the association between body weight and life expectancy. Using percentile scores to allow pooling weight data from males and females, we found a significant association between weight and life span at each age from 2 to 24 months of age. The significance of this association reached P < 0.05 for each age tested, and was P < 0.01 at ages between 2 and 15 months (tests unadjusted for among-age covariance of error variance). We obtained similar results when the analysis used raw weight values in a Cox regression model using both weight and gender as predictors. Figure 2 illustrates the main result separately for males (top panel) and females (bottom panel), in each case comparing mice whose weight percentile score, calculated as the average percentile score over months 2, 3 and 4, was in either the top or the bottom half of the distribution. By the log-rank test, mice in the lighter half of the pool lived significantly longer (P = 0.0006, males and females combined).
To see whether the strength of the association between life expectancy and body weight varied at different ages, we calculated the regression coefficient, β, at each age, and present these data in Fig. 3. The highest value of β is seen at 5 months of age, and the value of β then gradually declines through the rest of adult life; a formal test of this trend will require hazard
Fig. 1Weight as a function of age in UM-HET3 mice. Each point shows mean ± SD for mice of the indicated sex and age. Mice weighed between 16 and 45 days were considered to be 1 month old; mice 46–75 days classed as 2 months old, and so forth. N ranged from 225 to 269 for females and from 165 to 216 for males between 2 and 24 months of age. N = 48 females and 42 males at 2 months.
Fig. 2Kaplan–Meier survival curves for male (top panel) and female mice (bottom panel) stratified by weight at 3 months. Statistical significance calculated by log-rank method. Individual symbols on each plot show mice that were still alive on 1 December 2001 (censored observations).
Fig. 3The regression coefficient β, plotted with its standard error as a function of age. Values of β were derived at each age from the Cox regression of life span as a function of percentiled weight scores.
[image:2.730.306.536.61.414.2] [image:2.730.63.289.61.232.2] [image:2.730.310.536.490.661.2]analysis with mass as a time-dependent variable. It is note-worthy that the ability of weight to predict life span is strong for weight measurements taken at early ages, well before the attainment of maximum body weight and well before the onset of any illnesses that could influence both weight and survival.
Maximum weight is not itself a good predictor of longevity in this population of mice. By Cox regression, the β coefficient for percentiled maximum weight score was 0.32, i.e. lower than the coefficients for individual weights shown in Fig. 3, and not statistically significant at P = 0.06. We also calculated a change statistic as the difference between the mean rank at ages 10 –12 months minus the mean rank at ages 2– 4 months. A positive value for this change statistic indicates a mouse whose weight, relative to other mice of the same gender, tended to increase between 2 and 12 months of age, i.e. mice whose weight gain was relatively prolonged. A negative value indicates a mouse whose weight gain slows at relatively early ages compared to mice of the same sex. We found no evidence that this change statistic was able to predict longevity in these mice (P = 0.77 by Cox regression analysis).
Replication study
Data on weight and survival were also available for a second independent population of 195 UM-HET3 mice born between September 1993 and February 1995. Because all these animals had died at the time of analysis, the association of body weight to life span was assessed by a multiple regression method, in which life span was the dependent variable and the predictor variables were sex (male or female), weight at 5.5–7.5 months, and a [sex–weight] interaction term. The effect of weight was significant at P = 0.005, but neither sex nor the interaction term had a significant association with life span. As in the main study, high body weight was associated with relatively short life span in this replication study. Table 1 shows the main results of this analysis, and shows that in this set of mice a 1-g difference in early life body weight was associated with a 6.1-day difference in life span.
Endocrine levels
As a first step towards defining the molecular basis for the differences among these mice in young adult body weight, we measured levels of thyroxine T4, leptin and IGF-I in serum at the age of 4 months. Table 2 shows the correlation coefficients for these hormones with body weight, calculated as the per-centiled mean rank at ages 2– 4 months. High levels of leptin are associated with higher body weights in both male and female mice. High levels of serum IGF-I are characteristic of heavier female mice, but there was no detectable association between IGF-I levels and weight in males at this age range. However, there is a significant correlation in both males and females between young adult body weight and IGF-I levels measured at 15 months (not shown). Thyroxine T4 was weakly,
though significantly, correlated with body weight in young females, but not in male mice. Very similar correlations were seen when the calculations involved other measures of weight at ages 2–4 months, whether these used raw weight data or percentiled scores at specific months of age.
QTL analysis: genetic control of early adult weight
To see whether the various measures of early and mid-life weight differences were under the control of polymorphic genes in this segregating population, we examined each of the first 450 mice for inheritance patterns at each of 96 marker loci polymorphic among the dams, and 92 polymorphic among sires. Table 3 presents all of the gene /trait associations which achieved statistical significance, using a permutation approach to adjust for the simultaneous testing of multiple loci. This procedure revealed four QTL with significant effects on weight. Two of these, on chromosomes 6 and 15, had an influence on weight within the age range of 2– 4 months. The chromosome 6 QTL, as well as two others on chromosomes 2 and 7, had a significant effect on weight measured at 10 –12 months of age. The QTL on chromosomes 2 and 7 also had a significant influence on the maximum weight score.
[image:3.730.307.534.78.153.2]Two loci with marginal but potentially interesting effects are not shown in the table. One of these, D19Mit10, at position 35 on chromosome 19, showed an association (0.08 < P < 0.11) with weight at both age ranges as well as with maximum weight; at this locus, the C3H allele was associated with heavier weights compared to the DBA /2 allele. We also noted a statis-tically marginal association (P = 0.07) between marker D2Mit434,
Table 1 Regression analysis for replication study
[image:3.730.307.535.252.312.2]
Table 2 Correlations between hormones and weight at ages 2– 4 months
Predictor variable
Parameter estimate
Standard
error t P (t) =
Intercept 1044 90 11.6 0.000
Sex −119 90 −1.32 0.19
Weight −6.1 2.1 −2.88 0.005
[Sex × Weight] 2.6 2.1 1.23 0.22
The parameters shown are coefficients for a regression model in which life span (days) is the dependent variable and the predictor variables are Sex (0 = female, 1 = male), Weight (grams, age 5.5 –7.5 months), and the [Sex–Weight] interaction term. The table also includes the standard error for the parameter estimate and the corresponding t statistic; P (t) < 0.05 was taken as the criterion for statistical significance.
Hormone Males Females
T4 R = 0.06, P = 0.44 R = 0.15, P = 0.02 Leptin R = 0.55, P < 0.001 R = 0.31, P < 0.001 IGF-I R = 0.06, P = 0.48 R = 0.36, P < 0.001
Early body weight predicts life span, R. A. Miller et al. 25
at position 42 on chromosome 2, with the change in weight between the early and the later age range. The B6 allele at this locus was associated with positive change score, i.e. with a tendency to continue to add weight at later ages.
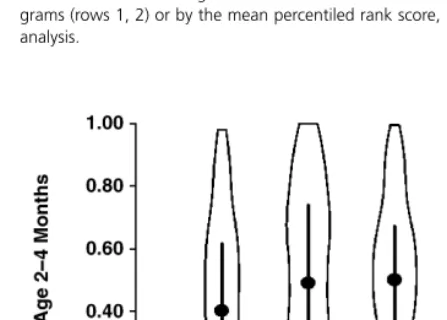
We examined all pair-wise combinations of these QTL to see if there was evidence of epistasis, i.e. evidence that the effect of the allele was dependent on which allele was inherited at the other relevant loci, and we found no evidence for a signi-ficant degree of epistasis. In each case the effects of each allele were additive to those associated with each of the other alleles with a significant effect on the trait, and the difference between mice inheriting any pair of alleles could be predicted by simply summing the expected effects of the two alleles separately. Figure 4 shows an illustration of this additivity, plotting the Rank score from ages 2– 4 months for each of the four genotype classes corresponding to inheritance, from the mother, of alleles for D6Mit186 and D15Mit63. At each locus, inheritance of the
BALB (‘C’) allele is associated with an increase in the rank score of about 0.10 (see Table 3), and mice that inherit the BALB allele at both loci have a mean rank that is 0.23 higher than those that inherited the B6 allele at both loci (see Fig. 4). The two other genotypic classes have mean rank scores almost exactly halfway between the extreme classes, although the density plots shown in Fig. 4 suggest that mice with the B6C genotype may be bimodally distributed.
Discussion
Both of the dietary manipulations known to extend rodent longevity (Weindruch et al., 1988; Orentreich et al., 1993) lead to smaller body size, as do five of the six single-gene mutations reviewed in (Miller, 2001b). Selective breeding for slower early life growth rates also produces lines of small mice that exhibit exceptional longevity. These findings prompted an examination of the hypothesis that small body weight at early ages might be associated with increased life expectancy in a segregating population of mice derived from four common laboratory inbred strains. Our results show that low body weight, as early as 2 months of age, is a predictor of longer life span. The asso-ciation is seen in both male and female mice, although males are substantially heavier throughout life. A significant associa-tion is seen at all ages from 2 to 24 months, but the strength of the association is higher for weights taken in the first year of life than in the second year. A significant association between body weight and longevity was also seen in an independent population of the same genetic makeup for which weight mea-surements at 5.5 –7.5 months of age were available. Body weight at 2 months of age is, so far as we know, the earliest prognostic factor for life span in a rodent population.
[image:4.730.61.534.77.176.2]Many factors affect the rate of growth and young adult body weight of a mouse, among which several could potentially also influence life expectancy. Small body size was associated, in our test population, with relatively low leptin levels in both male and female mice; although the relationship was statistically significant (P < 0.001) in both sexes, it was substantially stronger in male than in female mice (R2 values of 30% vs. 10%, respect-ively). Leptin is produced predominantly by adipose tissue, and
Table 3Summary of gene mapping results
Trait* Chromosome Position† Marker Heavy‡ Light P-value§
Maximum Weight 2 51 D2Mit58 B6, 38.5 BALB, 36.5 0.04
Maximum Weight 7 27 D7Mit91 C3H, 38.6 DBA, 36.5 0.02
Rank, early ages 6 31 D6Mit186 BALB, 0.56 B6, 0.46 0.007
Rank, early ages 15 28 D15Mit63 BALB, 0.57 B6, 0.45 0.002
Rank, late ages 2 51 D2Mit58 B6, 0.57 BALB, 0.47 0.05
Rank, late ages 6 21 D6Mit186 BALB, 0.57 B6, 0.46 0.01
Rank, late ages 7 27 D7Mit91 C3H, 0.56 DBA, 0.47 0.05
*‘Rank, early ages’ is the mean percentiled rank score for ages 2, 3, and 4 months. ‘Rank, late ages’ is the mean percentiled rank score for ages 10, 11, and 12 months. †Position is given in cM from the centromeric end. ‡This column lists the allele associated with heavier weights, followed either by the weight in grams (rows 1, 2) or by the mean percentiled rank score, ranging from 0 (lightest weight) to 1 (heaviest weight). §Experimentwise P-value from permutation analysis.
[image:4.730.64.288.243.403.2]is a suppressor of food intake (Ahima et al., 1998). Although we do not have data on fat mass in these mice at the relevant ages, we speculate that those with small body size may well have had relatively low total adipose mass at 2– 4 months of age. Although it is possible that low body fat at early ages could, in unknown ways, modify disease risk and hence life span later in the life course, we think it is unlikely that the weight / life span association is due to differences in midlife obesity per se. For one thing, the strength of this association declines at ages where obesity becomes most notable. Furthermore, there is only a weak (and non-significant) association between life span and maximal body weight in this population, inconsistent with the idea that obesity per se is a critical factor connecting weight to life expectancy in these mice.
Low levels of serum IGF-I and T4 are seen in calorically restricted rodents (Weindruch et al., 1988), as well as in the long-lived Snell and Ames dwarf mice. Low levels of IGF-I are also seen in two other long-lived mutant mouse stocks lit / lit (Donahue & Beamer, 1993) and GHR-BP-knockout (Bartke et al., 2001). The small size of pituitary dwarf mice can be restored by a programme of injections of growth hormone (a stimulus for IGF-I production) in the first few months of life, and the rate and extent of this induced growth is increased still further by simultaneous administration of thyroid hormones (Bartke, 1965). These observations suggest IGF-I and T4 as potential regulators of early life growth trajectory. However, in our study there was a significant correlation between IGF-I levels (at 4 months) and body weight, and between T4 and body weight, in female, but not in male mice. The effect in females was much stronger for IGF-I than for T4. It is possible that differences in growth rate are influenced by variations in these or other hormone levels at very early ages, i.e. prior to the 4-month time point at which we obtained our first serum sample for hormone analysis. It is also likely that growth trajectories might reflect a complex web of interactions among hormone levels, hormone receptor levels in specific cell types, intracellular responses to hormone signals, and feedback mechanisms in the brain or at the local tissue level, which cannot be effectively captured by serum hormone concentration alone.
Differences in body weight might also reflect differential access to nutrients, something difficult to measure prior to weaning in mice. In a replication study now under way, we are attempting to control nutrient intake by trimming each litter to a size (n = 4) small enough to provide adequate access to milk for each pup. In the current longevity study, we saw no association between litter size and longevity (data not presented), but further study of the role of differences in milk intake and, after weaning, of appetite and food intake would be useful.
Differences in body weight trajectory are also likely to be under complex genetic control, potentially involving genes that modulate levels of hormones, hormone receptors, appetite, efficiency of fuel utilization, rate of skeletal bone elongation, and many other factors. Our genome scan data provide a first look at the genetic factors that influence weight trajectory in our
four-way cross population. We noted (Table 3) at least four QTL, on chromosomes 2, 6, 7 and 15, that had significant ability to predict one or more indices of weight trajectory in these mice. All of the significant allelic effects proved to be fully additive, and taken together have impressive effects. Mice with the CC genotype shown in Fig. 4, for example, are on average heavier than 64% of young adult mice, while mice with the two opposite alleles have an average rank heavier than only 41% of similarly aged animals. The four alleles with the strongest effects on maximal body weight (on chromosomes 2, 7, 15 and 19) together account for an 8-g difference between mice in the two extreme genotypic groups (not shown). The three traits examined – rank at early ages, rank at late ages, and maximum weight – are each highly correlated with the others, and for this reason QTL with strong effects on any of these measures have some effect on all of them, although not necessarily an effect that reaches statistical significance. Our data raise the possibility that some QTL, such as those on chromosomes 6 and 15, may have a preferential effect on early life growth trajectory, and those others, such as those on chromosomes 2 and 7, may have stronger effects on factors that influence body weight later in life.
Numerous QTLs for body weight, adiposity and /or skeletal size have been identified in previous studies, although typically in crosses between mouse stocks chosen for exceptionally large or small body size rather than among the standard laboratory stocks we use to produce UM-HET3 mice. Nonetheless, it is interesting to note that some of these previous studies have documented QTL that map to the same regions of chromosomes 2, 6, 7 and 15 detected in our own studies (see Table 3). For example, QTLs Obq3 (Taylor & Phillips, 1997), Bw6 (Brockmann et al., 1998), Mob6 (Mehrabian et al., 1998) and Obq10 (Taylor et al., 2001) have all been mapped to regions on chromosome 2 within 7 cM of the QTL associated with D2Mit58 in this study, in crosses involving strains C57BL /6, DU6, DUK, NZO, SM, AKR and C57L, as well as in crosses involving the Mus castaneus strain CAST/Ei. Similarly, QTLs Bw18 (Anunciado et al., 2000), Skl3 (Cheverud et al., 2001) and Obq13 (Taylor et al., 2001) on chromosome 6, and Bgeg5 (Cheverud et al., 1996), Bw14, and Afw9 (Brockmann et al., 2000) on chromosome 7 also map to within 6 cM of the markers D6Mit186 and D7Mit91 associated with the QTLs recognized in this study. Moreover (Keightley et al., 1996) found a region on chromosome 7 associated with lower 6-week body weights in mice homozygous for the DBA allele at a position 25 cM from the centromere, a finding that is similar to the one seen here. The chromosome 15 QTLs Bgeq14 and Bglq16 (Vaughn et al., 1999) have been mapped to a position 6 cM from D15Mit63, a marker associated with higher early life body weight in this study.
Early body weight predicts life span, R. A. Miller et al. 27
the early growth response 4 (Egr4) and the neuropeptide Y (Npy) genes. The central region of chromosome 7 is rich in genes implicated in the regulation of the somatotrophic axis, and includes the insulin-like growth factor-I receptor (Igfr1) gene, the growth arrest 2 (Gas2) gene, the gamma-aminobutyric acid (GABA-A) receptor, subunit beta 3 (Gabrb3) gene, the lactate dehydrogenase 1, A chain (Ldh1) gene, and the genes for uncoupling proteins-2 and -3 (Ucp2, Ucp3). For chromosome 15 both the thyroglobulin (Tgn), and the thyrotropin releas-ing hormone receptor (Trhr) genes map to within 9 cM of D15Mit63. A good deal of additional work will be needed to determine the cellular and endocrinological differences that contribute to interindividual differences in early life growth trajectory and to relate these both to the underlying genetic heterogeneity and to their effects on late life mortality risks.
Our data support the hypothesis that genetic alleles that reduce early life growth rates or body dimensions may, as a secondary effect, also retard the aging process in mammals. The most dramatic illustration of this tendency comes from studies of dog breeds, among which breed-specific body weight predicts 56% of the variation among breeds in mean longevity (Miller, 1999). Artificial selection for variation in body size among dogs has in several cases been shown to result in differences in IGF-I levels (Eigenmann et al., 1984, 1988), and four single-gene mutations that lower IGF-I levels in mice are also known to produce extended longevity (Miller, 2001b). Mouse lines selected for differences in growth rate in the first 2 months of life also differ in mean longevity, again with small body size associated with increased life expectancy (Miller et al., 2000a). Our new data suggest that this relationship may be a general one, not restricted to the products of artificial selection for extremes in growth rate or body size. It is noteworthy that laboratory-adapted mouse stocks, such as the progenitors of the inbred lines from which our UM-HET3 mice are derived, are larger in body weight (Miller et al., 2000b) and body dimensions (Harper et al., unpublished observations) than laboratory-raised stocks derived from recently wild-trapped progenitors. Further-more, the small size of wild-derived mice is associated with an increase of 24% in mean life span and a 16% increase in maximum life span of the longest lived animals (Miller et al., unpublished observations).
Early life weight values are not ‘biomarkers’ of aging, because they do not measure the accumulated effects of aging processes in the way that glycated haemoglobin levels, for example, provide an index of the accumulated effects of erythrocyte exposure to serum glucose levels. As predictors of longevity, however, they might be of value in a research programme designed to screen mutagen-treated mice for allelic variations that influence early life history patterns in ways relevance to aging. Most mutations that lead to low weight would probably be associated with developmental abnormalities that lead to early illness and death (Kuro-o et al., 1997), and hence be of little relevance to aging research, but the small subset that produces low weight through retardation of early life matura-tion might deserve further scrutiny as probes of the links
between the timing of development and the pace of age-related change.
We propose, as a hypothesis for further study, that some of the genetic variations that control the speed of body growth in young mammals also lead to alterations in the stress resist-ance of many cell types, and that these changes in cellular stress resistance endure through most or all of the life span, thus influ-encing the timing and severity of multiple forms of late-life, potentially fatal, illnesses. This idea restates some of the themes developed by Kirkwood in his discussions of trade-offs between somatic maintenance and commitment to reproductive activi-ties (Kirkwood, 1985), recasting these ideas in terms of alternate alleles that favour either rapid maturation to full body size or else slower growth intimately tied to qualitative permanent differences in cell function. It has become clear that many of the mutations that produce extended longevity in C. elegans also lead to resistance to multiple forms of stress (Johnson et al., 1996), consistent with the idea that stress resistance per se is the cause of decelerated or delayed aging in these mutants. The loci that affect stress resistance and life span in these nematodes include a prominent subset whose normal role is to delay maturation in resource-poor environments, suggesting that the connection between developmental pacing and cellular stress resistance may have deep evolutionary roots.
Our data show that some of the factors that influence late-life vulnerability to lethal illnesses are already present, and hence measurable, by the end of the third month of life. We suspect that body weight is not in itself a critical determinant of life span, but is instead a surrogate measure of still undiscovered changes set early in development with prolonged late-life effects. The next challenge will be to discover the mediators that produce these differences in weight, which are likely to include genetic modifiers of hormone levels and hormone responsiveness, and then to learn what other aspects of cell structure and function are modulated by the factors that influence weight gain in early life.
Experimental procedures
Mice
The animals used in this study were of the UM-HET3 stock, bred at the University of Michigan as the offspring of CB6F1 females and C3D2F1 males. They were weaned at 3 – 4 weeks of age, and housed in same-sex cages, initially at 3 – 4 mice per cage, and given free access to food and water; other husbandry details are as given in Miller (2001a).
Main longevity study
A total of 598 mice were entered into the study in cohorts of approximately 30 per month beginning in March 1998, and housed in the CCGCB building. Weights were recorded to the nearest gram at monthly intervals from 2 months of age until the death of the animal. Mice were immunized with erythrocytes at ages 4 and 17 months as part of another protocol, and bled
by tail venipuncture 2 weeks after each immunization. Skin biopsy samples were obtained under brief metaphane anaesthesia when each mouse was 12 months old. Mice were examined at least once each day to record date of death, and they were killed if found to be so severely ill that in the opinion of an experienced caretaker they were thought unlikely to survive more than another few days. At the time of this report 78% of the starting population had died, and the youngest cohort had reached 800 days of age. Median survival in this population was 864 days for females and 857 days for males.
Replication longevity study
A separate analysis was done of weight data obtained during the course of a longevity study of specific pathogen-free UM-HET3 mice begun in September 1993; these mice were housed in the MSRB3 building. The population consisted of 119 female and 75 male mice. Weights were recorded for these mice begin-ning at 5–6 months of age, and those mice for which weight was recorded within the range of 5.5–7.5 months were used for the analysis. These mice were, in the course of another study (Jackson et al., 1999), bled by tail venepuncture at ages 8 and 18 months, and were not subject to the immunization or biopsy procedures employed in the main study protocol. Median survival in this population was 817 days for females and 785 days for males.
Hormone measurements
Serum samples for hormone measurements were taken by tail venipuncture between the hours of 07:00 and 11:00, and stored at −70 °C for up to 3 years prior to assay. Serum thyroxine (T4) levels were determined using a monoclonal solid phase radioimmunoassay (RIA) kit (ICN Pharmaceuticals, Costa Mesa, CA, USA) run at one-quarter volume according to the manufacturer’s instructions. Each sample was assayed in dupli-cate and diluted up to 1 : 7 with phosphate-buffered saline (PBS) if necessary to achieve adequate sample volume. Serum insulin-like growth factor-I (IGF-I) levels were quantified via a double-antibody RIA kit (Diagnostic Systems Laboratories, Webster, TX, USA) run at one-quarter volume according to the manufacturer’s instructions. Prior to assay, 10 µL of serum from each individual was subjected to an acid-ethanol extraction procedure using the materials provided in the kit. Serum leptin levels were quantified with a double-antibody RIA kit (Linco Research, Inc., St. Charles, MO, USA) according to the manu-facturer’s instructions except that all volumes were reduced by a factor of 4. Each sample was assayed in duplicate using dilutions up to 1 : 10.4 with phosphate-buffered saline if neces-sary to achieve adequate sample volume. The inclusion of two pooled serum controls run in each assay (n = 13) indicated that the mean (± SD) intra-assay coefficients of variation (CV) were 6.95 ± 5.55%, 5.89 ± 4.75% and 6.12 ± 4.53% for T4, IGF-I and leptin, respectively, and that the interassay coefficient CV was less than 25% for all.
Detection of quantitative trait loci (QTL) by genome scan
Genotyping was performed by standard PCR amplification of genomic DNA from each animal using marker loci obtained from the Mouse Simple Sequence Length Polymorphism Database, Whitehead /MIT Center for Genome Research (carbon.wi.mit.edu:8000/ ftp/distribution /mouse_sslp_releases / may99). Polyacrylamide gels were scored using the ALFExpress automated sequencer as described (Jackson et al., 1999). Ana-lyses at marker loci were performed on the 450 mice for which genotypes were complete at the time of this report (211 males and 239 females); these were the earliest born cohorts of the 598 mice used for the main longevity study. Genome-wide searches for quantitative trait loci were performed using a single point locus scan for each phenotype. To make the model consistent for differentially informative markers, four-way infor-mative markers were split into two sets of biallelic markers informative for either the maternally or paternally transmitted alleles. The total number of biallelic markers was 188, of which 96 reported inheritance from the mother (BALB/cJ vs. C57BL / 6J, alleles abbreviated as C and B6) and 92 from the father (C3H/ HeJ vs. DBA /2J, alleles abbreviated as C3 and D2). Analysis of variance was performed for single biallelic loci using PROC MIXED in SAS version 8.0 (SAS Institute). The following statis-tical model was used:
yk = µ + g + εk,
where yk is the phenotype for the kth individual, µ is the overall
mean, g is the biallelic marker effect, and εk is the error term
with N(0, σ2ε). Phenotype data were not transformed. Signific-ance was assessed by permutation testing performed essentially as described (Jackson et al., 1999), with 1000 permutations of the data.
Other statistical methods
The main longevity study population initially consisted of 311 females and 287 males. Of these, 11 females and 44 males were removed from the population prior to their natural death, either because of damage inflicted by fighting (32 males; all males were killed from cages in which any male showed fight wounds), unintended pregnancy (four females), death during an injection or surgical procedure (seven animals), or a record keeping error in which date of death could not be determined (11 mice). These 55 mice were excluded from any statistical calculation in which age at death was evaluated.
Early body weight predicts life span, R. A. Miller et al. 29
distribution of weights among mice of the same age and gender.
In the main study, the strength of the association between weight and longevity was evaluated by Cox proportional hazard regression using the percentile scores, one at a time, as predictor variables. Mice alive at time of the report were treated as censored observations. For the replication study, in which all mice were dead at the time of analysis, we used the general linear regression procedures of Statistica, in which life span was evaluated as a function of weight (continuous variable), sex (categorical), and the [sex–weight] interaction term.
Acknowledgments
This work was supported by NIA grant R01-AG11687, and by Core grants AG13283 and AG08808. J.H. was supported by NIA training grant T32-AG00114. We thank Gretchen Buehner, Maggie Vergara, Steve Pinkosky, Steve Durkee, Emily Gray, Dana Knutzen, and Saumya Sivaram for technical and husbandry assistance.
References
Ahima RS, Prabakaran D, Flier JS (1998) Postnatal leptin surge and regulation of circadian rhythm of leptin by feeding. Implications for energy homeostasis and neuroendocrine function. J. Clin. Invest.101, 1020 –1027.
Anunciado RV, Ohno T, Mori M, et al. (2000) Distribution of body
weight, blood insulin and lipid levels in the SMXA recombinant inbred
strains and the QTL analysis. Exp. Animals49, 217–224.
Bartke A (1965) The response of two types of dwarf mice to growth
hormone, thyrotropin, and thyroxine. Gen. Comparative Endocrinol.
5, 418 – 426.
Bartke A, Coschigano K, Kopchick J, et al. (2001) Genes that prolong
life: relationships of growth hormone and growth to aging and life span. [Review] [106 refs]. J. Gerontol. A, Biol. Med. Sci.56, B340 – B349.
Brockmann GA, Haley CS, Renne U, Knott SA, Schwerin M (1998) Quantitative trait loci affecting body weight and fatness from a mouse
line selected for extreme high growth. Genetics150, 369 –381.
Brockmann GA, Kratzsch J, Haley CS, Renne U, Schwerin M, Karle S (2000) Single QTL effects, epistasis, and pleiotropy account for two-thirds of the phenotypic F (2) variance of growth and obesity in DU6i
x DBA/2 mice. Genome Res.10, 1941–1957.
Brown-Borg HM, Borg KE, Meliska CJ, Bartke A (1996) Dwarf mice and
the ageing process. Nature384, 33.
Cheverud JM, Routman EJ, Duarte FA, van Swinderen B, Cothran K, Perel C (1996) Quantitative trait loci for murine growth. Genetics142, 1305 –1319.
Cheverud JM, Vaughn TT, Pletscher LS, et al. (2001) Genetic architecture
of adiposity in the cross of LG/J and SM/J inbred mice. Mammalian
Genome12, 3 –12.
Coschigano KT, Clemmons D, Bellush LL, Kopchick JJ (2000) Assessment of growth parametets and life span of GHR/BP gene-disrupted mice. Endocrinology141, 2608–2613.
Donahue LR, Beamer WG (1993) Growth hormone deficiency in ‘little’ mice results in aberrant body composition, reduced insulin-like growth factor-I and insulin-like growth factor-binding protein-3 (IGFBP-3), but
does not affect IGFBP-2-1 or -4. J. Endocrinol.136, 91–104.
Eigenmann JE, Amador A, Patterson DF (1988) Insulin-like growth factor I levels in proportionate dogs, chondrodystrophic dogs and in giant
dogs. Acta Endocrinol.118, 105 –108.
Eigenmann JE, Patterson DF, Froesch ER (1984) Body size parallels insulin-like growth factor I levels but not growth hormone secretory capacity. Acta Endocrinol.106, 448 – 453.
Flurkey K, Papaconstantinou J, Miller RA, Harrison DE (2001) Lifespan extension and delayed immune and collagen aging in mutant mice
with defects in growth hormone production. Proc. Natl Acad. Sci. USA
98, 6736 – 6741.
Jackson AU, Fornes A, Galecki A, Miller RA, Burke DT (1999) Longitudinal QTL analysis of T cell phenotypes in a population of four-way cross
mice. Genetics151, 785–795.
Johnson TE, Lithgow GJ, Murakami S (1996) Hypothesis: interventions that increase the response to stress offer the potential for effective life prolongation and increased health. J. Gerontol. A, Biol. Sci. Med.
Sci.51, B392–B395.
Keightley PD, Hardge T, May L, Bulfield G (1996) A genetic map of
quantitative trait loci for body weight in the mouse. Genetics142,
227–235.
Kirkwood TBL (1985) Comparative and evolutionary aspects of longevity. In Handbook of the Biology of Aging (Finch CE, Schneider EL, eds). New York: Van Nostrand Reinhold Co, pp. 27– 44.
Kuro OM, Matsumura Y, Aizawa H, et al. (1997) Mutation of the mouse
klotho gene leads to a syndrome resembling ageing. Nature390, 45 – 51.
Li Y, Deeb B, Pendergrass W, Wolf N (1996) Cellular proliferative
capacity and life span in small and large dogs. J. Gerontol. A, Biol.
Sci. Med. Sci.51, B403 –B408.
Mehrabian M, Wen PZ, Fisler J, Davis RC, Lusis AJ (1998) Genetic loci controlling body fat, lipoprotein metabolism, and insulin levels in a
multifactorial mouse model. J. Clin. Invest.101, 2485 –2496.
Miller RA (1999) Kleemeier Award Lecture: Are There Genes for Aging? J. Gerontol.: Biol. Sci.54A, B297–B307.
Miller RA (2001a) Biomarkers of aging: prediction of longevity by using age-sensitive T-cell subset determinations in a middle-aged, genetically
heterogeneous mouse population. J. Gerontol. A, Biol. Sci. Med. Sci.
56, B180 –B186.
Miller RA (2001b) Genetics of increased longevity and retarded aging
in mice. In Handbook of the Biology of Aging (Masoro EJ, Austad SN,
eds). San Diego: Academic Press, pp. 369 –395.
Miller RA, Chrisp C, Atchley WR (2000a) Differential longevity in mouse stocks selected for early life growth trajectory. J. Gerontol.: Biol. Sci.
55A, B455 –B461.
Miller RA, Dysko R, Chrisp C et al. (2000b) Mouse (Mus musculus) stocks
derived from tropical islands: new models for genetic analysis of life history traits. J. Zool.250, 95–104.
Orentreich N, Matias JR, DeFelice A, Zimmerman JA (1993) Low methionine ingestion by rats extends life span. J. Nutr.123, 269 –274. Taylor BA, Phillips SJ (1997) Obesity QTLs on mouse chromosomes 2 and
17. Genomics43, 249 –257.
Taylor BA, Wnek C, Schroeder D, Phillips SJ (2001) Multiple obesity QTLs identified in an intercross between the NZO (New Zealand obese) and
the SM (small) mouse strains. Mammalian Genome12, 95 –103.
Turturro A, Hass B, Hart RW, Allaben WT (1998) Body weight impact
on spontaneous diseases in chronic bioassays. Int. J. Toxicol. 17
(Suppl. 2), 79–99.
Vaughn TT, Pletscher LS, Peripato A, et al. (1999) Mapping quantitative
trait loci for murine growth: a closer look at genetic architecture. Genet. Res.74, 313 –322.
Weindruch R, Walford RL (1988) The Retardation of Aging and Disease