2019 International Conference on Artificial Intelligence, Control and Automation Engineering (AICAE 2019) ISBN: 978-1-60595-643-5
Research on Characteristics of Vessel CO
2Emissions from Seas
Surrounding China
Zheng WANG
1,*, Ying LIU
2, Cui-hong QIN
1,
Wei ZHANG
1and Chuan-sheng PENG
11China Waterborne Transport Research Institute, Beijing 100088, China
2China Meteorological Administration, Beijing, 100081, China
*Corresponding author
Keywords: Ship, CO2 emission inventory, Automatic Identification System, Activity-based
approach, Emission characteristics.
Abstract. In order to analyze the characteristics of CO2 emission of coastal vessels in China, this study collects and analyzes the static data and emission parameters of ships at home and abroad based on the data of automatic identification system of ships. Based on the actual navigation data of ships, The carbon emission inventory was also analyzed. The emission characteristics of the five vessels under port, moorings, harbor maneuver, low speed and cruise were analyzed, and the spatial emission characteristics of 2km × 2km were plotted. The result shows that the carbon dioxide emissions generated by ship activities in the near perimeter of China are estimated at 53.8482 million tons a year. Source of discharge analysis shows that the host is the main source of emissions from the three main sources of emissions on the ship's main engine, auxiliary engines and boilers. Sailing at low speed cruise state emissions.
Introduction
Prosperous maritime trade is a powerful driving force to promote the prosperity and development of China's economy, but at the same time, the ship will emit large quantities of carbon dioxide during the voyage, the vessel activity resulting in increased GHG emissions from ships getting worse. The current study has less research on China's coastalgreenhouse gas emissions, making the ship's greenhouse gas emissions have to face the “unclear” control environment. Therefore, it is estimated that China's coastal ship'sgreenhouse gas emissions is an important basis for China's response to ship greenhouse gas emission reductions.
The method of calculating the current ship greenhouse emissions inventories are two kinds: a first estimating method according to the fuel amount of fuel consumed by the ship; the second with an automatic identification system (A utomatic I dentification system, AIS) collecting ship speed of the ship, The power method of real-time navigation data such as sailing time and geographical position. Dynamic GHG emissions method consists of the method can be established actual reaction time and spatial characteristics of the dischargevessel, can provide more effective data support ship reduction of greenhouse gas emissions than the fuel advantage method. The disadvantage of the power method is that it requires a large amount of data and requires high computational parameters.
development of local marine pollution control laws and regulations provide an important basis [2]. Based on the port as the basic unit, Liu Jing established a inventory of atmospheric emission sources for ships in Qingdao from the bottom up, and used a self-developed composite source atmospheric diffusion model based on GIS geographic information systems for source analysis. The results showed that ship emissions from Qingdao City were discharged. SO2 and the NOxconcentration contribution of local atmospheric pollutants respectively 8.0% and 12.9%[3]. Fu Qingyan et al. estimated the 2010 inventory of Shanghai's ship air pollution sources [4]. Ye Siqi et al. used the emission factor method based on the engine power and fuel consumption of ships to estimate the 2010 ship emission inventory in Guangdong Province, and based on this, studied the spatial and temporal distribution characteristics of various types of ship emissions in the area [5]. Tan Jianwei and others used the ship's automatic identification system to collect real-time navigation data such as vessel speed, navigation time, and geographical location information of ocean-going vessels, and used the dynamic method to calculate the emissions inventory of ocean-going vessels in Dalian Port in 2012 [6]. Yang Jing et al. estimated the ship emission inventory for Shenzhen in 2010 [7]. Wang Zheng et al. used AIS data to calculate and analyze the emissions of a bulk carrier during a voyage cycle [8]. There is little research on the inventory of marine greenhouse gas emissionsin coastal areas of China.
In this study, Chinese coastal areas AIS collection vessel buried position and speed information, using a dynamic method to estimate the emissions inventory active region 2014 of the ship, in order to obtain the grid 1 Km × 1 Km The spatial distribution of air pollutant emissions from ships to visually identify the spatial distribution of pollutants.
Research Method
Study Areas and Objects
Taking the coastal areas of China (east longitude 105 ° to 125 °, north latitude 16 ° to 41 °) and the base year 2014 as the base year, the type of ship studied is a merchant ship(excluding warships). Study of GHG emissions for the CO2.
Calculation Methods
Ship CO2 emissions inventory using the calculation method of the AIS data-based power method to calculate the ship's emissions, the ship engine, ship's auxiliary engine, and boiler output energy (unit: kW·h ) are multiplied by the emission factors corresponding to various emissions. Based on the functional relationship, the emission factor used in the calculation is measured in g/kW·h.
The formula1 given below is the basic formula for calculating ship emissions based on power. The calculation formula for the output power of ships, auxiliary engines and boilers.
Ei=MCR×LF×Act×EFi×FCF×CFi (1) among them:
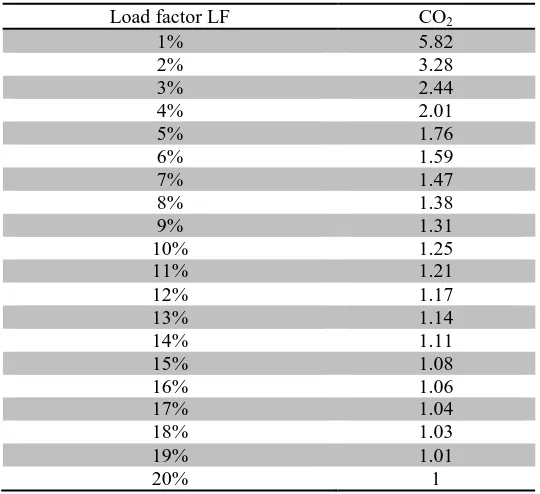
Ei For a certain type of pollutant emissions, the unit is: g; MCR is the maximum continuous rated power of MCR for the ship's main engine, output power of the ship's auxiliary engine or boiler. In the specific calculation, when the host load is less than 20%, the load power of the host needs to be adjusted, the maximum continuous power multiplied by its low load adjustment factor ( LF ), and the auxiliary power needs to be adjusted according to different ship conditions. The specific adjustment measures are Auxiliary engine power is multiplied by the load factor ratio of the ship's auxiliary engine; boiler load is its power, kW ; Act is the ship's sailing time, and the unit is: h. EF is
the emission factor for this pollutant in g/kW·h ; FCF is the fuel correction factor, dimensionless unit; CFi is the emission correction factor, dimensionless unit.
Formula2 is the formula for the low load adjustment factor of the ship's ship.
3 _
Speed Actual
among them:
LF is the ship's host low load adjustment factor, dimensionless unit. See Table 1. Speed_Actual
The actual speed of the ship's navigation, unit: Festival; Speed_Maximum is the ship's maximum design speed, unit: knot.
[image:3.595.122.475.232.316.2]The ship emission inventory calculated by the Institute includes pollutant discharges from the main engine, auxiliary engine and boiler. During the calculation process, the operating conditions of the ship are classified into five types: cruising, low-speed cruising, port maneuvering, port docking and anchoring. The method of determination is IMO.The navigation status determination method in the calculation of global greenhouse gas emissions [9], see Table 1 for specific determination parameters.
Table 1. Principles for determining the state of navigation of ships.
Ship speed status
Ship speed < 1 knots Berthing
1 knots ≤ ship speed ≤ 3 knots Mooring More than 3 knots and less than 20% of MCR In-port mobility Greater than 20% of MCR and less than 65% of MCR Low speed sailing
More than 65% of MCR cruise
When the ship is equipped with abatement equipment, it is necessary to use emission control factors to correct the pollutant discharge. The ship selected for this study has not yet been installed. Therefore, the control factor for emission reduction technology in the calculation is 1 and the data obtained is that the vessel has not been installed. Emissions under the conditions of the exhaust device. The calculation process assumes that the boiler is turned off when the vessel is in the cruise phase and the main engine load is greater than 20%[10].
Emission Factors and Other Parameters
There are few researches on ship emission factors in China. This study selected the emission factor of the air pollutant emission inventory used by the US EPA[10] (see Table 2 ~Table 4 ). Host load factor Institute is divided into main engine and auxiliary engine load factor load factor, Yuan auxiliary engines will vary due to different ship types and modes of operation of the main engine load factor determined by the maximum sailing speed and the actual speed of navigation, this study reference The ICF research results [10] selected the engine load factor (see Table 5, Table 6). The activity time of the ship in different working conditions is extracted from AIS data. In coastal shipping fuel sulfur content of 2.7% residual oil. The static power parameters of the ship's main and auxiliary engines are compared using the data of Lloyd's database. The MMSI and IMO numbers are used to match with the AIS data. The missing data is supplemented by the ship's average main and auxiliary power; the boiler power is missing from the database and survey data is used.
Table 2. Ship main engine CO2 emission factor EFi (unit of measurement: g/kW·h).
Ship type Fuel type CO 2
Low speed diesel engine RO residue 620.62 Medium speed diesel engine RO residue 677.91
Note:Low speed diesel engine, maximum speed <130r/min; for medium speed diesel engine, speed>130r/min
Table 3. Ship auxiliary engine CO2 emission factor EFa (unit of measurement: g/kW·h).
Fuel type CO 2
RO residue 772.54
Table 4. Boiler emission factor EFbi (unit of measurement: g/kW·h).
CO2
Table 5. Ship host low load adjustment factor LF (dimensionless).
Load factor LF CO2
1% 5.82
2% 3.28
3% 2.44
4% 2.01
5% 1.76
6% 1.59
7% 1.47
8% 1.38
9% 1.31
10% 1.25
11% 1.21
12% 1.17
13% 1.14
14% 1.11
15% 1.08
16% 1.06
17% 1.04
18% 1.03
19% 1.01
[image:4.595.66.530.356.464.2]20% 1
Table 6. Ship auxiliary load ratio factor LF_A (dimensionless).
Ship type Cruise state Slowdown area sailing
Maneuvering state
Berthing Mooring
Bulk carrier 0.17 0.27 0.45 0.22 0.22
Container Ship 0.13 0.25 0.5 0.17 0.17
General cargo
ship 0.17 0.27 0.45 0.22 0.22
Tanker 0.13 0.27 0.45 0.67 0.67
Roll-on ship 0.15 0.3 0 0.45 0.3 0 0.3 0
Other types 0.17 0.27 0.45 0.22 0.22
Results and Discussion
CO2 Emissions Inventory
Calculate the Total Scope of Emissions. In 2014, the emissions of coastal and ocean-going vessels in China are shown in Table 7. Among them, carbon dioxide emissions were 5384.82 thousand tons.
Table 7. CO2 emissions of ship in surrounding of China's sea areas in 2014.
carbon dioxide(ten thousand tons) Total calculation area range 5384.82
Press the emissions by source, host emissions accounted for 62.88 percent overall emissions; auxiliary emissions accounted for 36.1% of total emissions; boiler emissionsaccounted for 1.02% of total emissions.
Divided by state of navigation, the state of discharge of the docking station accounted for 19.58% of the total emissions; the maneuvering state emissions accounted for 15.15%of the total emissions; the mooring state emissions accounted for 1.38% of the total emissions; the low-speed cruising emissions accounted for 48.83% of the total emissions. The cruise state emissions account for 15.06% of the total emissions. The reason for the large-scale low-speed cruising emissions is mainly due to the sluggish shipping patterns in recent years, and the shipping companies have taken more speed and fuel economy to reduce operating costs.
Figure 1. Spatial Distribution of CO2 Emissions in Some Chinese Seas in 2014.
Monthly Changes in Emissions. 2014 monthly carbon dioxide is shown in Figure 2, wherein the discharge May most about 5,447,500 tons, February emission happened approximately 3,141,300 tons. From the point of view of change, the monthly changes are significant, and there are significant emissions during the summer and Christmas shipping peaks. In February, during the Spring Festival, there are fewer ship activities and less emissions.
Figure 2. 2014 part of China Sea map changes in CO2 emissions monthly.
The Main Source of Error
The calculation of the emission inventory involves many factors such as fuel quality, ship power, activity level and emission factor. The selection of each value will affect the accuracy of the emission inventory. The main factor influencing the accuracy of this inventory is the impact of emission factors. China has not conducted systematic emission factor studies. The selection of foreign emission factors is an important source of uncertainty.
Summary
(1) China in 2014 the CO2 emissions generated during the year due to ship activities in the area near the surrounding seas are approximately 53,824,200 tons.
[image:5.595.87.512.421.569.2]36.1% of the total emissions of the auxiliary emissions; Boiler emissions account for 1.02% of total emissions.
(3) on the state of navigation The low-speed cruising discharge is the largest, accounting for 48.83% of the total emissions.
(4) The spatial analysis of the ship's discharge of pollutants shows that the ship is the area with the highest concentration of pollutants in and out of the port area.
Acknowledgement
This work was supported by the National Key Research and Development Program of China (No. 2016YFC0208300)
Reference
[1] Yang, D.Q., Kwan, S.H., Lu, Y. An emission inventory of marine vessels in Shanghai in 2003. [J].Environmental Science& Technology, 2007, 41(15).
[2] Jin Taosheng, Yin Xiaoge, Xu Jia et al. Inventory of Air Pollutant Emissions of Transport Vessels in Tianjin Port [J]. Marine Environmental Science, 2009, 28(06): 623-625.
[3] Liu Jing, Wang Jing, Song Faxi. Establishment and Application of Air Pollution Emission Inventory for Port Ships in Qingdao City [J]. China Environmental Monitoring, 2011, 27(3):50-53.
[4] Fu Yan Qing, Shen Yin, Zhang Jian Shanghai ship emission inventory of air pollutants [J]. Journal of Safety and Environment 2012 (5): 57-64.
[5] Yesi Qi, Zheng Junyu, Panyue Yun, Guangdong Province, ships, and other sources of emissions inventory and research time and space [J] Distribution of Environmental Science, 34(3): 537-547
[6] Tan Jianwei, Song Yanan, Ge Yunshan et al. Ocean Shipping Discharge Inventory of Dalian Sea Area [J]. Environmental Science Research, 2014, 27(12): 1426-1431.
[7] Yang Jing, Yin Peiling, Ye Siqi, etc., Shenzhen Ship Emission Inventory and Time-space Characteristics [J]. Environmental Science, 2015:36(4): 1217-1226.
[8] Wang Zheng, Zhang Wei, Yan Xiongfei et al. Study on ship emission inventory and emission characteristics of typical routes [J]. Traffic Energy Conservation and Environment Protection, 2015:12(5):44-49.
[9] IMO. Third IMO Greenhouse Gas Study 2014[R]. 2015.