Open Access
BMC Musculoskeletal Disorders 2002,
3 x
Research article
Appendicular bone mass and knee and hand osteoarthritis in
Japanese women: a cross-sectional study
Yuichirou Yahata
1
, Kiyoshi Aoyagi*
1
, Shoji Yoshida
2
, Philip D Ross
3
,
Itsuro Yoshimi
4
, Kazuhiko Moji
5
and Tai-ichiro Takemoto
1
Address: 1Department of Public Health, Nagasaki University Graduate School of Biomedical Sciences, 1-12-4 Sakamoto, Nagasaki 852-8523 Japan, 2Department of Orthopedic Surgery, Nagasaki University Graduate School of Biomedical Sciences, 1-7-1 Sakamoto, Nagasaki 852-8501 Japan, 3Merck & Co., Inc, 126 East Lincoln Ave., RY32-521, Rahway, NJ 07065 USA, 4Epidemiology and Biostatistics Division, National Cancer Center Research Institute, 6-5-1 Kashiwanohara, Kashiwa, Chiba 277-0882 Japan and 5Research Center for Tropical Infectious Diseases, Nagasaki University Institute of Tropical Medicine, 1-12-4 Sakamoto, Nagasaki 852-8523 Japan
E-mail: Yuichirou Yahata - yahata@net.nagasaki-u.ac.jp; Kiyoshi Aoyagi* - kiyoshi@net.nagasaki-u.ac.jp; Shoji Yoshida - Yoshidasho@aol.com; Philip D Ross - philip_ross@merck.com; Itsuro Yoshimi - yoshimi@hsa.att.ne.jp; Kazuhiko Moji - moji-k@net.nagasaki-u.ac.jp;
Tai-ichiro Takemoto - takemoto@net.nagasaki-u.ac.jp *Corresponding author
Abstract
Background: It has been reported that there is an inverse association between osteoarthritis (OA) and osteoporosis. However, the relationship of bone mass to OA in a Japanese population whose rates of OA are different from Caucasians remains uncertain.
Methods: We studied the association of appendicular bone mineral density (second metacarpal; mBMD) and quantitative bone ultrasound (calcaneus; stiffness index) with knee and hand OA among 567 Japanese community-dwelling women. Knee and hand radiographs were scored for OA using Kellgren-Lawrence (K/L) scales. In addition, we evaluated the presence of osteophytes and of joint space narrowing. The hand joints were examined at the distal and proximal interphalangeal (DIP, PIP) and first metacarpophalangeal/carpometacarpal (MCP/CMC) joints.
Results: After adjusting for age and body mass index (BMI), stiffness index was significantly higher in women with K/L scale, grade 3 at CMC/MCP joint compared with those with no OA. Adjusted means of stiffness index and mBMD were significantly higher in women with definite osteophytes at the CMC/MCP joint compared to those without osteophytes, whereas there were no significant differences for knee, DIP and PIP joints. Stiffness index, but not mBMD, was higher in women with definite joint space narrowing at the CMC/MCP joint compared with those with no joint space narrowing.
Conclusions: Appendicular bone mass was increased with OA at the CMC/MCP joint, especially among women with osteophytes. Our findings suggest that the association of peripheral bone mass with OA for knee, DIP or PIP may be less clearcut in Japanese women than in other populations.
Published: 8 October 2002
BMC Musculoskeletal Disorders 2002, 3:24
Received: 29 June 2002 Accepted: 8 October 2002
This article is available from: http://www.biomedcentral.com/1471-2474/3/24
Background
Osteoarthritis (OA) and osteoporosis are both common conditions in elderly women [1,2]. It would be anticipat-ed that the conditions frequently coexist due to their high prevalence, but some studies have suggested that there is an inverse association between the occurrence of OA and osteoporosis [3–12]. Increased bone mass has been pro-posed as a risk factor for OA independent of age and other factors, because higher bone mass may increase bone stiff-ness and thereby increase loading of articular cartilage and lead to cartilage damage [13,14]. Alternatively, OA and osteoporosis may only be indirectly related through weight, mechanical stress, genetic factors, or other factors that affect both bone mass [15,16] and the risk of OA [17,18].
Recent reviews reported that bone mass or bone mineral density (BMD) (measured with various techniques at dif-ferent skeletal sites) was significantly increased in the OA cases compared with age- and sex-matched controls [19– 22]. A recent large epidemiologic study showed higher bone density at both central (hip and lumbar spine) and peripheral (radius and calcaneus) sites in elderly women with moderate-severe radiographic grades of hip OA after adjusting for age, weight and other anthropometric char-acteristics [11]. Population-based epidemiologic studies have shown that women with radiographic changes of knee [5,9,12,23] or hand OA [5,10,12] have increased bone mass after adjustment for age and other covariates, compared to those without OA.
Most previous studies reported the association of OA with bone mass among Caucasian populations, and there are few data among Asian populations. One study reported that Japanese patients with knee OA had greater bone mass at the hip and lumbar spine compared to age and weight matched controls [24]. We reported elsewhere that, compared to Caucasians, Japanese women appear to have a substantially higher prevalence of knee OA, but much lower prevalence of hand OA except distal inter-phalangeal (DIP) joint [25]. This suggests that the preva-lence and/or types of risk factors for OA may differ between Japanese and Caucasian populations.
Although BMD declines throughout the skeleton with age, there is significant variation between skeletal sites, even within an individual. Therefore, we hypothesized that bone measurements at the heel might be more strongly re-lated to OA at the knee, since both sites are weight-bear-ing, whereas hand BMD measurements might be more strongly related to hand OA. Furthermore, it has been sug-gested that certain features of OA (such as osteophytes) may be reparative in nature, whereas other features (such as joint cartilage damage) are destructive, and may there-fore have a different relationship with bone mass at
near-by (or distant) skeletal sites. To investigate these issues, as well as the general issue of whether bone density is asso-ciated with OA in Japanese, we examined the cross-sec-tional association between radiographic knee or hand OA and appendicular bone mass at weight-bearing and non-weight-bearing sites among a community-based sample of Japanese women. More specifically, we examined the association between bone mass and different severity lev-els of radiographically defined knee and hand OA.
Subjects and Methods
The Hizen-Oshima Study is a prospective population-based cohort study of musculoskeletal conditions (i.e., os-teoporosis and osteoarthritis). We recruited community-dwelling women aged 40 years or over in Oshima town, Nagasaki prefecture, Japan. The women were identified by the municipal electoral list and contacted through mail-ings. As of March 31, 1999, the town of Oshima had a population of 5817 (2840 male and 2977 female), in which the population of women aged 40 or over was 2006. The proportion of women aged 40 or over in Oshi-ma (2006/5817 = 34%) was somewhat higher than the national average of 27%, based on the 1995 Census for all of Japan. All women aged 40 or over were invited to par-ticipate. The baseline examination was performed at the Oshima Health Center between 1998 and 1999. A total of 586 women (approximately 30% of eligible women) par-ticipated in the study. The response rates in the age groups 40–49, 50–59, 60–69, 70–79, and 80 years or over were 10, 28, 45, 39, and 15%, respectively. The low response among younger women may reflect time constraints of work or family, or they may have not been interested in their musculoskeletal health. Low response among the oldest women may reflect difficulty attend the study site because of poor health or lack of transportation. We com-pared the age distribution of participants vs. non-partici-pants. In total, the mean age of participants (63.9 years) was significantly higher than that of non-participants (61.1 years). Despite having a shipyard in the town, Oshi-ma is a Oshi-mainly rural (farming/fishery) district. Approxi-mately half of the women who participated in the study continue to grow rice and vegetables by manual labor, sometimes using machinery. All participants were nonin-stitutionalized, living independently at baseline, and were able to ambulate independently (with or without a cane), and all women except one were able to go up and down stairs. All subjects gave written informed consent before examination. This study was approved by the local Ethics Committee.
metacarpophalan-geal (MCP) joint; each hand film was taken separately. Ra-diographs were graded according to the criteria described by Kellgren and Lawrence (K/L) [26]. In addition, since the K/L system of radiographic grading for OA does not differentiate between osteophytic and joint space narrow-ing changes of OA [23,27], we separately evaluated the presence of osteophytes and of joint space narrowing for each subject, without regard to the K/L grade; first, we evaluated the osteophytes for all subjects, after that the joint space narrowing. Each joint was scored for the sever-ity of both osteophytes and joint space narrowing, using categories of none (0), questionable (1), or definite (2). Each subject was classified according to the most severe grade within a given joint group for each of the radio-graphic findings (K/L grade, osteophytes or joint space narrowing). We examined the following joint groups: the knees, the second and third distal interphalangeal (DIP), the proximal interphalangeal (PIP), and the metacar-pophalangeal /carpometacarpal (MCP/CMC) joints of the hands. We reported earlier the prevalence of radiographic OA of the knee and hand between Japan and the United States [25]. To standardize readings between the studies, the Japan reader (S.Y.) trained with the primary reader of the Framingham Osteoarthritis Study prior to reading the Japanese films, and used the same atlas and grading scheme. To evaluate interrater reliability for OA grade, we randomly selected 40 subjects from each population and had the Framingham and Japan readers read each set of films. In testing whether OA was present or absent, the ka-ppa statistic was 0.77 (p < 0.001) for knee and 0.68 (p < 0.001) for hand (combining all joints), indicating good agreement between readers. Intrarater reliability (Kappa) for OA grade was 0.77 for the knee (p < 0.001), but was not evaluated separately for the hands. Spearman correla-tion coefficients between osteophytes and joint space nar-rowing were 0.59 (p < 0.001) for knee, 0.63 (p < 0.001) for DIP, 0.38 (p < 0.001) for PIP and 0.59 (p < 0.001) for MCP/CMC. Our radiograph reader (S.Y.) was blinded to the subject's age, bone mass and anthropometric charac-teristics.
Quantitative ultrasound of the right calcaneus (heel) bone was determined by measurement of broadband ul-trasound attenuation (BUA) and the speed of sound (SOS) using the Achilles ultrasound bone densitometer (Lunar Corp., Madison, WI). Stiffness index, a function of BUA and SOS measurements, was calculated according to the manufacturer's equation. Measurements of the right second metacarpal bone mineral density (mBMD) were obtained from hand radiographs using an optical densit-ometer, the Bonalyzer II (Teijin Ltd., Tokyo). The repro-ducibility expressed as coefficient of variation (CV), measured on 5 times consecutively within 1 h with repo-sitioning between each measurement, was 1.71% for stiff-ness index calculated in 17 healthy volunteers, and 0.56% for mBMD measurements calculated in a random sample of 20 of the subjects.
Height (m) and weight (kg) were measured with the sub-ject in light clothing and without shoes, and body mass index (BMI) was calculated as weight (kg)/height (m2).
Analysis
Data were analyzed using the Statistical Analysis System Version 6.12. (SAS Institute Inc. Cary, NC). For reasons of poor technical quality, the radiographs of 19 women did not allow reliable OA definition, leaving 567 women for the analyses. The relation of stiffness index and mBMD, after adjustment for age and BMI, with OA grade (0–4), osteophyte status (none, questionable, definite) or joint space narrowing status (none, questionable, definite) was evaluated by linear regression analysis using PROC GLM in SAS with testing of differences in least-square means between women with radiographic findings and those with no OA or with no osteophyte or no joint space nar-rowing.
Results
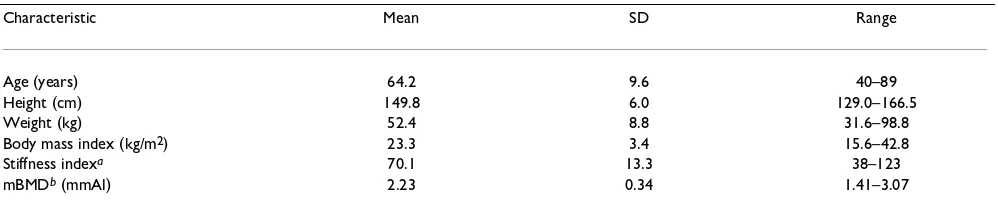
[image:3.612.57.556.99.207.2]Characteristics of the subjects are shown in Table 1. Age and BMI adjusted means with standard errors for bone mass (stiffness index and mBMD) by radiographic grade
Table 1: Characteristics of the subjects (N = 567).
Characteristic Mean SD Range
Age (years) 64.2 9.6 40–89
Height (cm) 149.8 6.0 129.0–166.5
Weight (kg) 52.4 8.8 31.6–98.8
Body mass index (kg/m2) 23.3 3.4 15.6–42.8
Stiffness indexa 70.1 13.3 38–123
mBMDb (mmAl) 2.23 0.34 1.41–3.07
of OA (grade 0–4) at the knee, DIP, PIP and CMC/MCP joints are shown in Table 2. Stiffness index was signifi-cantly lower in women with grade 4 at knee than those in no OA, but was not different in women with OA grades (1–4) at DIP and PIP from those with no OA. On the oth-er hand, stiffness index was significantly highoth-er in women with grade 3 at CMC/MCP joint compared with those with no OA. Metacarpal BMD was not significantly differ-ent in women with OA grades (1–4) at all joints evaluated from those with no OA. Bone mass (stiffness index and mBMD) did not show a significant trend with grade of OA at each joint.
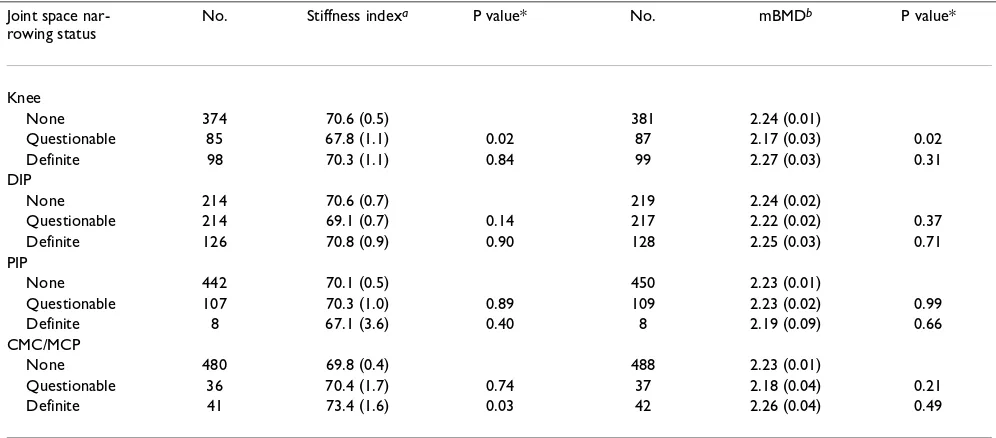
Adjusted means of bone mass (stiffness index and mB-MD) were significantly higher in women with definite os-teophytes at the CMC/MCP joint compared to those with no osteophytes, whereas there were no significant differ-ences for the knee, DIP and PIP joints (Table 3). Stiffness index, but not mBMD, was significantly higher in women with definite joint space narrowing at CMC/MCP joint
compared to those with no joint space narrowing (Table 4).
Because of the relatively low prevalence of radiographic changes of definite OA in women below age 60 and the possible hormonal effects on both bone mass and OA in perimenopausal women, the above analyses were repeat-ed in the 405 women agrepeat-ed 60 years or over. Similar results were obtained in this age group (Tables 5,6,7). Stiffness index was significantly lower in women with grade 1 at CMC/MCP joint than those in no OA. Metacarpal BMD was significantly lower in women with grade 1 at knee than those in no OA (Table 5); the same was observed for women with questionable knee joint space narrowing (Table 7). Metacarpal BMD tended to be higher in women with definite osteophytes at CMC/MCP joint compared to those with no osteophytes (Table 6).
[image:4.612.58.553.110.445.2]We also compared bone mass (stiffness index and mB-MD) between women with OA (K/L grades 1–4) and no
Table 2: Age and body mass index adjusted means (SEM) of bone mass (stiffness indexa and mBMDb) by osteoarthritis (OA) grade at the knee, distal interphalangeal (DIP), proximal interphalangeal (PIP), carpometacarpal/metacarpophalangeal (CMC/MCP) joints.
OA grades No. Stiffness indexa P value* No. mBMDb P value*
Knee
0 261 70.7 (0.7) 267 2.25 (0.02)
1 110 69.7 (1.0) 0.40 112 2.20 (0.02) 0.09 2 103 69.8 (1.0) 0.46 104 2.21 (0.02) 0.20
3 69 70.5 (1.3) 0.90 70 2.28 (0.03) 0.44
4 14 63.3 (2.7) 0.01 14 2.16 (0.07) 0.22
Test for trend 0.18 Test for trend 0.63 DIP
0 122 71.2 (1.0) 125 2.25 (0.02)
1 98 70.0 (1.0) 0.36 98 2.20 (0.03) 0.11
2 214 69.3 (0.7) 0.11 219 2.23 (0.02) 0.43
3 59 69.5 (1.3) 0.30 59 2.23 (0.03) 0.52
4 64 71.5 (1.3) 0.87 66 2.27 (0.03) 0.69
Test for trend 0.82 Test for trend 0.65 PIP
0 355 70.5 (0.5) 363 2.23 (0.01)
1 106 69.1 (1.0) 0.24 107 2.27 (0.02) 0.14
2 88 70.0 (1.1) 0.73 89 2.22 (0.03) 0.73
3 5 63.6 (4.5) 0.13 5 2.27 (0.11) 0.72
4 3 72.7 (5.8) 0.70 3 2.08 (0.14) 0.29
Test for trend 0.39 Test for trend 0.91 CMC/MCP
0 420 70.1 (0.5) 428 2.24 (0.01)
1 47 67.6 (1.5) 0.11 48 2.16 (0.04) 0.05
2 55 69.8 (1.4) 0.84 55 2.25 (0.03) 0.80
3 32 73.9 (1.8) 0.04 33 2.26 (0.04) 0.58
4 3 72.9 (5.8) 0.63 3 2.26 (0.14) 0.86
Test for trend 0.26 Test for trend 0.80
Table 3: Age and body mass index adjusted means (SEM) of bone mass (stiffness indexa and mBMDb) by osteophyte status at the knee, distal interphalangeal (DIP), proximal interphalangeal (PIP), carpometacarpal/metacarpophalangeal (CMC/MCP) joints.
Osteophyte status No. Stiffness indexa P value* No. mBMDb P value*
Knee
None 344 70.3 (0.6) 351 2.24 (0.01)
Questionable 86 71.4 (1.1) 0.36 87 2.24 (0.03) 0.93 Definite 127 68.8 (0.9) 0.19 129 2.22 (0.02) 0.41 DIP
None 158 70.0 (0.8) 161 2.23 (0.02)
Questionable 257 70.4 (0.6) 0.70 261 2.22 (0.02) 0.73 Definite 141 69.6 (0.8) 0.80 144 2.26 (0.02) 0.30 PIP
None 400 70.2 (0.5) 410 2.23 (0.01)
Questionable 148 69.9 (0.8) 0.80 148 2.25 (0.02) 0.38 Definite 9 68.8 (3.4) 0.68 9 2.15 (0.08) 0.33 CMC/MCP
None 437 70.1 (0.5) 446 2.23 (0.01)
Questionable 81 68.2 (1.1) 0.10 81 2.19 (0.03) 0.11 Definite 39 73.7 (1.6) 0.04 40 2.32 (0.04) 0.04
a: Stiffness index values were missing for 10 women. b: metacarpal bone mineral density. * P value versus women with no osteophytes.
Table 4: Age and body mass index adjusted means (SEM) of bone mass (stiffness indexa and mBMDb) by joint space narrowing status at the knee, distal interphalangeal (DIP), proximal interphalangeal (PIP), carpometacarpal/metacarpophalangeal (CMC/MCP) joints.
Joint space nar-rowing status
No. Stiffness indexa P value* No. mBMDb P value*
Knee
None 374 70.6 (0.5) 381 2.24 (0.01)
Questionable 85 67.8 (1.1) 0.02 87 2.17 (0.03) 0.02 Definite 98 70.3 (1.1) 0.84 99 2.27 (0.03) 0.31 DIP
None 214 70.6 (0.7) 219 2.24 (0.02)
Questionable 214 69.1 (0.7) 0.14 217 2.22 (0.02) 0.37 Definite 126 70.8 (0.9) 0.90 128 2.25 (0.03) 0.71 PIP
None 442 70.1 (0.5) 450 2.23 (0.01)
Questionable 107 70.3 (1.0) 0.89 109 2.23 (0.02) 0.99 Definite 8 67.1 (3.6) 0.40 8 2.19 (0.09) 0.66 CMC/MCP
None 480 69.8 (0.4) 488 2.23 (0.01)
Questionable 36 70.4 (1.7) 0.74 37 2.18 (0.04) 0.21 Definite 41 73.4 (1.6) 0.03 42 2.26 (0.04) 0.49
[image:5.612.55.553.404.623.2]OA, adjusting for age and BMI, but there was no signifi-cant difference at any joint in all women (Table 8), and in ages 60 and older (Table 9).
Discussion
We did not detect a consistent association of peripheral bone mass with radiographic features of OA in the knee, DIP and PIP joints. However, we found that OA at the CMC/MCP was associated with higher bone mass: stiff-ness index was significantly higher in women with grade 3, definite osteophyte or definite joint space narrowing, compared with those with no OA, no osteophyte or no joint space narrowing, respectively, and mBMD was high-er in women with definite osteophytes, compared with those with no osteophytes. Since it is well known that age and obesity are related both to OA and bone mass, and are potential confounders [15–18], our analyses were adjust-ed for age and BMI.
[image:6.612.54.554.117.452.2]Several studies reported that radiographic knee OA was as-sociated with increased femoral neck or spine BMD inde-pendently of age and BMI [5,9,23], whereas knee OA was not associated with radius or metacarpal BMD [23,28]. Furthermore, several studies reported that radiographic hand OA was associated with increased lumbar spine or total body BMD [5,10,12], but not with radius or metacar-pal BMD [29,30]. It has been reported that in cases with generalized OA, the width of the radius and the metacar-pal is significantly larger than in controls, and bone width can influence bone mass results expressed as BMD or % cortical area [22]. In the current study, metacarpal width in women with OA (grade 1–4) at CMC/MCP joint was greater than that in women without OA (grade 0) at the CMC/MCP joint, but this difference was not significant (p = 0.28). These findings may in part explain why we did not find an association of mBMD with OA grade and joint space narrowing status at the CMC/MCP joint despite finding an association of stiffness index with these meas-ures of OA.
Table 5: Age and body mass index adjusted means (SEM) of bone mass (stiffness indexa and mBMDb) by osteoarthritis (OA) grade at the knee, distal interphalangeal (DIP), proximal interphalangeal (PIP), carpometacarpal/metacarpophalangeal (CMC/MCP) joints, ages 60 years over.
OA grades No. Stiffness indexa P value* No. mBMDb P value*
Knee
0 151 65.8 (0.8) 154 2.14 (0.02)
1 82 65.8 (1.1) 0.99 83 2.06 (0.03) 0.03
2 88 66.7 (1.0) 0.50 89 2.11 (0.03) 0.48
3 65 66.3 (1.3) 0.75 66 2.14 (0.03) 0.90
4 13 59.5 (2.8) 0.03 13 2.03 (0.07) 0.16
Test for trend 0.71 Test for trend 0.89 DIP
0 50 65.8 (1.4) 51 2.11 (0.04)
1 61 64.9 (1.3) 0.61 61 2.07 (0.03) 0.37
2 174 66.0 (0.7) 0.93 178 2.13 (0.02) 0.68
3 52 65.6 (1.4) 0.90 52 2.09 (0.03) 0.69
4 62 67.0 (1.2) 0.54 63 2.14 (0.03) 0.48
Test for trend 0.43 Test for trend 0.29 PIP
0 227 66.0 (0.7) 231 2.11 (0.02)
1 85 65.8 (1.1) 0.90 86 2.15 (0.03) 0.17
2 79 66.2 (1.1) 0.89 80 2.10 (0.03) 0.73
3 5 58.9 (4.4) 0.11 5 2.14 (0.11) 0.75
4 3 68.2 (5.6) 0.70 3 1.95 (0.14) 0.28
Test for trend 0.80 Test for trend 0.73 CMC/MCP
0 278 65.9 (0.6) 282 2.12 (0.01)
1 40 62.5 (1.5) 0.04 41 2.04 (0.04) 0.06
2 49 66.3 (1.4) 0.79 49 2.13 (0.04) 0.86
3 29 70.0 (1.8) 0.03 30 2.16 (0.05) 0.40
4 3 68.5 (5.6) 0.63 3 2.16 (0.14) 0.79
Test for trend 0.16 Test for trend 0.64
In our study, the associations with OA were inconsistent, suggesting they may simply be due to chance. The cross-sectional nature of our study and the use of peripheral bone mass measurements may have affected our ability to detect an association with OA. A recent review [31]
[image:7.612.55.554.119.330.2]report-ed that higher BMD as measurreport-ed by DXA at the spine and hip was associated with OA at hip, spine or knee, but weaker associations were observed with hand OA. Meas-uring BMD at skeletal sites distant from the site evaluated for OA might provide a general indication of skeletal bone
Table 6: Age and body mass index adjusted means (SEM) of bone mass (stiffness indexa and mBMDb) by osteophyte status at the knee, distal interphalangeal (DIP), proximal interphalangeal (PIP), carpometacarpal/metacarpophalangeal (CMC/MCP) joints, ages 60 years over.
Osteophyte status No. Stiffness indexa P value* No. mBMDb P value*
Knee
None 216 65.5 (0.7) 219 2.12 (0.02)
Questionable 74 67.7 (1.1) 0.10 75 2.12 (0.03) 0.89 Definite 109 65.4 (1.0) 0.95 111 2.11 (0.02) 0.77 DIP
None 78 64.2 (1.1) 79 2.07 (0.03)
Questionable 192 66.8 (0.7) 0.06 195 2.11 (0.02) 0.26 Definite 129 65.6 (0.9) 0.32 131 2.14 (0.02) 0.05 PIP
None 257 65.8 (0.6) 263 2.11 (0.02)
Questionable 133 66.2 (0.8) 0.76 133 2.14 (0.02) 0.29 Definite 9 64.5 (3.2) 0.68 9 2.02 (0.08) 0.32 CMC/MCP
None 291 65.9 (0.6) 296 2.12 (0.01)
Questionable 71 64.2 (1.1) 0.18 71 2.06 (0.03) 0.10 Definite 37 69.6 (1.6) 0.03 38 2.20 (0.04) 0.06
a: Stiffness index values were missing for 6 women. b: metacarpal bone mineral density. * P value versus women with no osteophytes.
Table 7: Age and body mass index adjusted means (SEM) of bone mass (stiffness indexa and mBMDb) by joint space narrowing status at the knee, distal interphalangeal (DIP), proximal interphalangeal (PIP), carpometacarpal/metacarpophalangeal (CMC/MCP) joints, ages 60 years over.
Joint space narrowing status No. Stiffness indexa P value* No. mBMDb P value*
Knee
None 243 66.3 (0.6) 247 2.13 (0.02)
Questionable 65 63.9 (1.2) 0.08 66 2.04 (0.03) 0.01 Definite 91 66.3 (1.1) 0.97 92 2.14 (0.03) 0.73 DIP
None 113 65.9 (0.9) 115 2.11 (0.02)
Questionable 166 65.3 (0.8) 0.62 169 2.11 (0.02) 0.86 Definite 117 66.5 (0.9) 0.65 118 2.12 (0.02) 0.83 PIP
None 303 65.8 (0.6) 307 2.12 (0.01)
Questionable 88 66.7 (1.0) 0.43 90 2.12 (0.03) 0.99 Definite 8 62.4 (3.4) 0.34 8 2.07 (0.09) 0.63 CMC/MCP
None 330 65.5 (0.5) 334 2.11 (0.01)
Questionable 32 65.6 (1.8) 0.98 33 2.07 (0.04) 0.37 Definite 37 69.5 (1.6) 0.02 38 2.15 (0.04) 0.41
[image:7.612.55.554.412.624.2]mass, whereas measurements closer to the sites evaluated for OA might provide an indication of local bone effects. If local bone factors are more important, this might partly explain why heel BMD was not consistently associated with OA at other sites. On the other hand, being a weight-bearing site, one would expect that heel bone mass would reflect the physical loads borne by the knees, but not nec-essarily loading of bones in the hand. If so, heel bone mass might be more strongly associated with knee OA than hand OA, but this was not seen. Likewise, hand BMD was not strongly associated with hand OA in our study. The composition of measured bone might also play a role. The heel and spine have high proportions of trabecular bone than other sites such as the hip and metacarpal. However, there is no convincing evidence that the associ-ations with OA might be stronger (or weaker) for BMD measurements at sites with high proportions of trabecular bone.
Several environmental or cultural (lifestyle) characteris-tics may contribute to site-specific OA occurrence [18]. Knee bending and squatting were strongly associated with OA of the knee [32,33]. However, these were retrospective case control studies, and as such provide weaker evidence of a causal relationship than prospective studies. Life-long knee bending and squatting behaviors, a component of the traditional Japanese lifestyle, may have had a long-term effect on occurrence of knee OA. Since Japanese eld-erly spent most of their lives using tatami mats and East-ern-style toilets (all of which are within inches of ground level and require squatting), these daily activities of the traditional Japanese lifestyle may have contributed to the development of knee OA even among those with low
bone mass (osteoporosis). Prospective studies are re-quired to confirm a causal association between knee bending and knee OA. Furthermore, Half of the women we studied were engaged in farming, and these women may have a high risk of joint injury and of repetitive hand use, which may be risk factors for OA [34,35]. There was no association of higher bone mass with OA at the knee, DIP and PIP joints in the current study. This suggests that environmental factors may have contributed more to the occurrence of OA at knee, DIP and PIP joints in our Japa-nese sample, and this might have masked an association between bone mass and OA.
Heel bone stiffness index was lower in women with grade 4 at the knee than those with no OA in the current study. Although the explanation is unclear, one possibility is that women with severe knee OA may have less physical (walk-ing) activity, which could lead to lower bone mass than women of comparable age.
[image:8.612.52.559.120.288.2]The measurements of bone mass at 2 appendicular sites (calcaneus and metacarpal) may offer insights regarding possible differences in associations of cancellous and cor-tical bone with OA [36]. The calcaneus is of primarily can-cellous bone, and the metacarpal of primarily cortical bone. Furthermore, the calcaneus is weight-bearing, and may reflect to some degree the usual level of physical ac-tivity, whereas the metacarpal is not a weight-bearing bone. Previous studies tended to find associations be-tween OA (at the hip, knee and hand) and BMD measured at weight-bearing sites [5,9,10,12,23], but not when BMD was measured at the hand [23,28–30]. However, there
Table 8: Age and body mass index adjusted means (SEM) of bone mass (stiffness indexa and mBMDb) by osteoarthritis (OA) grade at the knee, distal interphalangeal (DIP), proximal interphalangeal (PIP), carpometacarpal/metacarpophalangeal (CMC/MCP) joints. (n = 567)
OA grades No. Stiffness indexa P value* No. mBMDb P value*
Knee
0 70.6 (0.6) 2.25 (0.02)
1–4 69.6 (0.6) 0.28 2.22 (0.01) 0.15
DIP
0 71.3 (1.0) 2.26 (0.02)
1–4 69.8 (0.5) 0.18 2.23 (0.01) 0.29
PIP
0 70.5 (0.5) 2.23 (0.01)
1–4 69.4 (0.7) 0.26 2.24 (0.02) 0.46
CMC/MCP
0 70.1 (0.5) 2.24 (0.01)
1–4 70.0 (0.9) 0.92 2.22 (0.02) 0.52
was no apparent relationship between the type of bone measured and the presence of OA in the present study.
Our study has several limitations. Although we attempted to obtain a representative sample of the population, the subjects had to be mobile enough to attend the examina-tion center. Women with the most severe symptoms and disability (especially in the oldest age groups) may have chosen not to participate. The response rate in the Hizen-Oshima Study was approximately 30% of eligible women, so there is a possibility of selection bias. Our mail survey did not yield a high response rate but there was only one mailing to the general community and no attempted fol-low-up. The subjects in this analysis were all Japanese women; thus, our results may not be generalizable to men, or men and women of different racial groups. These analyses are cross-sectional by design, and causality can-not be inferred from the differences in adjusted bone mass between women with and without knee or hand OA. For example, women with higher bone mass at an earlier point in life may be more likely to develop OA, but subse-quent declines in physical activity due to OA symptoms could contribute to accelerated bone loss which would confound the cross-sectional analyses reported here. Con-sidering the exploratory nature of these analyses, and the use of multiple endpoints and predictors, it may be appro-priate to adjust the p-values for multiple comparisons. Taking the dozens of comparisons into account, none of the associations would be considered statistically signifi-cant.
Conclusions
Our results showed that age and BMI adjusted appendicu-lar bone mass is increased with radiographic changes of OA at CMC/MCP joint, especially with osteophyte status, among Japanese women. Our findings also failed to detect an association of bone mass with OA for knee, DIP or PIP joint in Japanese women, in contrast to other popula-tions. Factors associated with OA may differ by site of joint involvement [18]. However, the cross-sectional na-ture of our study makes it difficult to make etiologic infer-ences, and prospective studies are needed to investigate this issue further.
Competing interests
Philip D. Ross is an employee of and holds stock options in Merck & Co., Inc.
Authors' contributions
YY participated in the study design, data analysis and drafting the manuscript. KA participated in the study de-sign, standardization of data collection, data analysis and preparation of the manuscript. SY participated in the study design and reading the X-ray films. PDR participated in the study design, standardization of data collection, data analysis and writing of the manuscript. IY participat-ed in the study design and critical review of the manu-script. KM participated in critical review of the manuscript. TT participated in critical review of the man-uscript.
[image:9.612.53.557.120.288.2]All authors read and approved the final manuscript.
Table 9: Age and body mass index adjusted means (SEM) of bone mass (stiffness indexa and mBMDb) by osteoarthritis (OA) grade at the knee, distal interphalangeal (DIP), proximal interphalangeal (PIP), carpometacarpal/metacarpophalangeal (CMC/MCP) joints, ages 60 years over. (n = 405)
OA grades No. Stiffness indexa P value* No. mBMDb P value*
Knee
0 65.8 (0.8) 2.14 (0.02)
1–4 66.0 (0.6) 0.82 2.10 (0.02) 0.13
DIP
0 65.9 (1.4) 2.11 (0.04)
1–4 65.9 (0.5) 0.97 2.22 (0.01) 0.93
PIP
0 66.0 (0.6) 2.11 (0.02)
1–4 65.8 (0.7) 0.87 2.12 (0.02) 0.55
CMC/MCP
0 65.9 (0.6) 2.12 (0.01)
1–4 65.9 (0.9) 0.98 2.11 (0.02) 0.63
Acknowledgments
The authors thank Dr. David T. Felson, Multipurpose Arthritis Center and Department of Medicine, Boston University, for commenting on drafts of the manuscript. This study was supported in part by the Japan Society for the Promotion of Science.
References
1. Lawrence RC, Helmick CG, Arnett FC, Deyo RA, Felson DT, Giannini EH, Heyse SP, Hirsch R, Hochberg MC, Hunder GG, et al: Estimates of the prevalence of arthritis and selected musculoskeletal disorders in the United States.Arthritis Rheum 1998, 41:778-799 2. Cummings SR, Kelsey JL, Nevitt MC, O'Dowd KJ: Epidemiology of osteoporosis and osteoporotic fractures.Epidemiol Rev 1985, 7:178-208
3. Foss MV, Byers PD: Bone density, osteoarthrosis of the hip, and fracture of the upper end of the femur.Ann Rheum Dis 1972, 31:259-264
4. Dequeker J, Goris P, Uytterhoeven R: Osteoporosis and osteoar-thritis (osteoarthrosis). Anthropometric distinctions. JAMA 1983, 249:1448-1451
5. Hart DJ, Mootoosamy I, Doyle DV, Spector TD: The relationship between osteoarthritis and osteoporosis in the general pop-ulation: the Chingford Study.Ann Rheum Dis 1994, 53:158-162 6. Gevers G, Dequeker J, Martens M, Van Audekercke R, Nyssen-Behets
C, Dhem A: Biomechanical characteristics of iliac crest bone in elderly women according to osteoarthritis grade at the hand joints.J Rheumatol 1989, 16:660-663
7. Sowers M, Zobel D, Weissfeld L, Hawthorne VM, Carman W: Pro-gression of osteoarthritis of the hand and metacarpal bone loss. A twenty-year followup of incident cases.Arthritis Rheum 1991, 34:36-42
8. Hordon LD, Stewart SP, Troughton PR, Wright V, Horsman A, Smith MA: Primary generalized osteoarthritis and bone mass.Br J Rheumatol 1993, 32:1059-1061
9. Belmonte-Serrano MA, Bloch DA, Lane NE, Michel BE, Fries JF: The relationship between spinal and peripheral osteoarthritis and bone density measurements.J Rheumatol 1993, 20: 1005-1013
10. Marcelli C, Favier F, Kotzki PO, Ferrazzi V, Picot MC, Simon L: The relationship between osteoarthritis of the hands, bone min-eral density, and osteoporotic fractures in elderly women. Osteoporos Int 1995, 5:382-388
11. Nevitt MC, Lane NE, Scott JC, Hochberg MC, Pressman AR, Genant HK, Cummings SR: Radiographic osteoarthritis of the hip and bone mineral density. The Study of Osteoporotic Fractures Research Group.Arthritis Rheum 1995, 38:907-916
12. Sowers MF, Hochberg M, Crabbe JP, Muhich A, Crutchfield M, Updike S: Association of bone mineral density and sex hormone lev-els with osteoarthritis of the hand and knee in premenopau-sal women.Am J Epidemiol 1996, 143:38-47
13. Radin EL: Mechanical aspects of osteoarthrosis.Bull Rheum Dis 1976, 26:862-865
14. Radin EL, Rose RM: Role of subchondral bone in the initiation and progression of cartilage damage.Clin Orthop 1986, 213: 34-40
15. Bauer DC, Browner WS, Cauley JA, Orwoll ES, Scott JC, Black DM, Tao JL, Cummings SR: Factors associated with appendicular bone mass in older women. The Study of Osteoporotic Frac-tures Research Group.Ann Intern Med 1993, 118:657-665 16. Ross PD: Osteoporosis. Frequency, consequences, and risk
factors.Arch Intern Med 1996, 156:1399-1411
17. Felson DT: Epidemiology of hip and knee osteoarthritis. Epide-miol Rev 1988, 10:1-28
18. Silman AJ, Hochberg MC: Osteoarthritis.In: Epidemiology of the rheumatic diseases (Edited by: Silman AJ, Hochberg MC) Oxford, Oxford University Press 1993, 257-288
19. Hordon LD, Wright V, Smith MA: Bone mass in osteoarthritis. Ann Rheum Dis 1992, 51:823-825
20. Knight SM, Ring EF, Bhalla AK: Bone mineral density and oste-oarthritis.Ann Rheum Dis 1992, 51:1025-1026
21. Lane NE, Nevitt MC: Osteoarthritis and bone mass.J Rheumatol 1994, 21:1393-1396
22. Dequeker J, Boonen S, Aerssens J, Westhovens R: Inverse relation-ship osteoarthritis-osteoporosis: what is the evidence? What are the consequences?Br J Rheumatol 1996, 35:813-818
23. Hannan MT, Anderson JJ, Zhang Y, Levy D, Felson DT: Bone miner-al density and knee osteoarthritis in elderly men and women. The Framingham Study.Arthritis Rheum 1993, 36:1671-1680 24. Naitou K, Kushida K, Takahashi M, Ohishi T, Inoue T: Bone mineral
density and bone turnover in patients with knee osteoarthri-tis compared with generalized osteoarthriosteoarthri-tis.Calcif Tissue Int 2000, 66:325-329
25. Yoshida S, Aoyagi K, Felson DT, Aliabadi P, Shindo H, Takemoto T: Comparison of the prevalence of radiographic osteoarthritis of the knee and hand between Japan and the United States. J Rheumatol 2002, 29:1454-1458
26. Kellgren JH, Lawrence JS: Atlas of standard radiographs. The ep-idemiology of chronic rheumatism. Oxford, Blackwell Scientific Publications 1963
27. Goker B, Sumner DR, Hurwitz DE, Block JA: Bone mineral density varies as a function of the rate of joint space narrowing in the hip.J Rheumatol 2000, 27:735-738
28. Hochberg MC, Lethbridge-Cejku M, Scott WW, Reichle R, Plato CC, Tobin JD: Upper extremity bone mass and osteoarthritis of the knees: data from the Baltimore Longitudinal Study of Aging.J Bone Miner Res 1995, 10:432-438
29. Hochberg MC, Lethbridge-Cejku M, Scott WW, Plato CC, Tobin JD: Appendicular bone mass and osteoarthritis of the hands in women: data from the Baltimore Longitudinal Study of Ag-ing.J Rheumatol 1994, 21:1532-1536
30. Reid DM, Kennedy NS, Smith MA, Tothill P, Nuki G: Bone mass in nodal primary generalised osteoarthrosis.Ann Rheum Dis 1984, 43:240-242
31. Stewart A, Black AJ: Bone mineral density in osteoarthritis.Curr Opin Rheumatol 2000, 12:464-467
32. Kivimaki J, Riihimaki H, Hanninen K: Knee disorders in carpet and floor layers and painters. Scand J Work Environ Health 1992, 18:310-316
33. Cooper C, McAlindon T, Coggon D, Egger P, Dieppe P: Occupa-tional activity and osteoarthritis of the knee.Ann Rheum Dis 1994, 53:90-93
34. Hadler NM, Gillings DB, Imbus HR, Levitin PM, Makuc D, Utsinger PD, Yount WJ, Slusser D, Moskovitz N: Hand structure and func-tion in an industrial setting.Arthritis Rheum 1978, 21:210-220 35. Partridge RE, Duthie JJ: Rheumatism in dockers and civil
serv-ants. A comparison of heavy manual and sedentary workers. Ann Rheum Dis 1968, 27:559-568
36. Dequeker J, Geusens P: Osteoporosis and arthritis.Ann Rheum Dis 1990, 49:276-280
Pre-publication history
The pre-publication history for this paper can be accessed here:
http://www.biomedcentral.com/1471-2474/3/24/prepub
Publish with BioMed Central and every scientist can read your work free of charge
"BioMedcentral will be the most significant development for disseminating the results of biomedical research in our lifetime."
Paul Nurse, Director-General, Imperial Cancer Research Fund
Publish with BMC and your research papers will be:
available free of charge to the entire biomedical community
peer reviewed and published immediately upon acceptance
cited in PubMed and archived on PubMed Central
yours - you keep the copyright
editorial@biomedcentral.com Submit your manuscript here:
http://www.biomedcentral.com/manuscript/