IBM Center for The Business of Government
2019
Integrating Big Data and
Thick Data to Transform
Public Services Delivery
Yuen Yuen Ang
2019
Yuen Yuen Ang
Associate Professor of Political Science at the University of Michigan
3
IntegratIng BIg Data anD thIck Data to transform PuBlIc servIces DelIvery
www.businessofgovernment.org
TABLE OF CONTENTS
Foreword . . . . 4
Executive Summary . . . . 6
Introduction . . . . 7
Part 1: Analytical Perspectives on Big Data and Thick Data . . . . 9
Part 2: Three Case Studies . . . . 15
Part 3: Lessons Learned and Recommendations . . . . 37
About the Author . . . . 44
Key Contact Information . . . . 45
Organizations and researchers across the private and public sectors have learned much from advances in the use of analytics to assess a vast and growing volume of information . “Big data” enables understanding of patterns and anomalies with far greater speed and accuracy, and has been used to help government make more informed decisions in areas ranging from social service delivery to global threats . Yet while big data has been the source of significant advances, its very nature does not capture deep context about the people and places who benefit from actions taken based on analysis of big data .
In this report, Professor Ang offers a new framework to enhance government’s ability to leverage big data for social and economic good by integrating the concept of thick data—defined as “rich qualitative information about users, such as their values, goals, and consumption behavior, obtained by observing or interacting with them in their daily lives .” The author reviews the differing strengths and limits of big and thick data, and suggests that governments can improve results by combining the breadth of big data with the depth of thick data—an integrative approach that she calls “mixed analytics,” which can increase accuracy in interpreting big data by adding contextual knowledge about citizen concerns .
The report uses three case studies to illustrate how mixed analytics can help improve decision-making that affects the daily lives of citizens across the public sector, at the local, national, and international levels . Professor Ang concludes with a set of lessons learned and recommendations for government leaders, which range from making data and technology relevant to users, and applying big and thick data at different stages of the problem-solving process, to building interdisciplinary teams that include both quantitative and qualitative experts and that engage stakeholders in collecting and analyzing data .
DANIEL J . CHENOK
FOREWORD
On behalf of the IBM Center for The Business of Government, we are pleased
to present this new report, Integrating Big Data and Thick Data to Transform
Public Service Delivery, by Yuen Yuen Ang, Associate Professor of Political
Science at the University of Michigan.
5
IntegratIng BIg Data anD thIck Data to transform PuBlIc servIces DelIvery
www.businessofgovernment.org
This report builds on multiple past IBM Center reports about how government can leverage data and analytics to improve decisions, including Data-Driven Government: The Role of Chief Data Officers, by Jane Wiseman; Ten Actions to Implement Big Data Initiatives: A Study of 65 Cities, by Alfred Ho and Bo McCall, and Realizing The Promise of Big Data, by Kevin DeSouza . The report also complements several chapters that assess the past and potential use of data across the public sector in our recent book, Government For The Future: Reflection and Vision For Tomorrow’s Leaders .
At a time when the US and other governments continue to enhance their use of data as a strategic asset for transformation, we hope that Professor Ang’s report provides useful insights for government managers and stakeholders .
Daniel J . Chenok Executive Director IBM Center for
The Business of Government chenokd@us .ibm .com
Leanne Haselden
Partner and Practice Area Leader Advanced Analytics,
EXECUTIVE SUMMARY
Governments can greatly enhance the value of big data by
combin-ing it with “thick” data—rich qualitative information about users,
such as their values, goals, and consumption behavior, obtained by
observing or interacting with them in their daily lives.
Big data holds great promise for improving public services delivery and innovation in govern-ment, but they are not a panacea . Having lots of data can be overwhelming or have little utility if the data are “thin”—that is, they lack meaning for users or fail to capture issues that matter most . By yielding insights into what citizens really care about and how they consume services, thick data can inform both the collection and analysis of big data .
This report introduces the concept of “mixed analytics,” integrating big data and thick data to transform government decision making, public services delivery, and communication . The report presents three case studies of organizations that employ mixed analytics at the interna-tional, federal, and city level, respectively . Together, this research offers a set of transferable lessons for agencies at all levels of government:
• Lesson 1: Big data is a means to an end, rather than an end .
• Lesson 2: Thick data can identify unexpected problems or previously unexpressed needs . • Lesson 3: Thick data can inform the analysis of big data .
• Lesson 4: Mixed analytics can offer both scale and depth .
• Lesson 5: Applying technology is a social activity, not an isolated technical task . • Lesson 6: The best solutions are not always high-tech .
The report concludes with five actionable recommendations for public managers . 1 . Make data and technology relevant to the people who use it .
2 . Leverage thick data at appropriate stages of the problem-solving process .
3 . Build an interdisciplinary team of quantitative and qualitative experts who work closely with stakeholders .
4 . Combine big and thick data to improve communication .
7
IntegratIng BIg Data anD thIck Data to transform PuBlIc servIces DelIvery
www.businessofgovernment.org
Corporations have harnessed big data and analytics to improve business operations and mar-keting . The public sector, meanwhile, is slowly—but steadily—catching up . Earlier reports from the IBM Center for The Business of Government highlight the promise of big data in helping public organizations “streamline business processes, increase citizen engagement, innovate, and embrace evidence-driven decision-making .” 1 They show that across the United States, a growing number of cities collect and use big data to inform policies and program management .2
But governments should not be swept away by the promise of big data as a panacea . Data can be overwhelming or have limited utility if the data are “thin”—that is, they lack meaning for citi-zens, businesses, or other users . Focusing only on big data may distract agencies from noticing what really matters to people . As one New York Times op-ed puts it:3
If you’re trying to build a self-driving car or detect whether a picture has a cat in it, big data is amazing . But here’s a secret: if you’re trying to make important decisions about your health, wealth or happiness, big data is not enough . The problem is this: the things we can measure are never exactly what we care about .
When it comes to delivering public services, governments can miss obvious problems if they rely only on big data and analytics . For example, consider the “smart parking” programs adopted by the cities of New Orleans, Palo Alto, and San Francisco . Using big data on parking availability, algorithms automatically adjusted parking prices according to supply and
demand—prices rose with high demand and fell with low demand .
But drivers did not take full advantage of dynamic pricing . To explore why not, a team of eth-nographers spent several weeks in each city observing parking behavior and trying out the parking process themselves . Their research revealed a problem that smart technology had missed: confusing parking signs meant that drivers did not want to park at certain spots, even with lower prices .4 The easy solution to this unexpected problem was designing clearer parking signs .
Technologists often operate on certain assumptions about user preferences and behavior, but these assumptions may turn out to be biased or rooted in misunderstandings . As the above
1. Kevin Desouza, “Realizing the Promise of Big Data: Implementing Big Data Projects,” IBM Research Report, 2014, pp. 10. 2. Alfred Tat-Kei Ho & McCall Bo, “Ten actions to implement big data initiatives: A study of 65 cities,” IBM Research Report, 2016. 3. “How Not to Drown in Numbers,” New York Times, May 2, 2015.
4. Glasnapp, J. & Isaacs, E. (2011). “No More Circling Around the Block: Evolving a Rapid Ethnographic and Podcasting Method to Guide Innovation in Parking Systems,” Proceedings of Ethnographic Praxis in Industry Conference (EPIC) ‘11, Boulder, CO.
INTRODUCTION
example illustrates, the dynamic pricing design assumed that drivers care most about parking costs; in fact, they may be more concerned about quickly finding secure and convenient spots to park .
Although big data enables computational analyses and predictive analytics that exponentially exceed human cognition, they do not diminish or negate the role of human observation and immersion in social settings . In order to leverage big data to improve government services, policymakers can combine it with thick data . Drawing on anthropology and ethnography,— thick data refers to rich qualitative information about users, such as their values, goals, and consumption behavior, obtained by observing or interacting with them in their daily lives .
Whereas big data are broad and thin, thick data are narrow and rich—blending them therefore yields a more holistic picture of the problem at hand . Indeed, major technology companies have used mixed data for decades, a fact often missed in forums about big data . For example, in addition to generating big numerical data on likes, clicks, and shares, social media compa-nies also collect thick data on why users perform certain activities and the meaning of those activities, through interviews and surveys conducted by an ethnographic research team .5
Previous IBM Center reports have featured big data initiatives in government . This report focuses on how public organizations can combine big data and thick data to transform public services delivery, including services that address citizen needs such as transportation, health care, and law enforcement—a strategy this report calls mixed analytics. Although “analytics” often connotes the use of numerical data for decision making, governments should adopt a broader understanding of data that includes non-measurable insights .
To illustrate how mixed analytics operate in practice, this report analyzes and draws lessons from three case studies at the international, federal, and city levels, respectively .
• The World Bank Social Observatory’s p-tracking (participatory tracking) project among 32,000 village residents in India .
• The APHIS (Animal and Plant Health Inspection Service, a division of the United States Department of Agriculture) tailored social marketing campaign .
• The LA Express Park program, featuring dynamic pricing, in downtown Los Angeles .
These case studies show that mixed analytics can help public institutions increase citizen engagement, tailor messages to differentiated audiences, and ensure that services truly reach and benefit citizens . Organizations may sometimes have big data on things that do not really matter and yet lack data on issues that matter most . Hence, to be relevant, governments must acquire not only data literacy but also contextual literacy—deep understanding of a particular context—by talking to stakeholders, observing people, and immersing in local communities .
The report contains three main sections:
1) An analysis of the uses and limitations of big data, and how integrating it with thick data can generate holistic insights and better results for public managers .
2) Presentation of the three case studies that illustrate the power of integrating big data with thick data .
3) Lessons learned and recommendations for government action .
Part 1
Analytical Perspectives
on Big Data and
The Uses and Limitations of Big Data
Big data can be described as “massive data sets sifted by powerful analytical tools .”6
Emerging in the 2000s, the concept of “big data” took off with growing digital records of indi-vidual and organizational activities, enabled by the proliferation of data collection devices, such as digital cameras, smartphones, and scanners .7 Social media generates unprecedentedly large databases of text and online interactive behavior, while the expansion of broadband and wireless networks accelerates real-time transmission of data . All of these infrastructure advances and new modes of communication have made big data possible .
Big data is defined not only by volume (the amount of data collected and analyzed), but also by velocity and variety . Velocity refers to the speed of data being produced, for example, streaming data is now widely available for real-time, instant analysis . Variety refers to the dif-ferent forms of data collected, which can be structured or unstructured, and the number of dimensions captured by the data . As Helm underscores, “Big data is more about the complex-ity of data, rather than the size of the data alone .”8
Big data can also be divided into two categories: “tall data” and “fat data .” Tall data feature “a large number of observations relative to the number of predictors .”9 The data used for APHIS’s social marketing campaign, one of the case studies featured in this report, illustrates the use of tall data: the dataset has hundreds of thousands of observations (records of viola-tions) but relatively few predictors (variables that can potentially explain the violaviola-tions) . Usually, when people think about big data, they really mean tall data . A different kind of big data is fat data, which has “lots of variables but few cases .”10
In recent years, big data has garnered the attention of government leaders and managers . In 2012, the Obama administration announced the Big Data Research & Development Initiative, allotting $200 million to launch new big data projects . Such efforts have been supplemented by certain agencies who must provide large data sets to the public at no cost, such as the National Oceanic and Atmospheric Administration at the Department of Commerce .
Federal, state, and local governments have all begun to use big data in a variety of ways . A federal example is the United States Postal Service (USPS) . USPS processes more than 6,100 mailings each second . By feeding a massive database of 400 billion records to an algorithm, USPS can detect fraud and suspicious mailings .11 Locally, big data can be used for predictive policing . Applying software to crime statistics can generate predictions of where crime is likely to occur, enabling the police to act preemptively .12
But while success stories of big data applications abound, reports about their limitations are less common . In fact, even in the private sector, failures occur . One problem involves collect-ing a massive amount of useless information . Eager to jump onto the big data bandwagon, one medical company collected as much data as possible without first setting priorities and planning quality checks, resulting in a 200-page data analytics report that lacked the neces-sary insights .13
6. “The Power of Thick Data,” Wall Street Journal, March 21, 2014. 7. Ho & McCall 2016, pp. 6.
8. John Helms, “Big data: it’s about complexity, not size,” IBM Business of Government Blog, Jan. 22, 2015.
9. Brian Griepentrog, Sean Marsh, Sidney Carl Turner & Sarah Evans, “Using social marketing and data science to make government smarter,” in Computational Social Science: Discovery and Prediction, edited by Michael Alverez, New York: Cambridge University Press, 2016, pp. 262.
10. Ibid, pp. 247. 11. Desouza 2014
12. Jennifer Bachner, “Predictive Policing: Preventing Crime with Data and Analytics,” IBM Research Report, 2013.
11
IntegratIng BIg Data anD thIck Data to transform PuBlIc servIces DelIvery
www.businessofgovernment.org
As one industry executive has cautioned, “Just having massive amounts of data is not suffi-cient—in fact, without the proper analytic tools, it can lead to information overload .”14
Blindly relying on algorithms that draw from big data can lead to biased and poor decisions, particularly because most people, even top managers, do not question how algorithms work . One study finds that automated processing of job applications can systematically introduce bias against certain groups, even though “most companies do not intentionally engage in discrimi-natory hiring practices .” Relying on algorithms as a “quick fix,” the study cautions, steers com-panies away from tackling the root issues of workplace diversity .15
Most importantly, big data sets may not capture what consumers really want, particularly if core consumer preferences have not yet been noticed or expressed . Companies collect data according to what they believe customers want most, but these assumptions can be wrong .
Consider the case of a large supermarket chain that attempted to identify reasons for falling sales . The firm conducted customer surveys about pricing and competition, factors it assumed to be most relevant, but the survey produced contradictory results .16 Baffled, the firm tried a different method of investigation: sending ethnographers to observe consumers while shopping and in their homes . This study discovered that shoppers wanted something completely missing in the conventional survey: “Shopping experiences that were both convenient and distinctive— in other words, a mood .” Informed by this surprising insight, the supermarket redesigned its stores to enhance their “mood,” thereby gaining a powerful advantage over its competitors . This demonstrates the value of thick data in uncovering previously unexpressed needs .
What Is Thick Data?
If big data reflects volume, velocity, and variety for items that can be counted, thick data con-cerns information about the significance, meaning, and connections that humans assign to ser-vices or technologies, as well as the process by which they consume them . Thick data is generated through immersion in users’ natural settings, rather than in laboratory-type settings .
This concept of thick data draws from a well-established body of knowledge and research methodology in anthropology . According to the American Anthropological Association,
“Anthropology is the study of what makes us human . Anthropologists take a broad approach to understanding the many different aspects of the human experience . . .Anthropologists also try to understand how people interact in social relationships .”17 Put more simply, anthropology attempts to understand the human experience holistically, as opposed to only narrow, isolated aspects of daily living .
14. Helms 2015
15. Alex Rosenblat, Tamara Kneese, and danah boyd. “Networked Employment Discrimination.” Data & Society Working Paper, October 8, 2014.
16. “Big Data is Only Half the Data Marketers Need,” Harvard Business Review, November 16, 2015.
“Thick description” is a foundational concept in anthropology, first coined by Gilbert Ryle and later revived and popularized by Clifford Geertz, a leading anthropologist . Thick description, Geertz explains, interprets the “hierarchy of meaningful structures” that lies behind people’s words and actions .18 He illustrates this concept with the famous example of winks . A thin description of winks is a contraction of eyelids; a thick description, on the other hand, inter-prets what message the winker tries to convey, to whom, and why . Data, according to Geertz, “are really our own constructions of other people’s constructions of what they and their com-patriots are up to .”
Generating thick data requires the simple act of observation, a primary tool of ethnography —a branch of anthropology committed to the “exploration of a particular social or cultural set-ting on the basis of (though not exclusively by) participant observation .”19 Leading companies have applied ethnographic techniques to motivate and refine product design, creating a sub-field known as “design ethnography .” An official at IBM’s Almaden Research Center recalls that when computing technology took off in the 1980s, ethnography techniques were already employed to understand how people interacted with machines . Ethnographers helped engi-neers to bridge the gap “between how machines were designed to be used and how they were actually used .”20
Integrating Big Data and Thick Data
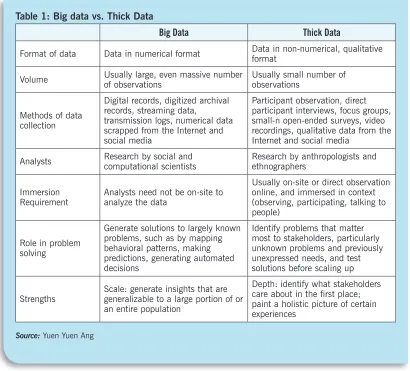
Table 1 compares the attributes and functions of big data and thick data . Each of their differ-ences shown in the table is discussed below .
• Format and volume of data. Whereas big data comprise numerical data, thick data usu-ally come in a variety of non-numerical formats, including observations, interviews, field notes, photographs, videos, transcripts of focus group discussions, and experiences from direct participation . The two data formats are not strictly separate, as qualitative data (such as words) can be coded and turned into numbers for quantitative analysis . Generally, a trade-off exists between the volume and depth of knowledge— for example, we either know a lot about a few people or a little about numerous people . Thick data usually focuses only on a small number of subjects, or what social scientists term “small-n” studies .
• Method of data collection. Computational and data scientists can analyze big data any-where, so long as they have the data sets and the right equipment . By contrast, ethnog-raphers usually collect thick data through deep immersion in the site of investigation . Typically, anthropologists spend years in a single location, though design ethnographers often shorten the immersion process to a few intensive weeks .
18. Geertz, Clifford. The Interpretation of Cultures. New York: Basic Books, 2000.
13
IntegratIng BIg Data anD thIck Data to transform PuBlIc servIces DelIvery
www.businessofgovernment.org
• Role in problem solving. Big data and thick data also differ in the problem-solving func-tions they serve . Generically stated, any process of problem solving may be disaggregated into four steps:21
1) Identify problems that matter to users or stakeholders . 2) Propose solutions to the problems .
3) Test and refine solutions on a small scale . 4) Implement solutions on a large scale .
Big data is extremely useful for generating solutions to problems that are already known or obvious, but unclear problems call for collecting thick data through qualitative research methods .22 For example, in the case of LA Express Park (see Case 3), if traffic congestion were indeed caused by rigid pricing, big data and algorithms could be used to automate dynamic pricing . Yet in fact, motorists were more concerned about convenience and not
21. See also Yuen Yuen Ang, “Going Local 2.0: How to Reform Development Agencies to Make Localized Aid More than Talk,” Stanford Social Innovation Review, October 8, 2018.
[image:13.612.70.480.71.442.2]22. Grant McCracken, an ethnographer who works for Netflix, describes his role as Chief Cultural Officer, that is, as the “corporation’s eyes and ears, allowing it to detect coming changes, even when they exist only as the weakest of signals.” (Cited in Tricia Wang. “Why Big Data Needs Thick Data.” Ethnography Matters. May 13, 2013. See also, Tricia Wang, “The Human Insights Missing from Big Data,” Ted Talk (video), Posted September 2016.)
Table 1: Big data vs. Thick Data
Big Data Thick Data
Format of data Data in numerical format Data in non-numerical, qualitative format
Volume Usually large, even massive number of observations Usually small number of observations
Methods of data collection
Digital records, digitized archival records, streaming data,
transmission logs, numerical data scrapped from the Internet and social media
Participant observation, direct participant interviews, focus groups, small-n open-ended surveys, video recordings, qualitative data from the Internet and social media
Analysts Research by social and computational scientists Research by anthropologists and ethnographers
Immersion
Requirement Analysts need not be on-site to analyze the data
Usually on-site or direct observation online, and immersed in context (observing, participating, talking to people)
Role in problem solving
Generate solutions to largely known problems, such as by mapping behavioral patterns, making predictions, generating automated decisions
Identify problems that matter most to stakeholders, particularly unknown problems and previously unexpressed needs, and test solutions before scaling up
Strengths Scale: generate insights that are generalizable to a large portion of or an entire population
Depth: identify what stakeholders care about in the first place; paint a holistic picture of certain experiences
getting towed (matching step one above—identify an unexpected problem that matters to users) than the expected problem of price (matching step two—propose the solution of clarifying parking signs) .23
Thick data are also particularly relevant for the third step of problem solving: testing and refining solutions on a small scale . As Ken Mihalyov, chief innovation officer for Xerox Transportation, cautions, “There’s very often a difference between what you expect to happen and what’s actually happening when people are involved .”24 Before introducing a technology or product at scale, ethnographers can examine users’ reaction and identify necessary adjustments . Making mid-course corrections is far less difficult and costly than correcting errors after a program fully launches . In the final fourth step—scaling up—big data and analytics can be usefully deployed to map behavioral patterns, generate predic-tions, and target communication .
• Strengths and limitations. Generally, big data and thick data have opposite strengths and weaknesses . In the words of Tricia Wang, a technology ethnographer, big data has the advantage of scale while thick data provides resolution: “For businesses to form a com-plete picture, they need both big and thick data because each of them produce different types of insights at varying scales and depths” .25 Big data can generate insights that apply to a large portion or even all of a population . Thick data, on the other hand, can identify what this population cares most about, and can help to generate a holistic picture of their experiences .
Any debate about the merits of big data versus thick data (or quantitative versus qualitative research) presents a false dichotomy . Both are necessary, and each serves unique purposes at different stages of the problem-solving process . This insight matters not only for researchers but also for practitioners . In particular, public managers can combine the two types of data . To draw lessons and recommendations, the next section analyzes three case studies .
23. James Glasnapp, Honglu Du, Christopher Dance, Stephane Clinchant, Alex Pudlin, Daniel Mitchell, and Onno Zoeter (Palo Alto Research Center [PARC]), “Understanding Dynamic Pricing for Parking in Los Angeles: Survey and Ethnographic Results,” HCIB/HCII 2014, LNCS 8527, pp. 316–327, 2014 , pp. 317.
24. Kerschberg, B. “How Xerox Uses Analytics, Big Data and Ethnography To Help Government Solve Big Problems.” Forbes. October 22, 2012.
Part 2
CASE A: A WORLD BANK SOCIAL OBSERVATORY
Don’t try to be smart and cool—try to be relevant.
—Vijayendra Rao, Lead Economist at World Bank and Team Leader of the Social Observatory
This report’s first case examines the World Bank’s Social Observatory (SO), a division of the World Bank Research Group, which has developed a unique mixed-methods approach to data collection, data sharing, and the design of development assistance programs . Their work cen-ters on improving existing “livelihood projects” in India that aim to reduce poverty and empower local communities . The SO operates through an international, multi-layered context of partnerships, involving World Bank researchers, state authorities in India at various levels, and grassroots communities . They seek primarily to help rural women, who face low income and low literacy in a male-dominant society .
Background and Motivations
Departing from mainstream practices at the World Bank and in international development gen-erally, the SO boasts several distinct goals and features:
1) “Embedded research,” which the SO team defines as an effort to “teach people how to do research within the communities .”26 Embedded research presents a groundbreaking step in bridging the long-standing gap between communities in developing countries and decision makers from organizations in developed countries .
2) A multi-method approach, combining surveys with large populations, case studies, and field-based decision making by local participants and stakeholders . This work is planned and implemented by an interdisciplinary team of economists, sociologists, behavioral sci-entists, and information system specialists—breaking with the Bank’s norm, where econ-omists have traditionally dominated .
3) Improving the “adaptive capacity” of the communities with whom they work, through the mechanisms of “see, learn, and adapt .” Rather than merely provide financial and technical assistance, the SO wants to help these communities become “nimble, learn by doing, and make mid-course corrections in implementation and design .”27
The SO emerged in response to growing critiques of the standard methods employed in inter-national development . The Observatory represents a departure from the World Bank’s prioriti-zation of randomized control trials (RCTs) as a primary means of impact evaluation . RCTs have held immense appeal to policymakers who believed that by proving the causal impact of par-ticular interventions (such as a nutrition program or participatory scheme), these can scale up to work across larger communities and even entire countries . But after years of practice, critics grew concerned that RCTs fail to account for the larger, complex context in which interventions are applied .28 Moreover, decision makers and analysts who design development programs
26. World Bank Social Observatory Website, Video, “The SO Leads to More Effective Projects.” 27. World Bank Social Observatory Website, “About Us.”
17
IntegratIng BIg Data anD thIck Data to transform PuBlIc servIces DelIvery
www.businessofgovernment.org
based on RCT results often live and work far from the communities they intend to help .29
Apart from criticisms of RCTs, concerns arose about existing participatory projects, intended to give communities direct control over key project decisions . Such projects form an important part of development assistance, taking up about seven billion dollars in World Bank’s portfolio .30 But this huge investment met with weak evidence of impact, and such projects often ended up usurped by local elites .
Vijayendra Rao, a lead economist in the Research Department of the World Bank and who directs the SO, recounted, “The vice president for South Asia at the time said, ‘It’s easy to criti-cize, but why don’t you fix it?”31 The SO was then established in 2011 as a joint initiative between the World Bank Research Department and the Bank’s South Asia Livelihoods team, charged with selecting and improving upon two livelihood projects from World Bank’s existing portfolio . This report will focus on the Pudhu Vaazhvu Project (PVP) in the Indian state of Tamil Nadu .
Participatory Tracking
At the heart of the SO’s efforts to build adaptive capacity lies “participatory tracking” (p-track-ing for short), an annual data collection system for track(p-track-ing indicators of livelihood and empow-erment among pre-existing women’s self-help groups (SHGs) . These SHGs integrate with village governments in that the chairperson of each SHG also heads the village council . Village meet-ings result in decisions about budgets and public goods projects, which directly impact citizens’ lives . In partnership with the government of Tamil Nadu, SO launched a pilot in one district, covering 80 villages and 32,000 residents .32
For the pilot, the main quantitative data collected came from a census survey of the residents, conducted for a baseline and follow-up studies . The survey had seventy questions, yielding about 100 variables .33 In addition, the researchers taped all the village and SHG meetings, generating a large cache of text data to be analyzed using machine learning techniques .
Unlike traditional community-based development assistance, SO coordinator Nethra Palaniswamy explains that p-tracking is “participatory, both in design and implementation .” This involves three distinct steps: (1) local women participate in designing a questionnaire for themselves, (2) the collected data is validated to ensure accuracy, and (3) the data is shared with the communities to aid their decision making, project implementation, and provision of public goods . In each of these steps, analysts enrich and utilize the survey data through immer-sion in the field .
Surveys designed by outsiders, particularly by analysts who work with communities in the developing world, often suffer from two common problems: the surveys fail to measure what matters to people on the ground, and survey questions are phrased in ways that make no sense to the local residents . Mitigating these problems, the SO team took the innovative step of involving the local women, through SHGs, to design their own survey . As Palaniswamy describes, “We have a set of outcomes that we as analysts want to track, but the question is, what would they—the women—want to know about themselves?”
29. Angus Deaton & Nancy Cartwright. “The limitations of randomized controlled trials.” VOX (CEPR’s Policy Portal). November 9, 2016. 30. Ghazala Mansuri & Vijayendra Rao. 2004. “Community-based and Driven Development: A Critical Review,” World Bank Policy Research Paper No. 3209. World Bank, Washington D.C.
31. Unless otherwise indicated, all direct quotes in this case study draw on the author’s interviews with Vijayendra Rao (March 21, 2018) and Nethra Palaniswamy (April 5, 2018), researchers at the World Bank.
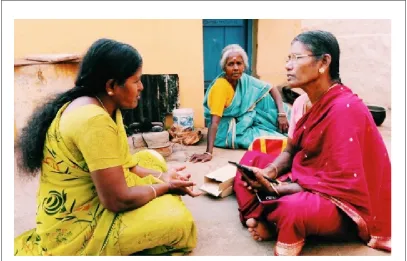
To implement this first step, the researchers recruited two community mobilizers from each village to lead focus group discussions among local women, asking them to address “what they would consider to be good lives,”34 their “aspirations”, and “things they dreamed of .”35 Afterward, larger groups of 70-100 women convened in a common place for more discussion, observed by the research team . The next step involved converting the ideas and inputs from the focus groups into survey questions, with the ultimate aim of designing a survey that would take 30 minutes to complete . The researchers then consulted the women for their opinions about the draft survey . After several iterations, they arrived at a final version that covered a range of issues, from women’s agency at home to nutrition, sanitation, and more .36
[image:18.612.75.479.307.682.2]Especially unique to this survey, questions were framed in ways that reflected the daily reali-ties and most pertinent issues facing the rural Indian women who comprised the respondents . For instance, whereas standard consumption surveys ask, “How much did you spend on food per month?”, the PVP survey asks, “Does the person who eats last get enough to eat?” (More examples are shown in Figure 1 .) An example that struck Palaniswamy most involved measur-ing empowerment and survey question that the women themselves proposed: “Can you choose the clothing you want to wear on your own?”
Figure 1: Standard vs. designed-by-participants survey questions
34. Ibid
35. World Bank Social Observatory Website, Video, “Democratizing Data to Empower Communities.” 36. Interview with Palaniswamy
Source: World Bank Social Observatory Website, “Participatory Tracking: Data Collection”
Food and Nutrition
Marriage
Empowerment
Digital Participation
Standard:
How much do you spend on the purchase of vegetables in a month?
User-Designed:
Does the person who eats last get enough to eat?
Standard:
What was your age at the time of your marriage?
User-Designed:
Did you marry your relative?
Standard:
Who makes decisions on assets and loans in your family?
User-Designed:
Do you decide on what clothes to wear based on your own preferences?
User-Designed:
Can you use a mobile phone on your own?
User-Designed:
19
IntegratIng BIg Data anD thIck Data to transform PuBlIc servIces DelIvery
[image:19.612.71.478.86.347.2]www.businessofgovernment.org
Figure 2: Recruiting local residents to implement the survey
The final survey was implemented by community SHG trainers who lived in the villages where data was collected . The trainers were tought to conduct the survey using tablets and mobile phones, which automatically transmitted survey results to a central computer system . Having villagers collect data from fellow villagers presents another innovation, as opposed to surveys taken by foreign staff members that can feel alienating and intimidating to local residents . By contrast, as the PVP survey . . .community, the data collection process “felt like a social event,” Palaniswamy describes . Another advantage of this method is that locals are invested in pro-viding and monitoring good-quality data . As Rao stresses, “The people in whose interest it is to keep the data true are the women from these communities .”37
Giving Data Back to the Communities
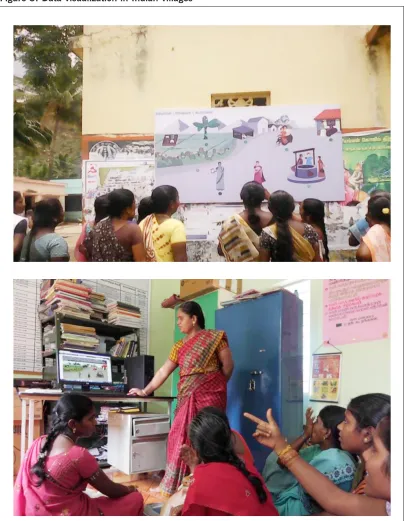
Following collection, all of the data went back to the communities through visualizations that the local women understand . This particular step resembles open government initiatives in the U .S, where a growing number of city governments have created platforms that visualize data on various topics and the delivery of program goals, using easy-to-read figures .38 The Indian context differs from the U .S . initiatives in that data visualization occurs at the village level, tai-lored to rural women with low literacy rates . To adapt to this condition, the SO team experi-mented with various methods of data visualization, including soliciting feedback from the women on which visuals worked and which did not . They also combined computer visualiza-tion with low-tech but effective methods like large posters .
37. World Bank Social Observatory Website, Video, “The SO—What We Do.” 38. Ho & McCall 2016, pp. 20.
Figure 3: Data visualization in Indian villages
21
IntegratIng BIg Data anD thIck Data to transform PuBlIc servIces DelIvery
www.businessofgovernment.org
Extensions
Moving forward, the SO hopes to extend the pilot in PVP to the entire state of Tamil Nadu, which will involve a massive number of 37 million village residents .39 Currently, the project reaches over three million households in the poorest areas of the state .40 The World Bank is also exploring the possibility of replicating the p-tracking method in Sri Lanka .41
Even though the SO’s projects are conducted in India, SO leader Rao believes that “p-tracking can work perfectly in (deliberative) environments” in America, and “might provide lessons for policymakers here in the U .S . who want to provide low-income folks with a meaningful public voice .”42 He cited the example of Washington D .C ., where mayor Anthony Williams worked with the nonprofit community to engage constituents from the city’s poorer wards in the pub-lic popub-licy process, which helped Williams to build support for his reelection .
Findings and Insights
The experience of the World Bank Social Observatory offers three generalizable insights for public managers .
1. Governments should collect data relevant to citizen needs. Governments should aim to collect data that citizens care about . In order to do so, public managers should ask citi-zens for their perspectives, instead of making assumptions . Particularly in the U .S . and other developed nations, local leaders and public managers can harness an already well-established deliberative apparatus to solicit feedback from citizens about what matters to them, and what citizens want to measure and track .
Collecting data relevant to people, however, requires that analysts embed themselves in local communities for some period of time . In the SO experience, this entailed observing local deliberations, listening to people, and having participants design their own sur-veys—in other words, thick data informed the collection of survey data . Onno Ruhl, India country director at the World Bank, stresses that an essential condition for the SO’s suc-cess is a team of young researchers “who are not afraid of getting their sandals dirty .”43
2. Governments should give data back to citizens to aid deliberation and decision making.
After collecting large amounts of data, governments should strive to return data to citi-zens to inform deliberation and collective decision making . Some U .S . cities already take such measures through open data initiatives . The SO case offers an additional insight: data visualization and sharing should not be limited to only wealthy, educated communi-ties . The case demonstrates the benefits of sharing data even with rural and mostly illit-erate village women, by using graphics and a combination of high-tech and low-tech methods . This could motivate the expansion of open data initiatives among low-income communities in the U .S . and other countries .
39. Interview with Rao
40. World Bank Social Observatory Website, “Pudhu Vaazhuv.” http://socialobservatory.worldbank.org/projects/pudhu-vaazhvu-tamil-nadu-livelihood
41. Interview with Rao
42. Vijayendra Rao, “Deliberation and Poverty: Lessons from the Indian Experience,” Spotlight on Poverty & Opportunity, September 6, 2011.
3. The hardest problem is not technology—it’s the politics. Rao cautions against obsessing with “techniques, cool stuff, and dashboards .” Even in collecting big data, he advises, it’s best to keep technology simple, “otherwise you can’t take it to scale .” In India, despite the low literacy and education levels, introducing tablets to community mobilizers and local women proved “surprisingly easy,” as Palaniswamy relates . At first, the trainers wor-ried that the women may drop the tablets, but in fact they quickly learned to use them . The older women, in particular, who regarded technology as “doing what young people are doing,” took special pride in their new skills .
Rather than technology, public managers should focus most on the social and political infrastructure . Rao cites various examples: Will the government listen? Will village meet-ings have teeth? Who will have control over funds? Can decisions be implemented? The SO successfully pushed through its pilot by working within the existing socio-political infrastructure—such as with pre-existing women’s SHGs—and by partnering with state actors at many levels .
CASE B: APHIS OUTREACH PROGRAM
Even with big data, working side by side with agency experts and decision makers to plan the research, interpret findings, and actually use the research to make deci-sions is and always has been the best way that research and data can improve busi-ness or government outcomes.
—Researchers at Fors Marsh Group44
From villages in India and the offices of the World Bank, this analysis turns to a case in the U .S . federal government—APHIS (Animal and Plant Health Inspection Service), a division of the U .S . Department of Agriculture (USDA) . The APHIS case illustrates the combined use of big data and thick data to achieve “tailored communication” in a revamped public education and outreach program .45
Background and Motivations
APHIS’s mandate is to “protect and promote U .S . agricultural health .”46 This includes defend-ing U .S . crops against the threats of invasive species and plant-based diseases brought into the country by domestic and international travelers .47 Travelers often bring in invasive species without knowing or caring about its consequences; this audience is relatively “uninterested, unaware, or actively disengaged .”48 To prevent pest introduction, AHPIS had to increase awareness about the threat of invasive species and inform travelers about the permissibility of bringing items into U .S . territory .
44. Griepentrog et al, “Using social marketing and data science,” pp. 263. 45. Ibid, pp. 248.
46. Official Website of APHIS. “About APHIS.” (Last modified August 3, 2016). https://www.aphis.usda.gov/aphis/banner/aboutaphis
47. “About APHIS.”
23
IntegratIng BIg Data anD thIck Data to transform PuBlIc servIces DelIvery
www.businessofgovernment.org
An effective outreach campaign must tailor information and messages to different traveler segments . To accomplish this goal, APHIS contracted for the research of this program with Fors Marsh Group (FMG), a data science company that has partnered with many U .S . government agencies .
Identifying the Problem
Instead of simply delegating the research and program design to a contractor and passively waiting for results, stakeholders at APHIS and data scientists at the contract partner worked together closely throughout the entire problem-solving process, from theory generation, data creation, to interpretation .
The first step of the research process involves theory generation—identifying the problem . As a lead investigator of the project expressed, theory generation entails asking, “What is the research question that we are trying to answer . What is the most parsimonious way to answer it?”49 The investigator explained that APHIS did not approach the researchers by asking them specifically to use big data . Instead, APHIS articulated the problem for which they needed help . In this case, APHIS needed to find out whom to target in their communication and public education efforts, given the agency’s limited resources . Expressed as questions, this translated to: “Where should we be? Who should we be communicating with? What are some of the most prominent items that are likely to be unwittingly or wittingly brought into the country?”50
Once the agency had articulated its problem, the data scientists’ formulated research questions and subsequently recommended appropriate response methods . This research process is prob-lem-driven, rather than data-driven, and followed “a multimethod approach involving both qualitative and quantitative techniques .”51 Specifically, the researchers applied computational statistical techniques to analyze a dataset of inspections, integrating this approach with inter-views of APHIS agents and travelers and cross-sectional surveys of departing travelers .
Finding Big Data
Apart from the first essential step of articulating their agency’s problem, APHIS experts also provided valuable “insight into the data sets that we could have at our disposal to create an analytical dataset,” Griepentrog related .52 For the quantitative analysis, data scientists at FMG used the Agricultural Quarantine Inspection Monitoring (AQIM) dataset, provided by APHIS . This dataset records all inspections carried out on travelers entering the U .S . internationally . The data spans a three-year period, from October 2008 to September 2011 . In total, it cata-logs over a million inspections . The researchers also incorporated data on risks provided by APHIS’ Center for Plant Health Science and Technology .
Moreover, instead of taking the dataset’s quality at face value, the researchers consulted an APHIS data manager “who understands intimately the rules and relationships that ultimately feed into [the dataset] .” The expert’s “historical and contextual knowledge” helped the analysts assess the construction and quality of the original data .53
49. Unless otherwise indicated, all direct quotes in this case study draw on the author’s interview with Brian Griepentrog (May 17, 2018).
50. Interview with Griepentrog.
51. “Using social marketing and data science,” pp. 248. 52. Interview with Griepentrog.
Analyzing Big Data
After creating and cleaning the dataset, the next step was analysis . To identify the right audi-ence segments for targeting, the researchers conducted a two-step clustering analysis . This identified “homogeneous subgroups of cases in a population”54—simply put, it divided travel-ers into distinct groups with similar attributes . The analysts first generated a tier of clusttravel-ers by products and sub-clusters by country of origin and point of entry . While human experts may group audiences based on knowledge and intuition, this subjective procedure can intro-duce errors and is untestable . By contrast, using computational methods can systematically divide the population in the dataset into segments, and generate an objective and verifiable set of predictions .
Converting Results into Program Design
The data scientist’s work did not end with producing statistical results . Next, they brought in officials from APHIS to help interpret the results and ultimately use the research to inform concrete aspects of program design . “Several client-provided insights guided prioritization of the segments,” the FMG research team reported . For example, taking into account their priori-ties and budget, APHIS experts indicated that certain animal and plant products and certain pathways should be represented . They also shared their knowledge of agriculture production within the U .S ., which helped to determine the risk for key program segments .
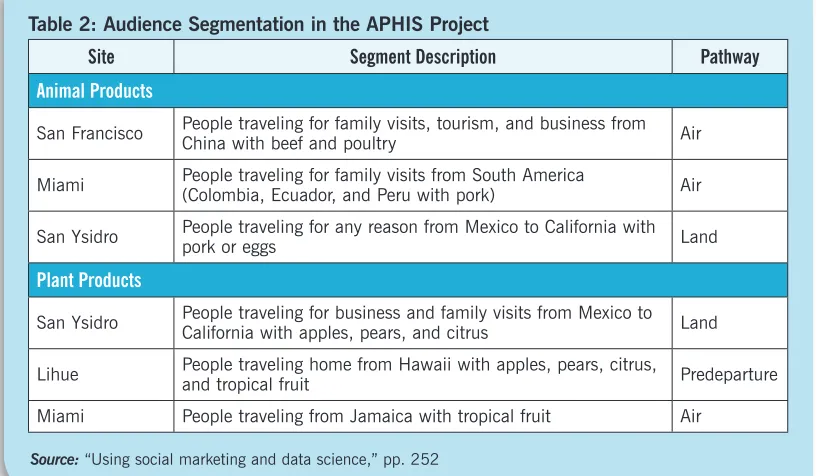
The final product of statistical analysis and joint discussion with the experts is shown in Table 2 as a differentiated map of segments of travelers likely to bring prohibited items, either inten-tionally or uninteninten-tionally, into U .S . territory through air, land, or pre-departure pathways .55
Instead of relying blindly on the machine, the map resulted from human collaboration that “represented a variety of priorities and stakeholders .”56 Indeed, the researchers insisted on the indispensable value of the “human component”:57
With analysis completed, we worked through a challenge inevitable when dealing with data science in the government space—subjective interpretation of the meaning of the results .
54. “Using social marketing and data science,” pp. 250.
55. Predeparture refers to entry into the continental U.S. from Hawaii and Puerto Rico. 56. Ibid, pp. 252.
25
IntegratIng BIg Data anD thIck Data to transform PuBlIc servIces DelIvery
www.businessofgovernment.org
Presentation of the results was just as important as the analysis . The research team took partic-ular care in giving APHIS joint ownership of the research process, taking the simple but inge-nious step of having their agency clients present the results at a briefing to agency leadership . As Griepentrog explained, the effect was “socializing” their partners so that the agency officers were involved in problem solving, rather than being “told what to do .”58
Bridging Big Data and Human Expertise
This emphasis on “socialization” was in line with the FMG research team’s overarching goal of breaking down the “us vs . them” mentality between data scientists and agency operators on the ground . In Griepentrog’s view, “immersion”—a term that thick data collectors and ethnogra-phers commonly use—is important because:
If you stay on the outside and just provide data, you’re creating a natural resistance of them [data scientists] telling us [people on the ground] how to do our jobs . But if you are in the field, on the ground, and functionally immersed, you break down the barrier, your recommendations are more likely to be plain language, and the people you are talking to feel like you know what you’re talking about .
[image:25.612.70.480.77.315.2]58. Interview with Griepentrog.
Table 2: Audience Segmentation in the APHIS Project
Site Segment Description Pathway
Animal Products
San Francisco People traveling for family visits, tourism, and business from China with beef and poultry Air
Miami People traveling for family visits from South America (Colombia, Ecuador, and Peru with pork) Air
San Ysidro People traveling for any reason from Mexico to California with pork or eggs Land
Plant Products
San Ysidro People traveling for business and family visits from Mexico to California with apples, pears, and citrus Land
Lihue People traveling home from Hawaii with apples, pears, citrus, and tropical fruit Predeparture
Miami People traveling from Jamaica with tropical fruit Air
The quote above highlights an especially important and novel insight: the necessity of bridging big data with human expertise, and of building rapport between data scientists and agency operators . Big data can make it tempting to assume that analytics alone will generate neces-sary results and obviate the need for human interpretation and “immersion .” But the APHIS case demonstrates that data scientists and agency experts can work together in key ways: • Jointly understand the problem to be solved .
• Identify appropriate data sources, their construction and quality . • Leverage contextual knowledge to inform the interpretation of results .
• Convert statistical results into concrete program designs that reflect agency priorities . • Garner internal support by giving clients joint ownership of product .
Product: A Differentiated Campaign
The research ultimately informed and led to a targeted outreach campaign by APHIS, branded as “Don’t Pack A Pest,” with a dedicated website and an active presence on social media . Empowered by precise information about audience segments, the communication program focuses on the riskiest groups, allocating budgets based on salient segment characteristics (for example, by traveler location) in a cost effective manner .
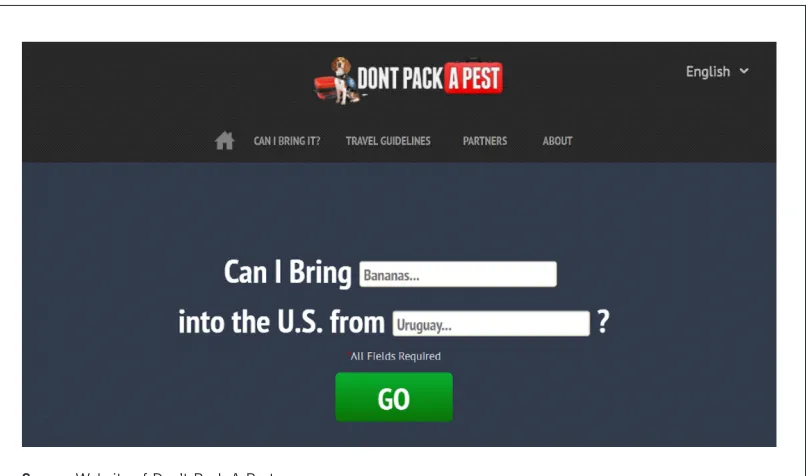
APHIS could then differentiate messages by geography and by items, with every airport having a different tailored focus and message depending on its most prevalent risks .59 The research results can also inform the design of the “Don’t Pack A Pest” website, which features a user-friendly section on travel guidelines (see Figure 5) . In this section, information about regula-tions and prohibiregula-tions is divided by food items (e .g ., animal products, cut flowers, fruits, and vegetables) and by country . On the “Can I Bring It?” page (Figure 6), after entering the item they wish to bring in and from which country, travelers receive immediate answers on whether these items are allowed or prohibited .
The federal “Don’t Pack a Pest” campaign has also inspired local initiatives . The Oregon Invasive Species Council and Oregon State University’s Sea Grant Program have collaborated on an outreach effort that targets international students at the major state universities . Combining social media, brochures, and videos, the initiative informs students about which items they are prohibited from bringing into the United States from their native country .60
59. Ibid
27
IntegratIng BIg Data anD thIck Data to transform PuBlIc servIces DelIvery
[image:27.612.73.480.82.348.2]www.businessofgovernment.org
Figure 5: Segmented Travel Guidelines
Figure 6: “Can I Bring It?” Query Page
Source: Website of Don’t Pack A Pest
[image:27.612.74.477.393.631.2]Findings and Insights
The APHIS case yields three key lessons for public managers .
1. Don’t blindly feed data and rely on algorithms. Big data and data analytics can appear to allow organizations to skip the hassle of human interactions . In fact, even with big data, the “human component” is indispensable . As the FMG research team cautioned, “Simply feeding all the information you have available into a program and running a set of scripts or routines on that data is a terribly irresponsible practice, but is becoming increasingly common in our experience .”61
2. Not all big data are alike. No single software solution or statistical model fits all big data sets . Specifically, the APHIS case illustrates the use of a “tall” data set that has a large number of observations (close to a million) relative to the number of predictors . As the researchers point out, “The reality is that agencies much less often have at their disposal data that is truly big, being both tall and fat .”62 But understanding the different shapes of big data matters, because it affects both the modeling choices in statistical analysis and the conclusions drawn .
3. Data scientists must know the agency’s context. Data scientists must not analyze data in a vacuum, out of touch with the agency’s context and needs . Communication and build-ing rapport is central to the job . In particular, Griepentrog stresses the importance of “breaking down the ‘us vs . them’ mentality” between agency and contractors from the beginning of the process . That is why, he explained, the research team took time and effort to immerse themselves in the work environment of APHIS experts, including by vis-iting airports and interacting with officers and travelers . In his words, it is essential for the team to “make it clear that you know how important [your client’s] work is .”63 The team added, “The analyst team must also become increasingly involved in the operation of the agency and the total set of information available to them .”64 In sum, having big data does not eliminate the need for contextual knowledge—in fact, having thick knowledge of the context is essential for making effective use of big data .
CASE C: LA EXPRESS BANK
Ethnography is a strong counterpart to looking at the data and drawing conclusions from it. We can confirm that we’re working on the right problem, that we haven’t missed something and that our interpretations are correct.
—Ken Mihalyov, Chief Innovation Officer, Xerox Transportation 65
61. “Using social marketing and data science,” pp. 263. 62. Ibid, pp. 247.
63. Interview with Griepentrog.
29
IntegratIng BIg Data anD thIck Data to transform PuBlIc servIces DelIvery
www.businessofgovernment.org
Apart from federal agencies, city governments have also employed big data and thick data to improve services delivery . This third case turns to the LA Express Park, a smart parking system launched in Los Angeles in May 2012 . This particular case illustrates the combined use of professional ethnographic research, technology, and real-time big data to improve parking options in congested cities .
Background and Motivations
The LA Express Park represents one component of the Los Angeles Congestion Reduction Demonstration, a citywide plan to reduce traffic congestion . Created with $15 million in grants from the U .S . Department of Transportation and $3 .5 million in city funds, this pilot program covers a 4 .5 square mile area in downtown Los Angeles . It was developed by Xerox, which has been in the transportation management business since 2010 .66
As one of the nation’s most densely populated cities,67 traffic congestion has remained a long-standing problem in Los Angeles, of which parking inefficiency constitutes a major issue . Drivers spent much time trying to find parking spaces, with large areas having few taken spaces and other areas too congested . As much as 30 percent of inner-city traffic resulted from drivers looking for parking .68
Smart Parking
The city proposed a smart parking system to address this problem, with demand-based pricing at its core . Traditionally, parking prices were uniform throughout the city . In a demand-based parking system, prices automatically adjust based on real-time occupancy data—meaning spots in high demand will be more expensive, and those in low demand will be cheaper; a similar concept applies to the fluctuating rates of ride-hailing services like Uber .
In the LA case, occupancy data is collected through about 6,000 smart meters installed throughout the pilot site . These meters have sensors that record when a spot is occupied, and transmit the information to a central computer that adjusts prices using an algorithm that tar-gets an average occupancy rate of 70 to 90 percent .
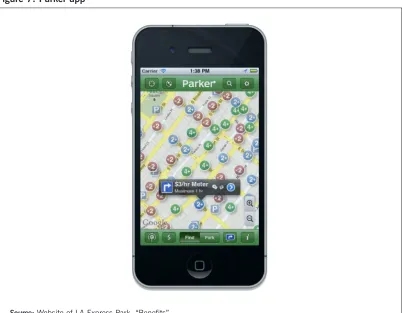
This dynamic pricing system connects to a free smartphone application called Parker, which lets drivers find available spaces and see how much they cost . In addition, drivers can use the app to reserve spots, pay for parking using credit cards, and receive notifications before the meter expires .
Branded as “save time, park smarter,” the LA Express Park represents a quintessential case of using technology, real-time data, algorithms, and mobile apps to ease parking constraints . In addition to reducing the number of cars cruising for spots, the pilot also aims to cut air pollu-tion and encourage drivers to choose alternative transportapollu-tion, such as carpools or bicycles, at times of high parking demand . Enthused, LA City Councilwoman Jan Perry has said, “We’re finally becoming the cutting-edge city that we’ve talked about for years .”69
66. Ibid.
67. Over 45,000 live downtown, a million work downtown, and 10 million people visit downtown every year (Video, “About LA Express Park,” Website of LA Express Park).
68. “Los Angeles cuts downtown congestion with smart parking.” Apolitical. September 5, 2017.
Figure 7: Parker app
Rapid Ethnography
Even with impressive technology, the design of LA Express Park did not rely only on technol-ogy and big data . Behind the scenes, ethnography and thick data played a major role in uncovering unexpected issues that subsequently motivated adjustments and new solutions . In Los Angeles, the ethnographic component of the study was carried out by the Palo Alto Research Center (PARC), owned by Xerox . Providing research services to companies and gov-ernment agencies, PARC houses a division of big data and ethnography . According to the divi-sion’s website, ethnography “makes explicit people’s tacit behaviors, practices, habits, knowledge, and unmet needs or desires—in various real-world (as opposed to laboratory or other isolated) context .”70
What makes ethnography necessary in a high-tech environment, where algorithms and big data can presumably run of their own? Ellen Isaacs, who previously worked for PARC, explains, “Ethnography helps in real time by showing that people may be having difficulties with parking meters or the signage . These are real world situations that we as operators can bring to the attention of public officials . This is where ethnography once again reinforces technology .”71
70. Website of PARC, “Competencies,” https://www.parc.com/work/competencies.html
71. Quoted in Kerschberg, Forbes, 2012
31
IntegratIng BIg Data anD thIck Data to transform PuBlIc servIces DelIvery
www.businessofgovernment.org
Traditionally, ethnography demands long periods of immersion in one site . In practical responses to time constraints, however, the research center developed a method of com-pressed ethnography known as REACT (Rapid Ethnographic Assessment and Communication Technique), with two features . First, REACT generates focused findings in a compressed time period, ranging from one to three months . Second, this approach records observations through intensive videotaping, and then communicates findings through engaging video podcasts that clients and stakeholders can view anytime and easily share .72
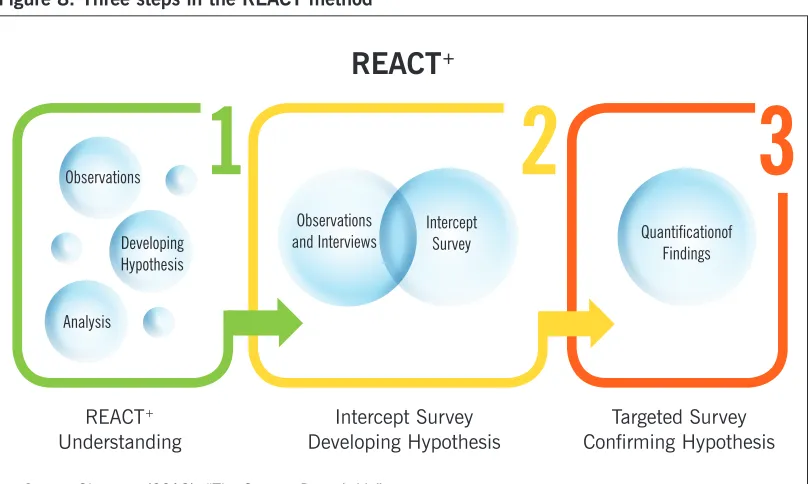
In the case of LA Express Park, the REACT method applied in three steps, summarized in Figure 8 . The first step involved understanding . As research ethnographer James Glasnapp describes, this meant “two cycles of the REACT methodology (observation, data collection, and analysis) each lasting six weeks to firmly ground themselves in the customer’s point of view .” The second step involved verifying observational findings using small-scale intercept surveys . The final phase employed a targeted survey for confirming hypotheses and quantify-ing findquantify-ings, culminatquantify-ing in a set of recommendations .
[image:31.612.73.479.366.608.2]Using the REACT method, researchers conducted ethnographic studies in 2013, after the launch of LA Express Park, to understand drivers’ awareness of reactions to the technology of demand-based pricing . They began with two cycles of on-site observations and interviews, each lasting six weeks, “to firmly ground themselves in the customer’s point of view .”73 Simultaneously, they did an intercept, a face-to-face survey with 73 people, paired with an online survey .
Figure 8: Three steps in the REACT method
72. Cummins, D., & Isaacs, E. “The Power of Observation.” Website of the International Parking Institute. February 29, 2013. 73. James Glasnapp. (2013). “The Camera Doesn’t Lie: Rapid Observation to Create Better Customer Experiences,” PARC White Paper, 17 December 2013, pp. 7.
Source: Glasnapp (2013), “The Camera Doesn’t Lie”
observations
and Interviews Intercept survey
observations
1
Quantificationof findings
2
3
analysis
Developing hypothesis
REACT
+REACT+ Understanding
Intercept Survey Developing Hypothesis
How Ethnography Informed Program Design
A primary question guided the investigation: Are drivers taking advantage of dynamic pricing? If no, why not? On the surface, the idea of dynamic pricing makes perfect sense . Nobel-prize winning economist William Vickery once predicted that demand-based pricing will ensure that “there will almost always be space available for those willing to pay the fee .”74 His vision, unrealistic in the past, is now enabled by technology and real-time data .
Yet thick data collected by the PARC ethnographers revealed a different, nuanced reality on the ground . First, the researchers were surprised to find that drivers had difficulty understand-ing parkunderstand-ing signs, as they reported: “Although we had set out to look at parkunderstand-ing, we wound up uncovering a problem with the signage .”75 By assuming the position of drivers, instead of regu-lators, their observations informed concrete recommendations about how to improve the park-ing signs . “The convention with parkpark-ing signs is to state what is restricted when, but drivers looking for a spot want to know what they can do now . . .In our podcast, we suggested that parking signs could be redesigned to be use-centered rather than restriction-centered.”76
Second, the researchers found that price was not the most important decision factor among drivers . In surveys, it ranked second to proximity, followed by availability of parking spots and time . Third, they also found that many consumers were simply not aware of the existence of dynamic pricing:77
PARC researchers observed that people generally parked and walked away from their meter quickly . When talking to many people while they parked, they were surprised at how unaware people were of the price of parking, that the price of parking may be different across the street or on adjacent streets, or that pricing may change in some locations three times a day .
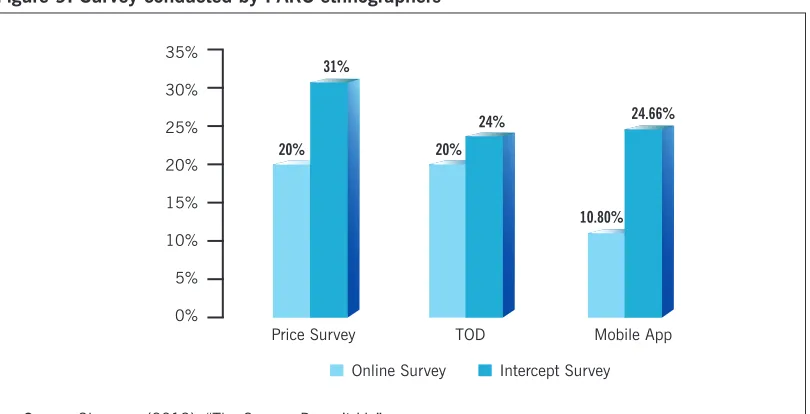
These observations reinforced surveys (see Figure 9) that indicate low awareness of recent parking price changes, time-of-day (TOD) dynamic pricing for parking in downtown Los Angeles, and mobile applications for smart parking . In 2013, Glasnapp noted, “Very few peo-ple were using smartphone applications to assist with finding parking .”78
74. Glasnapp, Du, et al, “Understanding Dynamic Pricing,” pp. 22. 75. Glasnapp & Isaacs, pp. 16.
76. Ibid.
33
IntegratIng BIg Data anD thIck Data to transform PuBlIc servIces DelIvery
[image:33.612.74.479.78.285.2]www.businessofgovernment.org
Figure 9: Survey conducted by PARC ethnographers
Summing up the situation, Glasnapp wrote:79
So why were drivers not taking advantage of the opportunities provided by dynamic pricing? We believe this is due to the fact that drivers’ current mode of behavior is to find their destination first and circle for parking with the goal of getting parking as close to that destination as possible . Without awareness of dynamic pricing, and lack-ing any obvious visual cues durlack-ing this process, their behavior remained unchanged . One can’t deny the stress of looking for parking in a busy metropolitan area, especially when on a tight schedule or in an unfamiliar area .
Apart from problems, the ethnographers also found promising signs that drivers would park in cheaper locations, and as far as three blocks away from their original spot, if they knew of dif-ferentiated pricing . Drivers’ current practices, however, were to park within one block of their destination . Furthermore, the researchers observed that dynamic pricing appealed more to cer-tain parkers than others—specifically, those who park for long periods of time cared more about pricing than short-stayers . Awareness of dynamic pricing also varied by demographic status; drivers with low education and non-native English speakers knew less about the tech-nology . Collectively, these findings suggest that public education about dynamic pricing can change parking behavior, and that messages should differentiate by groups .
79. Glasnapp, “The Camera Doesn’t Lie,” pp. 8.
Source: Glasnapp (2013), “The Camera Doesn’t Lie” 35%
30%
25%
20%
15%
10%
5%
0%
Price Survey TOD Mobile App
24.66%
10.80% 24%
20% 20%
31%
Thick data generated concrete ideas for public communication . In 2013, the adoption of smartphone applications was emerging but generally not yet widespread .80 PARC researchers suggested the development of an in-car navigation system to guide drivers to parking spots that met driver criteria . The ethnographic studies also noted the need for “obvious visual cues” while driving . Today, LA Express Park features a real-time parking guidance system, using large digital signboards that display information on available parking spaces at select locations . Sensitive to the needs of drivers without access to smartphones, LA Express Park provides alternative means of parking guidance—including 511, a free interactive voice recognition phone system with a website . Last, the FAQ section on LA Express Park’s website includes instructions on what drivers should do when smart meters break down . Informed by human observations, all of these features make a new system of parking technology easy to use .
Figure 10: Animation of digital parking signboards
Using Videos for Communication
In addition to discovering needs, problems, and mechanisms (explanations for why), the RAP