Vehicle–pedestrian collisions: validated models for
pedestrian impact and projection
D P. Wood1, C K Simms2* andD G Walsh3 1Denis Wood Associates, Dublin, Eire
2Department of Mechanical Engineering, Trinity College, Dublin, Eire 3J H Burgoyne and Partners LLP, Stevenage, UK
The manuscript was received on 21 June 2004 and was accepted after revision for publication on 30 September 2004.
DOI: 10.1243/095440705X6703
Abstract: The most important factor in pedestrian injuries from vehicle collisions is the impact velocity. In cases where the impact configuration can be ascertained, the most common method now used to determine vehicle speed involves the pedestrian projection distance. The more traditional method of using tyre brake marks is losing applicability as ABS braking systems become more common. The two most common impact configurations are wrap projection and forward projection, these being determined by the vehicle/pedestrian geometry and the initial conditions of the impact. In this paper, two models are presented for pedestrian forward and wrap projection impacts. These models are predicated on separating the total projection distance into the individual projection distances occurring during three principal phases of the collision. The models are novel as they use a rigid single-segment body representation of the pedestrian, include explicit modelling of the impact phase, and also allow for uncertainty in the input parameters. Published data are used to provide distributions for the input variables such as pedestrian and vehicle masses, etc. The model predictions of impact speed from overall projection distance are validated by comparison with real-world accident data.
Keywords: pedestrian collisions, projection distance, impact speed, coefficient of retardation
1 INTRODUCTION understanding the physical nature of the impact
and projection process. Deterministic models derive from fundamental equations, while statistical models Pedestrian injuries and fatalities from vehicle
colli-additionally allow for variability of the collision sions vary with environment, urban or rural and
circumstances. Thus, empirical and statistical models country. While the age and state of health of the
provide a range of predicted vehicle speeds for a pedestrian, the nature of the impact, and the vehicle
given projection distance, while deterministic models design all affect the injury outcome, the prime factor
provide a single estimate of vehicle speed without in injury/fatality risk is the vehicle speed [1–2]. This
confidence bounds. has implications for legislators in designing speed
In reality, not all of the factors relating the pro-limits for built-up areas, for safety engineers in
jection distance to impact speed can be determined, reducing vehicle aggressivity, and for biomechanics
and some of the collision mechanisms are not fully research into injury causation, and legal implications
understood (e.g. continued vehicle/pedestrian inter-in determinter-ininter-ing driver culpability and pedestrian
action and the pedestrian/ground contact mech-compensation following an accident.
anism), so a degree of uncertainty is inevitable. The use of the pedestrian projection distance as a
In this paper, simple analytical statistical models measure of pre-impact vehicle speed is increasingly
for forward and wrap pedestrian impacts are pre-important. The methods can be categorized as
sented. Unlike other models that concentrate on the empirical [3–5], deterministic [6–8], or statistical
particle representation of the pedestrian and on [9–11]. Empirical models do not contribute towards
the projection phase of pedestrian–vehicle collisions, * Corresponding author: Centre for Bioengineering, Department these single-segment models explicitly model both of Mechanical Engineering, Trinity College, Dublin, Eire. email: the impact and projection phases and account for
2 PEDESTRIAN IMPACT AND PROJECTION: vent head contact as the body rotates sideways off the bonnet, and these situations are known as fender KINEMATIC OBSERVATIONS
vault. The models presented here do not apply to fender vault.
The majority of pedestrian collisions occur with the
In each case there are many confounding factors fronts of vehicles and are classified into four distinct
including: vehicle geometry, impact duration, con-impact configurations [12,13]:
tinued pedestrian/vehicle interaction and
resti-(a) wrap projection; tution, pre-impact pedestrian transverse velocity,
(b) forward projection; vehicle braking, the extent of contact between the
(c) fender vault; pedestrian’s feet and the ground during fall-over, and
(d) roof vault. the nature of the bounce–roll–slide to rest of the
pedestrian. Pedestrian/vehicle geometry and respective velocities
at the time of impact determine the specific
con-figuration. Full engagement of the pedestrian with 3 MODELS the vehicle is defined as occurring when the vehicle
and pedestrian attain a substantially equal post- The models presented here represent the pedestrian impact velocity prior to restitution and separation. as a rigid, single-segment body.
This may not occur if there is a significant pre-impact transverse velocity of the pedestrian or corner
3.1 Forward projection
impact. Most frontal pedestrian collisions involve full
engagement with the vehicle [14] and are classified The forward projection model considers pedestrian as either ‘forward’ or ‘wrap’ projection collisions. In movement during three distinct phases:
some instances, categorization may be difficult as
(a) impact; aspects of two or more of the above classifications
(b) fall-over; may be fulfilled. In these circumstances, accident
(c) slide/roll/bounce to rest. reconstruction must proceed with additional caution.
Forward projection occurs when a high-fronted The total projection distance of the pedestrian is vehicle strikes a pedestrian, or a passenger vehicle the sum of the distance travelled in each individual strikes a child pedestrian. Here, the pedestrian’s phase (see Fig. 1)
centre of gravity is below the leading edge of the
S
total=Simpact+Sfall-over+Sslide/roll/bounce (1) bonnet and above bumper level. The impact projects
the pedestrian horizontally, with the pedestrian’s feet
mostly in contact with the ground, although the 3.1.1 Impact shoulders and head may rotate about the bonnet
During the impact phase of the collision, there is a edge and impact its upper surface. This is followed
momentum transfer between the vehicle (massM v)
by the pedestrian fall-over phase and subsequent
and the pedestrian (massM
p). The pre-impact vehicle
ground impacts with slide, roll, and bounce to rest.
speed isV
col. As a result of momentum conservation
Wrap projection occurs when the centre of gravity
and restitution effects,e, the post-impact horizontal of the pedestrian is higher than the leading edge
projection velocity,V
proj, of the pedestrian centre of
of the bonnet, resulting in rotation (wrap) of the
gravity (CG) is pedestrian over the bonnet. The front of the vehicle
strikes the legs and thigh/pelvic areas (primary
V proj=
M v M
v+MP
[1+e]V
col (2)
impact) and this is followed by secondary (head and/or shoulder) impact with the vehicle. After this,
The momentum transfer occurs over a time interval continued interaction with the vehicle or a flight
equal to the impact duration, t
impact. The distance
phase may occur, or a combination of both, followed
travelled by the pedestrian during this time is by ground impact(s) and slide, roll, and bounce to
approximated as rest.
Some frontal collisions are with the corner of the S
impact=Vprojtimpact (3)
vehicle where the pedestrian is deflected to one side
pre-Fig. 1 Schematic of the forward projection sequence, showing the system origin
Owing to the geometry of impact (the pedestrian CG andwonly lies below the upper edge of the vehicle front, e.g.
the leading edge of the bonnet of cars) there is no rotational component to pedestrian movement and
C
1/m −hsin(h)0 −h
A
sin(w)− k2h(sin(w)+mcos(w))
B
D
A
x¨ w¨
B
the pedestrian is modelled as maintaining an uprightorientation during this phase.
=
C
h(w˙)2cos(w)−g(w˙)2cos(w)−g
D
(8) 3.1.2 Fall-overThis phase follows directly from the impact phase These coupled second-order differential equations described above. The pedestrian CG now has a hori- were integrated using a Runge–Kutta integration zontal velocity,V
proj, and it is assumed that his/her scheme, with the following initial conditions
feet remain in contact with the ground. This results in frictional load acting to retard the base/feet of the pedestrian, causing the pedestrian to rotate. As
fall-A
x˙ xw˙
w
B
t=0
=
A
Vproj S
impact
0 0
B
(9)
over commences, gravitational effects further con-tribute to rotation of the pedestrian. This is modelled using a single rigid segment to represent the initially vertical pedestrian (see Fig. 1). The distance from
The integration is terminated when the fall-over the centre of gravity to the ground ish, the ground
angle, w, has reached 90° (t=t
w=90), and the
hori-reaction force is R, and the accompanying friction
zontal distance travelled by the pedestrian during force is mR. The motion is considered to be planar
this phase,S
fall-over, is
and the three equations of motion of the CG of the pedestrian segment with mass M
p and radius of Sfall-over=(x)t(w=90)−Simpact (10)
gyrationkcan then be written as
3.1.3 Slide/roll/bounce to rest M
px¨=−mR (4)
At the end of the fall-over phase, the segment CG M
py¨=Mpg−R (5) strikes the ground with a vertical velocity
M
pk2w¨=hRsin(w)+mRhcos(w) (6) V
v=h(w˙)t(w=90) (11)
The following additional constraint is imposed: the This vertical impact results of a loss in horizontal base of the segment (representing the feet) remains momentum, and, for the final phase of the pedestrian in contact with the ground during fall-over, which is segment motion, the initial horizontal velocity of the
expressed as CG is
y¨=h(w˙)2cos(w)+hw¨ sin(w) (7) V
proj f=(x˙)t(w=90)−m(Vv)t(w=90) (12)
The deceleration of the segment under the action The constraint in equation (7) effectively couples the
[image:3.595.139.458.66.176.2]and the horizontal distance travelled,S
slide/roll/bounce, is of the secondary impact (wrap-around ratio), the
mean velocity of the pedestrian’s head at secondary impact, as well as the mean collision speed to pro-S
slide/roll/bounce= V2
proj f
2mg (13) jection distance relationship [15–17]. Wood’s SSM
used momentum conservation to derive the angular It should be noted thatmis the coefficient of effective
and linear velocities of a rigid pedestrian segment retardation (rather than the formal coefficient of
following primary and secondary impact with the friction) and the same m is used during fall-over
vehicle front and bonnet/windscreen respectively. and slide.
These closed-form equations yielded pedestrian kinematics as a function of impact speed, mass
3.2 Wrap projection
(pedestrian and vehicle), and basic geometry (radius The wrap model presented in this paper considers of gyration, impact locations, and vehicle profile). pedestrian movement during the three phases of
vehicle/pedestrian impact, including wrap over the Primary impact. Owing to the horizontal momentum bonnet and restitution, flight, and slide/roll/bounce transfer from the vehicle to the pedestrian CG, and to rest. The total projection distance of the pedestrian before restitution effects, the common post-impact is the sum of the distance travelled in each individual velocity of the vehicle is
phase (see Fig. 2)
V cp=
C
M v M
v+Mp
D
Vcol (15)
S
total=Simpact+Sflight+Sslide/roll/bounce (14)
3.2.1 Impact Modelling of the SSM was carried out for a repre-sentative range of pedestrian heights and car profiles Following primary impact with the front of the
for the full range of vehicle braking conditions during vehicle, rotation of the pedestrian onto the bonnet
primary and secondary impacts. Regression analysis with a secondary impact occurs, generally between
shows that the distance travelled by the pedestrian the bonnet/windscreen and the head/shoulders.
between primary and secondary impact can be Separation of the pedestrian and the vehicle after
statistically represented as secondary impact occurs mainly owing to a
com-bination of vehicle braking and the pedestrian’s S
impact=0.887(1±1.3t)V0.1665cp (16) vertical and lateral motion. At low/moderate impact
wheretis the normally distributed random variable speeds, the pedestrian may drop back onto the
(mean=zero, standard deviation=1). This regression bonnet following this secondary impact and even
includes the displacement of the pedestrian during remain in contact with the leading edge of the bonnet
primary impact [13]. during rotation to head/shoulder contact. Following
separation, the flight and slide/roll/bounce to rest
Secondary impact. Figure 3 shows the secondary phases begin.
impact between the pedestrian’s head/shoulders and Wood [15–16] has previously derived a
single-the vehicle. Fursingle-ther regression analysis of Wood’s segment pedestrian projection model which has
SSM shows that, after secondary impact of the been validated using real-life accidents involving a
pedestrian with the car, and when vehicle braking variety of car types and shapes reconstructed as part
occurs (m
braking varying from 0 to 1.0g), the
post-of the KOB project (D. Cesari, 1989, personal
com-impact horizontal velocity of the pedestrian before munication). This validation showed that the
single-restitution,V
h, can be expressed as
segment model (SSM) satisfactorily predicted the
mean time to secondary impact, the mean location V
h=0.649(1±0.13t)V0.1665cp (17)
The orientation change of the pedestrian between primary and secondary impacts with the vehicle can be represented as
h
deg=69(1±0.0143t)×V0.164cp (22) and Fig. 3 shows that this increases the height of the pedestrian CG by
Fig. 3 Pedestrian/vehicle interaction during wrap
projection d
CG=0.63×height−0.15+(0.37×height+0.1) ×sin(h−90) (23)
where again t is a normally distributed random 3.2.2 Flight variable. (The upper bound forV
h was set equal to After head/shoulder (secondary) impact, the flight V
cp.) When there is no braking during the vehicle–
phase is assumed to commence. The time taken for pedestrian impact phase, then
ground contact to occur is V
h=Vcp (18)
t flight=
V
v+(V2v+2gdCG)1/2
g (24)
Using the KOB report (D. Cesari, 1989, personal communication), braking is modelled as occurring
and the horizontal distance travelled by the in 85 per cent of cases. Accounting for restitution
pedestrian during the flight phase is effects, the final horizontal velocity of the pedestrian,
V
proj, is S
flight=[Vproj×tflight] (25) V
proj=(1+e)Vh (19)
3.2.3 Slide/roll/bounce to rest The eccentric nature of the primary and secondary
impacts with the vehicle front imparts an angular At the end of the flight phase, the pedestrian CG strikes the ground with a vertical velocity
velocity to the pedestrian segment, and, following secondary impact with the bonnet/windscreen,
V
vf=(V2v+2gdCG)1/2 (26)
regression of Wood’s SSM shows that the resulting mean vertical velocity of the pedestrian CG,V
v mean, The vertical impact results in a loss of horizontal
can be represented as momentum, and, for the final phase of motion, the
initial horizontal velocity of the CG is V
v mean V
cp
=0.0675×[V
cp−6]0.369 (20) V
proj f=Vproj−m×Vvf (27)
The deceleration due to friction during slide/roll/ while the standard deviation of vertical velocity,
bounce to rest is modelled using the equation of V
v, is Vv mean/3.For individual collisions the vertical
uniform acceleration, and the horizontal distance velocity is represented as
travelled,S
slide/roll/bounce, is
V
v=Vv mean± V
v mean
3 t (21) S
slide/roll/bounce= V2
proj f
2mg (28)
wheretis a normally distributed variable. The cut-offlimit of 6 m/s forV
cpin equation (20) 3.3 Input data for the models is the maximum combined vehicle and pedestrian
velocity below which detailed SSM modelling showed Equations (1) and (14) detail the relationship between projection distance and impact velocity for forward that gravitational effects cause the pedestrian to drop
back onto the bonnet prior to separation, and the and wrap projection impacts respectively. However, the application of these equations requires knowledge vertical component of flight velocity is therefore zero.
At high impact speeds, the model has the capability to of the parameters M
p, Mv, m, h, k, and e (again, it
should be noted that m is the coefficient of retard-model roof vault cases, where the higher pedestrian
vertical velocity from the increased angular momen- ation rather than the coefficient of Coulomb friction, as the slide/roll/bounce interaction is complex and tum after primary impact yields increased vertical
[image:5.595.99.236.68.145.2]ascertain all of this information for a given accident, and so it is appropriate to consider the statistical distribution of these parameters. All of the input parameters have been approximated using standard statistical distributions (normal, log normal, uniform, etc.) based on values obtained from the published literature. The coefficient of restitution was estimated from experimental tests using dummies by Lucchini and Weissner [18], while the impact duration times are derived from cadaver tests by Aldman [19]. Further details of all the distributions used in these models are presented in Appendix 2. While it is recognized that the biofidelity of current crash dummies is limited, there is at present no alternative means to estimate the distributions of restitution in vehicle pedestrian collisions.
Fig. 4 Real accident data and scatterplot predictions of collision speed versus projection distance in
4 RESULTS forward projection (N=21)
There are two relevant aspects to the validation of regression of the scatterplot data of the form these models: the accuracy of the mean prediction
of velocity, and the degree of scatter about the mean V
col=A√S+B (29)
at a given projection distance compared with
real-yielded very high correlation coefficients (see Table 1). world data. Real world data on projection distance
Using the mean regression, the predicted velocity versus impact speed are derived from accident cases
was evaluated at each of the experimental projection where projection distance was measured and an
distances. The difference between the model and real alternative means of speed estimation was available.
accident velocity at each projection distance was defined as
4.1 Validation for the forward projection model
V
diff=Vreal−Vmodel (30)
The Monte Carlo method was used to account for
the statistical uncertainty of the input parameters The distribution ofV
diffapproximates well to a normal
distribution and the pairedttest (H
0: meanVdiff=0;
for the models. The resulting scatter of velocity pre-diction data as a function of projection distance was H
1: mean difference≠0) showed no statistically
significant difference at the 95 per cent confidence compared with the available real accident data for
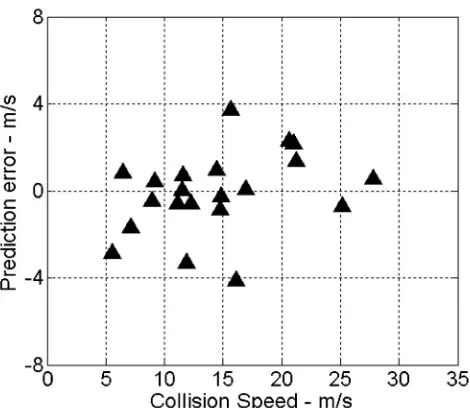
real-life adult forward projection cases [20,21] (see level compared with the real-life data (t=−0.28, p=0.784). Figure 5 shows that the prediction error Fig. 4).
The models clearly encompass the real accident is independent of collision speed. Linear regression confirms the absence of correlation, r2=0.08. It is data very well. There are insufficient test data to
characterize the standard deviation of test velocities concluded that the model provides a good prediction of both the mean and the scatter in collision velocity at each projection distance, but it can be seen that
the variability in the test data is well matched by for forward projection cases as a function of pro-jection distance.
[image:6.595.308.548.66.264.2]the cloud of model predictions. Furthermore, linear
Table 1 Global forward projection and wrap model limits
Wrap projection Forward projection
(V
col(m/s)=A√S (m)+B) (Vcol(m/s)=C×[S (m)−So]D) Confidence level for velocity prediction A B R S
o C D R
[image:6.595.99.493.653.741.2]For the wrap model, the linear relationship between S1/2andV
col does not hold at very low speeds, and a
power regression of the scatterplot data of the form V
col=C×[S−So]D (31)
is more appropriate. The value ofS
owas chosen to
maximize the regression coefficient, and the model parameters are given in Table 1. Using the mean regression, the predicted velocity was evaluated at each of the experimental projection distances. The difference between the model and real accident velocity at each projection distance was again defined using equation (30), and analysis showed these to approximate well to a normal distribution. The paired t test (H
0: mean Vdiff=0, H1: mean difference≠0)
showed no statistically significant difference at the 95 per cent confidence level (t=−0.61, p=0.55). Fig. 5 Prediction error versus real-world collision Figure 7 shows the difference between the real-life
speed for forward projection and predicted velocities as a function of real accident impact velocity. The data appear to show a weak biasing effect in which the model overpredicts colli-sion speed at low velocities and underpredicts at high 4.2 Validation for the wrap projection model
velocities. However, owing to the large size of the real As with forward projection, the wrap projection model accident dataset, N=185, it is possible to evaluate was run using the Monte Carlo method to account this by comparing the model and the real accident for statistical uncertainty in the input parameters. data for specific projection distance bands. The acci-The resulting scatter of data was compared with the dent data were divided into 20 equal √s bins, and available data for real accident cases [21–26] (see Fig. 8 shows the mean and±1 standard deviation of Fig. 6). There are far more real-world data available collision velocity in each bin as a function of throw (N=185) for this impact configuration, allowing a distance. At higher throw distances, where there was more comprehensive comparison of the mean and only one accident point in each bin, the standard variability of the accident data compared with the deviations for the test data could not be included.
model predictions. Figure 8 also shows the corresponding data from the
model predictions. It is clear that there is a very good
Fig. 6 Real accident data and scatterplot predictions
Fig. 7 Prediction error versus collision speed for wrap of collision speed versus projection distance in
[image:7.595.48.283.66.270.2] [image:7.595.48.289.510.697.2] [image:7.595.310.546.520.711.2]While there is good agreement between these two datasets for both mid and high projection distances, at low projection distances these two datasets show distinct differences. Otte reported all of these acci-dents as frontal, with pedestrian contact occurring not less than 20 cm from each bonnet edge. However, inspection shows cases with impact speeds up to 60 km/h where the projection distance is less than 4 m. This indicates strongly that full engagement of the pedestrian with the vehicle front did not take place. As previously mentioned, this would occur if the pedestrian had a significant transverse velocity at impact, resulting in rotation off the side of the vehicle after primary impact. These cases are more correctly classified as fender vault and should not be treated as wrap projection cases.
Fig. 8 Comparison of the mean and standard deviation of the SSM wrap model and the real accident data
5 DISCUSSION
5.1 Previous models
correspondence for both the mean and the variability
of the model data compared with the real-world There are many published models for speed pre-accident data. Furthermore, the apparent biasing diction from projection distance, of which recent effect seen in Fig. 7 is not present. It is therefore con- papers by Toor and Araszewski [5] and Han and Brach cluded that the model provides a good method for [11] provide a comprehensive review. In this paper, predicting collision velocity from throw distance only those previous models that best characterize for wrap projection cases. their respective approaches are discussed.
Very recently, Otte [27] has published data on The mean prediction from most models compares over 300 wrap projection real accidents recorded in favourably with a mean regression line fitted to a set Germany between 1985 and 2001. Figure 9 shows a of experimental data, and this has generally been the comparison between all of the previous wrap pro- method used to ‘validate’ a new model. However, jection real accident cases (used in the validation in there is considerable scatter of the real-world data this paper) and the new data presented by Otte. about the mean, and any valid model must also
reflect this uncertainty.
The small sample size (n<21) of real-world data for forward projection cases precludes determination of confidence limits for collision speed at a particular throw distance. For wrap projection cases, the larger sample size (N=185) makes this more feasible, and Evans and Smith [28] have performed a least-squares linear regression of V
col against s1/2. They present
their best fit line together with the 95 per cent limits, which are shown here in Fig. 10. Evans and Smith used only Hill and Dettinger data [22,23] on the basis that this was more up to date and displayed less scatter than older data. However, this approach can be flawed, as is seen by comparison with even newer data from Field [21] (see Fig. 10). The 95 per cent confidence limits for the mean and even the absolute minimum curve predicted by Evans and Smith based on the Hill and Dettinger data alone Fig. 9 Comparison of reported real-world wrap
pro-fails to encompass the scatter in the Field data. This jection cases: Otte [27] and other researchers
[image:8.595.46.286.64.257.2] [image:8.595.48.284.510.698.2]Fig. 10 Comparison of real accident data for wrap projection with previous work
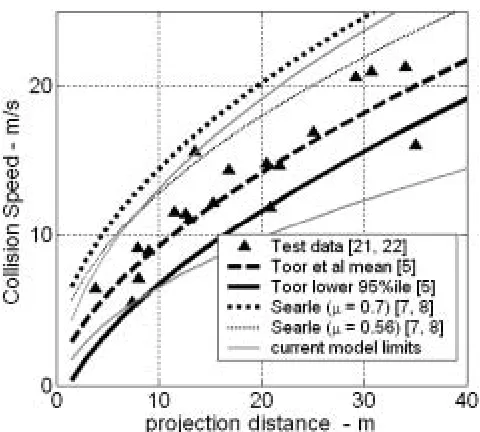
Fig. 12 Comparison of real accident data for forward projection with previous work
predictions are only correct for the real accident cases considered. More recently, Toor and Araszewski
although the small sample size makes the robustness [5] have derived empirical models based on power
of the minimum prediction difficult to assess. law regressions, and, again, the 95 per cent limits
for the mean are given. However, for both wrap and
5.2 Analytical models
forward projection cases, even the test data used to
derive the Toor–Araszewski models contain several Searle’s particle model [7,8] in which launch angle, cases lying outside the 95 per cent limits presented, coefficient of retardation, and horizontal momentum thus making those confidence limits not very robust. loss due to vertical ground impacts are considered, The Toor–Araszewski model mean and lower 95 per
is the most ‘physical’ of the early models. The impact cent limits for wrap projection are shown in Fig. 11. phase is not explicitly modelled. Searle accounted for Similarly, the Toor–Araszewski model mean and lower pedestrian/vehicle momentum interchange (by using 95 per cent limits for forward projection are shown
a 20 per cent correction factor for adults) but did not in Fig. 12. It can be seen that the Toor–Araszewski distinguish between different impact configurations. mean and minimum predictions are quite good, However, Searle’s model is effectively a slide model when the projection angle is set to zero (see Fig. 12). In that case, Searle’s prediction provides a velocity estimate that is higher than the test data. Searle assumed a retardation coefficientm=0.7, and this is part of the reason why his collision speed estimates are too high, but, even when a more realistic value is used (m=0.56), the curve is still too high (see Fig. 12). For wrap projection cases, Searle minimized his projection distance equation with respect to the launch angle (which is generally unknown) to arrive at a minimum velocity prediction (see Fig. 11). This minimum prediction is again too high, partly because of the high coefficient of retardation he used, but also because of the constant momentum interchange factor he employed.
[image:9.595.47.284.521.708.2]In addition, there is further difficulty with Searle’s model—the projection distance used is the total hori-zontal displacement of the pedestrian from impact Fig. 11 Comparison of real accident data for wrap
travelled by the pedestrian during the contact period and pre-impact speed and continued pedestrian/ vehicle interaction will probably always remain as an with the vehicle, which is ignored by Searle. In this
respect, he has not fully considered the physics of uncertainty.
At present it is therefore a better approach to the collision.
More recently, Han and Brach [11] developed a accept the uncertainty associated with each input parameter and observe the effect this has on the semi-analytic projection distance model in which
they include an impact phase distinct from the pro- resulting velocity prediction. This has been used to good effect by Simms et al. [37] to arrive at a jection phase. However, lacking a means of
calcu-lating the distance travelled during the impact phase, variety of reconstruction tables for various collision conditions.
these authors used an empirically tuned arbitrary function relating travel distance to impact velocity. Also, an arbitrary distribution was used for projection
angle. 6 CONCLUSIONS
The wrap and forward projection models linking
5.3 Complex multi-body models
vehicle speed to pedestrian projection distance that Finite element and multi-body techniques are have been presented in this paper accurately reflect capable of detailed modelling of vehicle and human both the mean and the variability about the mean body characteristics as well as the complex loading that are evident in the published real-world data. The patterns that occur during an impact. In 1983, van main advances of these models over existing models Wijket al.[6] used multi-body models with up to 15 are the application of a single-segment body model segments to predict whole body kinematics and head for the pedestrian, explicit modelling of the impact impact velocities which correlated well with dummy phase, application of fall-over behaviour in place of experiments. Since then, the finite element model of flight for forward projection, and the inclusion of the Hardyet al.[29] and Yang and Lovsund’s multi-body uncertainty of the input parameters that is inevitably model (ca 50 segments) [30] have both been success- present in the reconstruction of all real-world fully used to predict detailed interactions between pedestrian accidents.
pedestrians and vehicles in cases where the collision The Monte Carlo technique applied to these configuration is well defined [2,31,32]. Moreover, models currently provides the best means to predict these researchers have used known initial conditions not only vehicle speed from pedestrian projection (including vehicle speed) to analyse the injury distance for real-world cases but also any desired potential of the vehicle/pedestrian interaction. Even confidence level for these speed predictions [37]. in these cases, certain assumptions regarding
retard-ation coefficients and vehicle dive angle, pedestrian orientation, etc., were necessary. These deterministic
7 FUTURE WORK
models do not incorporate the uncertainty in the input parameters that is inevitably present when
The simplified nature of the models presented in this reconstructing real-life accidents. The main
appli-paper means that, in each individual collision simu-cation for deterministic models has therefore been
lation, many details are omitted. In the future, if in parameter studies where the influence of vehicle
distributions of pedestrian/vehicle initial conditions speed, front-end geometry and stiffness, etc., can be
and vehicle stiffness/geometry parameters can be studied with reference to a baseline case [33–35].
estimated, the Monte Carlo technique can be applied Bhallaet al.[36] used multi-body models of three
to complex multi-body or even finite element models vehicle types and three pedestrian sizes/masses to
to combine the benefits of more detailed modelling show that the relationship between speed and
pro-with the inevitable uncertainty associated pro-with jection distance was significantly affected by vehicle/
reconstructing real-life accidents. pedestrian characteristics and pedestrian ground
retardation. They concluded that the only way to address this problem is to use deterministic
multi-body modelling techniques. However, the same REFERENCES parameters they have shown to be crucial for
Conference Proceedings with International Research 19 Aldman, B., Thorngren, L., Bunketorp, O. and Committee on Biokinetics of Impacts (IRCOBI), Romanus, B.An experimental model for the study
1983, pp. 311–318. of lower leg and knee injuries in car pedestrian
2 Howard, M., Thomas, A., Koch, W., Watson, J.and impacts. IRCOBI, 1980, pp. 180–193.
Hardy, R. Validation and application of a finite 20 Toor, A., Araszewski, M., Johal, R., Overgaard, R. element pedestrian humanoid model for use in andHapper, A. Revision and validation of vehicle/ pedestrian accident simulations. In Proceedings of pedestrian collision analysis method. SAE paper IRCOBI Conference, 2000, pp. 101, 119. 2002-01-0550, 2002.
3 Evans, A. K.andSmith, R.Vehicle speed calculation 21 Field, J. Analysis of real world pedestrian/vehicle from pedestrian throw distance. Proc. Instn Mech. collisions in the United Kingdom. 6th Conference Engrs, Part D: J. Automobile Engineering, 1999,213, of Institute of Traffic Accident Investigators, 2003,
441–447. pp. 129–142.
4 Rau, H. and Otte, D. Car to pedestrian collisions 22 Hill, G. S. Calculations of vehicle speed from
with high speed impact. J. Verkehrsunfall und pedestrian throw.Impact, Spring 1994, 18–20. Fahrzeugtechnik, 2001. 23 Dettinger, J. Methods of improving the
recon-5 Toor, A.andAraszewski, M.Theoretical vs empirical struction of pedestrian accidents: development
solutions for vehicle/pedestrian collisions. SAE paper differential, impact factor, longitudinal forward
2003-02-0883, 2003. trajectory, position of glass splinters (in German).
6 Van Wijk, J., Wismans, J., Maltha, J. and J. Verkehrsunfall und Fahrzeugtechnik, December
Wittebrood, L. MADYMO pedestrian simulations. 1996, 324–330; January 1997, 25–30 (two parts).
SAE paper 830060, 1983. 24 Grandel, J., Zeisberger, H. and Walz, F. H.
7 Searle, J. A. and Searle, A. The trajectories of Kinematics and head injuries in vehicle/pedestrian
pedestrians, motorcycles, motorcyclists, etc., follow- accidents at speeds above 50 kph. In Proceedings of ing a road accident. SAE paper 831622, 1983. IRCOBI Conference, 1986, pp. 189–204.
8 Searle, J. A. The physics of throw distance in
25 Schneider, H. and Beier, G. Experiment and acci-accident reconstruction. SAE paper 930659, 1993.
dent: comparison of dummy test results and real 9 Wood, D. P. and Walsh, D. G. Pedestrian forward
pedestrian accidents. SAE paper 741177, 1974. projection impact. Int. J. Crashworthiness, 2002, 26 Steffan, H., Moser, A., Geigl, B.
andMotomiya, Y. 7(3), 285–305.
Validation of the coupled PC-Crash—MADYMO 10 Wood, D. P.andSimms, C. K. A hybrid model for
occupant simulation model. SAE paper 2000-01-0471, pedestrian impact and projection. Int. J.
Crash-2000. worthiness, 2000,5(4), 393–403.
27 Otte, D.Use of throw distances of pedestrians and
11 Han, I. and Brach, R. Impact throw model for
bicyclists as part of a scientific accident recon-vehicle–pedestrian collision reconstruction. Proc.
struction method. SAE paper 200401-1216, 2004. Instn Mech. Engrs, Part D; J. Automobile Engineering,
28 Evans, A. K.andSmith, R.Vehicle speed calculation 2002,216, 443–453.
from pedestrian throw distance. Proc. Instn Mech.
12 Ravani, B., Broughham, D. and Mason, R. T.
Engrs, Part D: J. Automobile Engineering, 1999,213, Pedestrian post-impact kinematics and injury
441–447. patterns. SAE paper 811024, 1981.
29 Hardy, R., Watson, J.andHoward, M.Developments 13 Eubanks, J. J., Hill, P. F., Casteel, D. A. and
in the simulation of real world car to pedestrian Solomon, S. S.InPedestrian Accident Reconstruction
accidents using a pedestrian humanoid finite and Litigation1998 (Lawyers and Judges Publishing
element model.Int. J. Crashworthiness, 2000, 5(1), Company).
102–117. 14 Wood, D. Pedestrian impact, injury and accident
30 Yang, J. K. and Lovsund, P. Development and
causation. InAutomotive Engineering and Litigation
validation of a human body mathematical model for (Eds G. A. Peters and B. J. Peters), 1991, Vol. 4, Ch. 3
simulation of car pedestrian collisions. In Proceed-(John Wiley).
ings of IRCOBI Conference, 1997, pp. 133–149. 15 Wood, D. P.Impact and movement of pedestrian in
31 Coley, G., de Lange, R., de Oliviera, P.,
frontal collisions with vehicles. Proc. Instn Mech.
Neal-Sturgess, C. E. and Happee, R. Pedestrian Engrs, Part D: J. Automobile Engineering, 1988,
human body validation using detailed real world 202(D2), 101–110.
accidents. In Proceedings of IRCOBI Conference, 16 Wood, D. P. Application of a pedestrian impact
2001, pp. 89–102. model to the determination of impact speed. SAE
32 Liu, X.andYang, J.Development of child pedestrian paper 910814, 1991.
models and evaluation with accident recon-17 Wood, D. P. Application of a rigid body impact
structions. In Proceedings of IRCOBI Conference, model to the pedestrian–car collision. In
Pro-2001, pp. 103–113. ceedings of International IRCOBI Conference, 1988,
33 Liu, X. J., Yang, J. K. and Lovsund, P. A study of pp. 241–252.
influences of vehicle speed and front structure on 18 Lucchini, E.andWeissner, D.Differences between
pedestrian impact responses using mathematical the kinematics and loadings of impacted adults and
34 Svoboda, J., Solc, Z.andCizek, V.Analysis of colli- m coefficient of retardation between sions between pedestrian and small car. Int. J. the pedestrian and the ground Crashworthiness, 2003,8(3), 269–276. m
braking coefficient of vehicle braking
35 Silva, M. P. T. and Ambrosio, J. A. C. Pedestrian impact and run over using a multi-body simulation tool.Int. J. Crashworthiness, 1999,4(3), 261–271.
36 Bhalla, K. V., Montazemi, P. and Crandall, J.
APPENDIX 2 Vehicle impact velocity prediction from pedestrian
throw distance: trade-offs between throw formulae,
crash simulators, and detailed multi-body modeling. This appendix contains details of the statistical In Proceedings of IRCOBI Conference, Munich, forms and literature sources used to model the input Germany, 2002, pp. 263–276. parameters for the Monte Carlo models.
37 Simms, C. K., Wood, D. P. and Walsh, D. G.
Confidence limits for impact speed estimation from pedestrian projection distance. Int. J.
Crash-Vehicle mass. A log normal distribution was used to worthiness, 2004,9(2), 219–228.
model vehicle mass based on FARS data [38]: 38 FARS, United States Department of Transport Fatal
Accident Reporting System, 1975–2002.
Log mean (kg) 7.0723
39 Pheasant Bodyspace—Anthropometry, Ergonomics
Log standard deviation (kg) 0.212 and Design, 1986 (Taylor and Francis).
40 Burg, H.andRau, H.Handbuch der Verkehrsunfall Rekonstruktion, 1981 (Verlag Information Ambs
Gmbh). Pedestrian mass. Pedestrian mass was modelled
41 Wood, D. P.andSimms, C. K.Coefficient of friction using normal distributions derived by Wood and
in pedestrian throw. Impact, J. ITAI, 2000, 9(1), Simms [10] and Wood and Walsh [9] who used source 12–14.
data from reference [39]:
Adults Children
APPENDIX 1 Mean (kg) 68.37 30.9
Standard deviation (kg) 16.13 11.7 Notation
CG pedestrian centre of gravity
Pedestrian height. Body height was assumed to be e coefficient of restitution
randomly related to mass to account for varying body
k pedestrian radius of gyration
proportions: about CG (m)
M
r vehicle+pedestrian)/vehicle mass Adults Children
ratio=(M
v+Mp)/Mv
R ground reaction force acting on Minimum height (m) 1.477 0.87
the pedestrian (N) Maximum height (m) 1.873 1.7
S total pedestrian projection
distance (m) S
fall-over pedestrian projection distance Pedestrian radius of gyration. The radius of gyration during the fall-over phase (m) is expressed as a normally distributed proportion of S
flight pedestrian projection distance body length [39]:
during the flight phase (m) S
impact pedestrian projection distance Meank/L 0.23
during the impact phase (m) Standard deviationk/L 0.0175 S
slide/roll/bounce pedestrian projection distance in
the slide/roll/bounce phase (m) V
col vehicle speed just prior to impact Pedestrian centre of gravity height. This is expressed
(m/s) as a normally distributed proportion of body length
V
cp combined vehicle and pedestrian [39]:
speed just after impact (m/s)
Meank/L 0.57
V
proj horizontal projection velocity of
Forward projection impact time. Aldman et al. [18] shows a linear dependence of restitution on impact speed
[19] measured the contact times during pedestrian impact in 38 tests. The results show a broadly normal
e=0.12−0.006V col(m/s) distribution:
Mean contact time (s) 0.056 Coefficient of retardation. Analysis by Wood and
Standard deviation (s) 0.024 Simms [41] indicates that the available test data on
Minimum (s) 0.01 coefficient of retardation are approximately normally
Maximum (s) 0.14 distributed:
Mean 0.561
Coefficient of restitution. Analysis by Wood and