R E S E A R C H A R T I C L E
Open Access
Relative benefit-risk comparing diclofenac to
other traditional non-steroidal anti-inflammatory
drugs and cyclooxygenase-2 inhibitors in patients
with osteoarthritis or rheumatoid arthritis: a
network meta-analysis
Anneloes van Walsem
1, Shaloo Pandhi
2, Richard M Nixon
2, Patricia Guyot
1, Andreas Karabis
1*and R Andrew Moore
3Abstract
Introduction:There is argument over the benefits and risks of drugs for treating chronic musculoskeletal pain. This study compared the efficacy, safety, and tolerability of diclofenac, ibuprofen, naproxen, celecoxib, and etoricoxib for patients with pain caused by osteoarthritis (OA) or rheumatoid arthritis (RA).
Methods:A systematic literature review used Medline and EMBASE to identify randomised controlled trials. Efficacy outcomes assessed included: pain relief measured by visual analogue scale (VAS); Western Ontario McMaster Universities Arthritis Index (WOMAC) VAS or WOMAC Likert scale; physical functioning measured by WOMAC VAS or Likert scale; and patient global assessment (PGA) of disease severity measured on VAS or 5-point Likert scale. Safety outcomes included: Antiplatelet Trialists’Collaboration (APTC), major cardiovascular (CV) and major upper gastrointestinal (GI) events, and withdrawals. Data for each outcome were synthesized by a Bayesian network meta-analysis (NMA). For efficacy assessments, labelled doses for OA treatment were used for the base case while labelled doses for RA treatment were also included in the sensitivity analysis. Pooled data across dose ranges were used for safety.
Results:Efficacy, safety, and tolerability data were found for 146,524 patients in 176 studies included in the NMA. Diclofenac (150 mg/day) was likely to be more effective in alleviating pain than celecoxib (200 mg/day), naproxen (1000 mg/day), and ibuprofen (2400 mg/day), and similar to etoricoxib (60 mg/day); a lower dose of diclofenac (100 mg/day) was comparable to all other treatments in alleviating pain. Improved physical function with diclofenac (100 and 150 mg/day) was mostly comparable to all other treatments. PGA with diclofenac (100 and 150 mg/day) was likely to be more effective or comparable to all other treatments. All active treatments were similar for APTC and major CV events. Major upper GI events with diclofenac were lower compared to naproxen and ibuprofen, comparable to celecoxib, and higher than etoricoxib. Risk of withdrawal with diclofenac was lower compared to ibuprofen, similar to celecoxib and naproxen, and higher than etoricoxib.
Conclusions:The benefit-risk profile of diclofenac was comparable to other treatments used for pain relief in OA and RA; benefits and risks vary in individuals and need consideration when making treatment decisions.
* Correspondence:akarabis@mapigroup.com 1Mapi, De Molen 84, 3995, AX Houten, The Netherlands Full list of author information is available at the end of the article
© 2015 van Walsem et al.; licensee BioMed Central. This is an Open Access article distributed under the terms of the Creative Commons Attribution License (http://creativecommons.org/licenses/by/4.0), which permits unrestricted use, distribution, and reproduction in any medium, provided the original work is properly cited. The Creative Commons Public Domain Dedication waiver (http://creativecommons.org/publicdomain/zero/1.0/) applies to the data made available in this article, unless otherwise stated.
Introduction
Osteoarthritis (OA) and rheumatoid arthritis (RA) are the most common arthritic conditions in adults [1]. Both diseases lead to joint degeneration, are extremely painful, and cause disability and a reduced quality of life [2,3], resulting in a substantial burden to society [4,5].
More than 1.5 billion people worldwide suffer from chronic pain, and arthritic conditions are one of the pri-mary sources for chronic pain. Its prevalence is increas-ing with an ageincreas-ing population and pain management is a global public health priority [6,7]. Pain also has mul-tiple serious sequelae, including depression, inability to work, disrupted social relationships, and even suicidal thoughts [7]. Chronic pain and musculoskeletal disor-ders are associated with some of the poorest health-related quality of life (HRQoL) states ahead of neuro-logical, renal, and cardiovascular (CV) diseases. Pa-tients with pain have a greatly diminished HRQoL, with severe restrictions on their functioning, work, and or-dinary activities of daily living [8].
Good pain relief is what patients require from treatment, and this comes with improvement in associated symptoms, function, and quality of life [8,9]. Non-steroidal anti-inflammatory drugs (NSAIDs), both traditional NSAIDs (tNSAIDs) and cyclooxygenase 2 inhibitors (COXIBs) are commonly prescribed to relieve patients from pain and in-flammation [2,3]. NSAIDs, both oral and topical, are highly effective analgesics that offer an array of meaningful and differentiated benefits in alleviating pain, and are one of the cornerstones for treating pain in arthritis patients [10,11]. Several pooled analyses and meta-analyses combin-ing randomised trials to estimate the efficacy of an NSAID of interest have been performed [12-16].
In 2004, rofecoxib was withdrawn from the worldwide market due to an increased risk in CV events during chronic use [17]. Since then, the arterial thrombotic risk associated with all NSAIDs, both tNSAIDs and COXIBs, has been subjected to extensive review by medicines reg-ulators, marketing authorization holders, and academic groups around the world [17,18]. Many reviews and (network) meta-analyses have been conducted to investi-gate safety issues [19-21]. The Coxib and traditional
NSAID Trialists’ (CNT) Collaboration has performed
meta-analyses on vascular and upper gastrointestinal (GI) effects of NSAIDs. The authors concluded that the vascu-lar risk of high-dose diclofenac, and possibly ibuprofen, are comparable to COXIBs, whereas high-dose naproxen is associated with less vascular risk than other NSAIDs. Additionally, the risk of upper GI complications, especially bleeds, was increased compared to placebo for all COXIBs and tNSAIDs [21].
These meta-analyses have focused mostly on the safety and only a few assessed the efficacy of NSAIDs. None have examined efficacy and safety together. Focusing
solely on risks and safety without addressing beneficial effects or investigating only efficacy in the absence of a risk and safety assessment fails to provide a holistic picture of the comparative benefit-risk assessment of NSAIDs. Regulators are also developing and testing tools and processes for balancing multiple benefits and risks as an aid to informed regulatory decisions about benefit-risk assessment of medicinal products [22]. A large number of randomised controlled trials (RCTs) comparing efficacy and safety of NSAIDs to placebo or to each other (head-to-head) exist, and data synthesis methods can be used to combine them into an overall assessment of efficacy and safety.
The objective of this study was to compare the effi-cacy, safety, and tolerability of commonly used tNSAIDs (diclofenac, ibuprofen, and naproxen) and COXIBs (cel-ecoxib and etoricoxib) in patients with pain caused by OA or RA by means of a Bayesian network meta-analysis (NMA) [23-25]. This study is novel in that a range of differ-ent key outcomes were brought together, including efficacy (relief of pain, physical functioning, patient global assess-ment (PGA)), tolerability (withdrawals), and safety (CV, GI) associated with these treatments in arthritis patients.
Methods
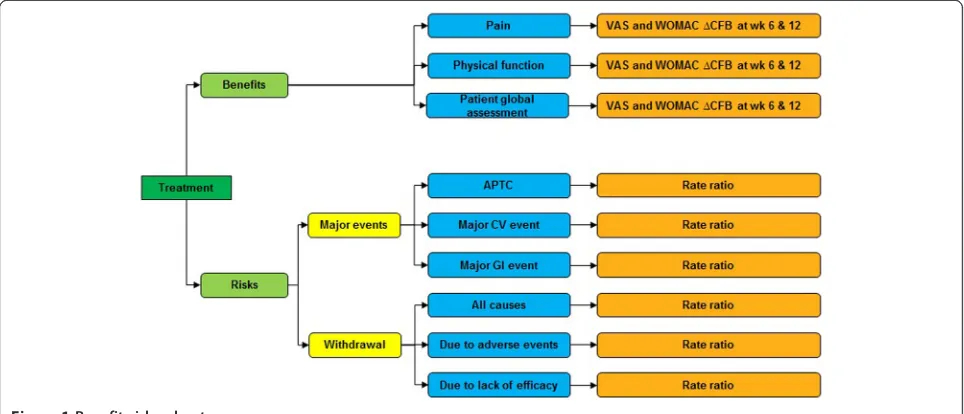
The Benefit-Risk Action Team, a descriptive framework to conduct benefit-risk assessment, has been followed for structuring and presenting the results of this study [26,27]. The framework provides guidelines on organizing, under-standing, and summarizing evidence of benefits and risks into tabular outputs and graphical summaries to allow comparison among treatments.
Decision context and benefit-risk outcomes identification
The decision context and the scope of the benefit-risk assessment with respect to the population, intervention, comparators, outcomes, and study design (PICOS) were as follows:
Population: adult patients (≥18 years old) with OA or RA. Intervention (Efficacy): diclofenac 75 to 150 mg/day, naproxen 500 to 1,000 mg/day, ibuprofen 1,200 to 2,400 mg/day, celecoxib 100 to 400 mg/day, or etoricoxib 30 to 90 mg/day.
Intervention (Safety and tolerability): diclofenac 75 to 200 mg/day, naproxen 500 to 1,500 mg/day, ibuprofen 1,200 to 2,400 mg/day, celecoxib 100 to 800 mg/day, or etoricoxib 30 to 90 mg/day.
measured by WOMAC VAS or WOMAC Likert scale; PGA of disease severity measured on a VAS or 5-point Likert scale; all outcomes reported at 6 or 12 weeks, within a 2-week range.
Safety and tolerability outcomes (Key risks): Antiplatelet Trialists’Collaboration (APTC) events (fatal and non-fatal myocardial infarction (MI) fatal and non-fatal stroke, and other fatal CV events); major CV events (stroke, MI, peripheral arterial thrombosis, peripheral venous thrombosis, pulmonary embolism, and CV-related death); major upper GI events (perforation, obstruction, and gastric and/or duodenal ulcer (includes bleeding ulcers)); withdrawal due to any cause, due to lack of efficacy, or due to adverse events, as reported at the longest follow-up time point.
Study design: RCTs with study duration≥2 weeks for efficacy outcomes and≥4 weeks for safety and tolerability outcomes.
A value tree was used to organize the key benefits and risks included in the assessment and drove the benefit-risk balance (Figure 1).
Identification and collection of source data
The MEDLINE, EMBASE, and Cochrane Library were searched in June 2013 using predefined search strategies (available in Additional file 1). Intervention and study design terms were used, while a search filter was applied to retrieve RCTs [28]. Abstracts and full text articles in a language other than English were excluded.
The relevance of each citation identified was assessed in a two-tiered approach. First, the titles and abstracts were screened for eligibility, and those fulfilling the se-lection criteria were included in the next stage. The full
texts of the selected articles were retrieved and assessed. Those that met the inclusion criteria were included for data extraction. The assessment of each citation was per-formed by one researcher (AvW) and checked against the original study by another (PG). Any disagreement was resolved by consensus or a third reviewer (AK).
Study and patient characteristics as well as efficacy, safety, and tolerability outcomes from the selected stud-ies were collected in a predesigned data extraction form. Details on study characteristics were extracted, including design; selection criteria; compared interventions; trial duration; number of randomised and intention-to-treat (ITT) patients; and allowance of gastro-protective agents, aspirin, and rescue medication use. Additionally, baseline patient characteristics were extracted, including age, gen-der, disease duration, history of hypertension and GI ulcer, and percentage of smokers.
For each continuous outcome of interest, the change from baseline (CFB) and the associated sampling vari-ance were extracted. If not available, CFB and standard error were calculated based on the available data (Additional file 2). If necessary, standardized mean dif-ferences were calculated as the difference in CFB (ΔCFB) between two interventions divided by the corresponding standard deviation [29]. For dichotomous outcomes, the number of patients experiencing an event was extracted or estimated based on reported percentages and ITT population. Subsequently, the total patient years (pyrs) of follow-up were calculated. Data presented in graphs were extracted using DigitizeIT version 1.5 software (DigitizeIT, Braunschweig, Germany).
[image:3.595.57.539.515.722.2]The methodological and reporting quality of the in-cluded trials was assessed with the Oxford quality scor-ing system for RCTs [30]. The risk of bias was assessed
Figure 1Benefit-risk value tree.
on the following aspects: randomization according to an appropriate method, allocation concealment of patients and investigators, and complete and non-selective reporting of study withdrawals and dropouts.
Data synthesis
The selected benefit and risk outcomes, that is, relative efficacy, safety, and tolerability of the treatments of interest were evaluated using a Bayesian NMA [23-25]. Analyses within the Bayesian framework involve data, a likelihood distribution, a model with parameters, and prior distributions for these parameters. In this analysis, a linear model with normal likelihood distribution was used for continuous outcomes and a Poisson likelihood with a log link was used for the dichotomous outcomes [31,32]. Flat (non-informative) prior distributions were assumed for all outcomes. Prior distributions of the rela-tive treatment effects were normal, with zero mean and variance of 10,000, while a uniform distribution with range zero to five was used as the prior of the between-study standard deviation.
It can be expected that there is always some variation in patient characteristics, study sites, and settings across studies. If these characteristics are effect modifiers of the relative treatment effects of interest, there will be het-erogeneity in the evidence base [25,33,34]. To allow for heterogeneity between studies, random effects models were evaluated. Random effects models assume that treatment effects may vary between studies, but come from a common distribution of treatment effects, with a mean for each treatment effect and a common between-study covariance matrix.
Furthermore, to address potential bias in our study, a
number of scenario analyses were defineda priori, while
for safety and tolerability only outcomes with at least 50 events reported in total per intervention (across all stud-ies in the network) were analysed. This was done be-cause a low number of events limits the ability of a meta-analysis to detect differences between treatments and can eventually give misleading results [35,36].
For each outcome, fixed and random effects models were evaluated, and the better fitting model was selected based on the lower Deviance Information Criterion value [31]. The posterior densities for unknown parameters were estimated using Markov chain Monte Carlo (MCMC) simulations. All results were based on 80,000 iterations on three chains, with a burn-in of 20,000 itera-tions. Convergence was assessed by visual inspection of trace plots. The accuracy of the posterior estimates was assessed using the Monte Carlo error for each parameter (Monte Carlo error <1% of the posterior standard devi-ation). All models were implemented using the Win-BUGS version 1.4.3 (MRC Biostatistics Unit, Cambridge,
UK) and were based on those defined by Diaset al. [32].
The Bayesian NMA provided posterior distributions of the relative treatment effects between interventions and the probability that one treatment is better than another for each outcome of interest. This probability is calcu-lated based on the proportion of MCMC cycles in which the specific treatment estimate is better than the com-parator [32]. The results of the NMA are presented in terms of ‘point estimates’ (median of posterior) for the relative treatment effects, along with the 95% credible intervals (95% CrI).
The efficacy outcomes are presented as ΔCFB, with
negative values indicating symptomatic improvement of diclofenac relative to comparator. Safety and tolerability results are presented as rate ratios (RR), with RR <1 in-dicating that diclofenac is associated with a lower risk relative to comparator.
Based on the relative treatment effects resulting from
the NMA, a treatment was considered as‘more effective’
if the point estimate suggested the treatment is expected to be better than the comparator and the 95% CrI does not include 0 (for continuous outcomes) or 1 (for
bin-ary outcomes); ‘likely to be favourable’ if the 95% CrI
includes 0 or 1 but the point estimate is favourable and
there is a ≥85% probability that treatment is better
than the comparator; ‘comparable’ if the 95% CrI
in-cludes 0 or 1 (probability treatment is better than com-parator >15% and <85%); ‘likely to be unfavourable’if the 95% CrI includes 0 or 1 but the point estimate is
unfavourable and there is a≤15% probability that
treat-ment is better than the comparator; ‘less effective’ if
the point estimate suggests the treatment is expected to be worse than the comparator and the 95% CrI does not include 0 or 1 [37].
Results
Literature search
analysis combining three RCTs (not published as inde-pendent studies) was identified and added to the evi-dence base [38]. The SLRs and NMAs were reviewed to validate the results of the selection process, but no fur-ther relevant studies were identified [12,13,20,39,40]. Fi-nally, 180 publications, covering 176 individual trials involving 146,524 patients, were identified during the re-view process and included in the NMA (see Additional file 3 for a complete list of identified studies). Of these, 154 reported relevant efficacy, safety, and tolerability outcomes, while the remaining 26 reported data on safety and/or tolerability outcomes only. Publications covering more than one study were extracted as separate studies, assuming separate randomization schedules were used for each study. Multiple publications covering a single study were grouped together and extracted as one study.
Study and patient characteristics
The majority of studies included patients with OA (n = 124) and a smaller number of studies investigated an RA population (n = 38) or a combined OA/RA population (n = 14). Most studies reported a randomised (n = 174), double-blind (n = 160), and multicentre study design (n = 128). Two non-randomised studies in which patients served as their own control were included [41,42]. Studies supporting a crossover design, in which patients switched
from placebo to active treatment or different dosages of the active substance were included. However, if no wash-out period between crossover was observed, data on effi-cacy and safety outcomes after crossover were not used. Overall, the 176 studies included 146,524 patients assigned to one of the interventions of interest, acetaminophen, or placebo. The size of the studies varied, with the number of patients randomised to each treatment ranging from 12 [42] to 6,769 [43]. The trial duration was ranging from 2 to 104 weeks, while most studies lasted 12 weeks (n = 56) or 6 weeks (n = 31). Long follow-up periods were mainly observed in studies investigating the safety of NSAIDs and COXIBs [43-46]. Ninety-five studies were placebo con-trolled while 80 studies compared active treatments only. Nineteen studies allowed the use of gastro-protective agents during the study, if needed by patients, and 38 studies specifically prohibited their use. Aspirin use was allowed during 66 trials at the discretion of the study in-vestigators, while relevant information was missing for 64 studies. An overview of study design characteristics of in-cluded studies is available in Additional file 4.
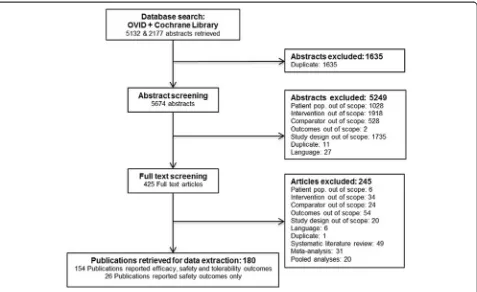
[image:5.595.61.538.88.380.2]The age of the enrolled patients ranged from 17 to 75 years. Most studies included a predominantly female population and two included women only [47,48]. Disease duration ranged between 1 and 21 years. Information on underlying risk factors that could act as potential treat-ment effect modifiers was poorly reported. Eighteen
Figure 2Study selection flow chart.
studies reported the percentage of patients with hyperten-sion, mostly recent safety studies with a special interest in CV risk associated with NSAIDs and COXIBs. Fewer studies reported on the percentage of smokers (n = 11), while more information was available on risk factors asso-ciated with GI safety, such as history of GI ulcer. Overall, 96 studies excluded patients with a history of GI problems, including active GI ulcer at the screening visit or an ulcer history within 1 to 6 months before enrolment. Details on the patient characteristics of included studies are provided in Additional file 5.
Based on the study design and patient characteristics summarised above, and despite some differences, all 176 studies were considered to be comparable and all studies reporting efficacy and/or tolerability outcomes were in-cluded in the analyses. The number of events for safety outcomes in the placebo arms of the studies was limited, with only three APTC events in 630 pyrs of follow-up, four major CV events in 727 pyrs of follow-up, and one major GI event in 548 pyrs of follow-up. Although the incidence of these rare serious events in the placebo arms is expected to be low (especially in studies with relatively short follow-up), this can introduce bias in the analysis [35,36]. For this reason, data were synthesized only if the sum of events per treatment across all in-cluded trials in the network was at least 50. As a result, the placebo and acetaminophen arms were not included in the safety analyses networks. Three-arm studies com-prising of two active treatment arms and one placebo arm were included in the evidence base, excluding data from the placebo arm. Furthermore, trials with zero events in all arms do not contribute to the evidence on the treatment effect and were thus excluded [32].
Efficacy and safety outcomes
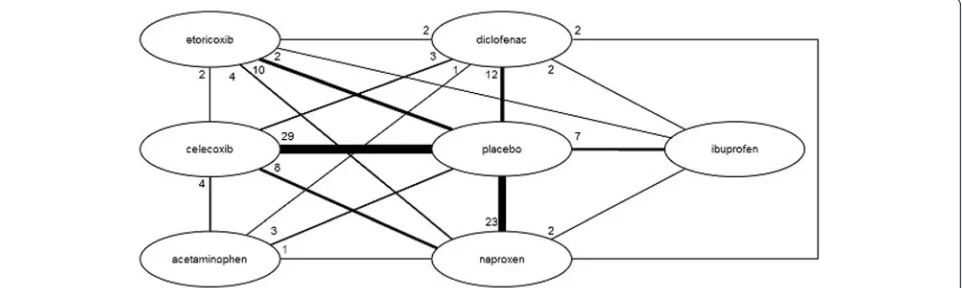
The network diagrams, based on all studies included in the NMA, are presented in Figures 3 (efficacy outcomes) and 4 (safety outcomes). Because not all studies provide data on each outcome, the network diagrams depicting
the available evidence per outcome are presented in Additional file 6. The individual study results used for the analyses are presented in Additional file 2.
Efficacy data were synthesized in a base case NMA and seven scenario analyses, listed below. The base case analysis estimated the relative efficacy of the in-terventions of interest with the maximum dose allowed in OA. Thus, for the base case, diclofenac 150 mg/day was compared to naproxen 1,000 mg/day, ibuprofen 2,400 mg/day, celecoxib 200 mg/day, and etoricoxib 60 mg/day. Next, a number of scenario analyses were performed:
1. Comparative efficacy of a lower diclofenac dose of 100 mg/day, versus the interventions of interest with the maximum dosage allowed in OA
2. Comparative efficacy of 150 mg/day diclofenac versus interventions of interest with the maximum dosage allowed in RA (celecoxib 400 mg/day and etoricoxib 90 mg/day)
3. Comparative efficacy of 100 mg/day diclofenac versus interventions of interest with the maximum dosage allowed in RA (celecoxib 400 mg/day and etoricoxib 90 mg/day)
4. Combining all doses of NSAIDs and COXIBs in OA and RA into a dose range, namely: diclofenac 75 to 150 mg/day, naproxen 500 to 1,000 mg/day, ibuprofen 1,200 to 2,400 mg/day, celecoxib 100 to 400 mg/day, and etoricoxib 30 to 90 mg/day 5. Combining VAS and Likert scales using effect sizes,
as described in theMethodssection
6. Including studies with at least 100 patients in each treatment arm (data available in Additional file7) 7. Including only studies recruiting patients after 1999,
as a proxy for improved study design according to current standards (data available in Additional file7).
[image:6.595.58.539.570.714.2]Majority of safety outcomes (>80%) were reported in trials involving a COXIB or high-dose tNSAID
(diclofenac 150 mg/day, ibuprofen 2,400 mg/day, or na-proxen 1,000 mg/day). Therefore, for the safety and tol-erability outcomes, all available data were pooled and a comparative analysis was conducted.
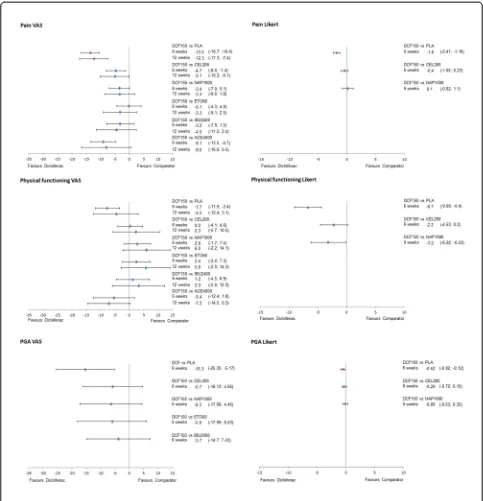
The results of the NMA on efficacy outcomes, as
ΔCFB with the corresponding 95% CrI for all treatments
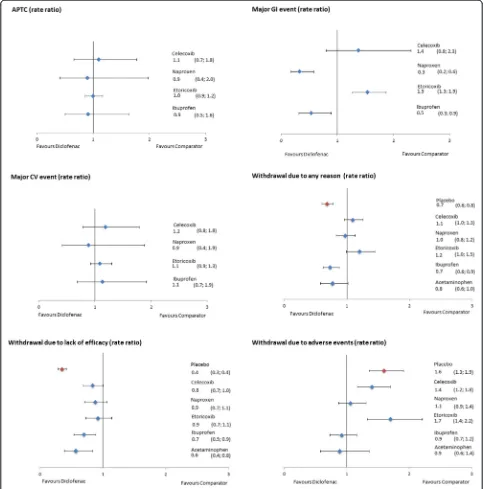
versus diclofenac are presented in Figures 4 and 5 for the 150 mg/day and 100 mg/day doses of diclofenac, re-spectively. Results for scenario analyses described above are presented in Additional file 7. The safety and toler-ability NMA results, as RRs, are presented in Figure 6 together with their 95% CrI.
Efficacy
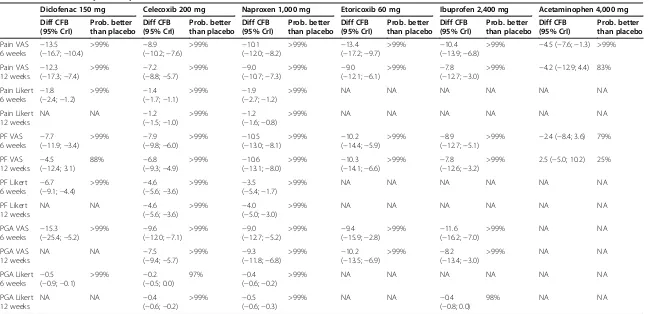
The relative efficacies versus placebo of all included drugs at their maximum recommended doses for OA (diclofenac 150 mg/day, celecoxib 200 mg/day, naproxen 1,000 mg/day, etorixocib 60 mg/day, ibuprofen 2,400 mg/day, and acetaminophen 4,000 mg/day) were evaluated (Table 1). On all efficacy outcomes, all drugs were more efficacious than placebo, with one exception: for physical functioning measured with VAS at 12 weeks, the probabil-ity of acetaminophen being better than placebo was only 25%.
The relative efficacy of diclofenac versus the other in-cluded drugs on pain, physical functioning, and PGA is described below.
Pain
Data on pain measured by VAS were reported in 60 studies at 6 weeks and in 36 studies at 12 weeks. No data were available for diclofenac 150 mg/day measured on a Likert scale at 12 weeks and for diclofenac 100 mg/ day measured on a Likert scale at 6 weeks.
Diclofenac 150 mg/day demonstrated better results (is likely to be more efficacious) in pain relief on VAS
compared to all other treatments in both time points (probability of being better, that is more efficacious, treatment >85% in all pairwise comparisons), with the exception of etoricoxib at 6 weeks (Pr (diclofenac being
better) = 52%). At 6 weeks, theΔCFB compared to
cel-ecoxib 200 mg/day was−4.7 (95% CrI−8.0,−1.4),
ver-sus naproxen 1,000 mg/day was −3.4 (−7.0, 0), versus
etoricoxib 60 mg/day was −0.1 (−4.3, 4.0), and versus
ibuprofen 2,400 mg/day was −3.2 (−7.9, 1.5).
Differ-ences were similar at 12 weeks, although improved
ver-sus etoricoxib (ΔCFB −3.3 (−9.1, 2.5)). Favourable
results were obtained for pain measured by a Likert
scale versus celecoxib (−0.4 (−1.0, 0.2)) and similar
versus naproxen (0.1 (−0.8, 1.1)) (Figure 5).
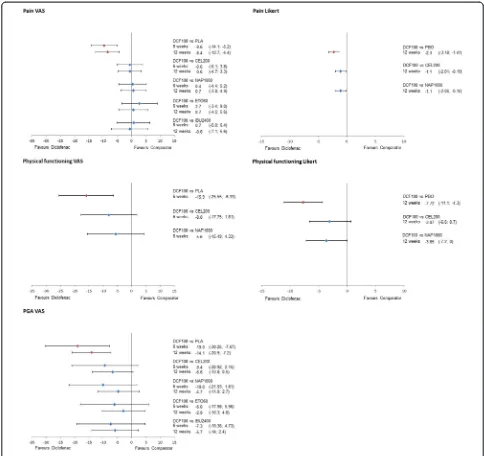
Diclofenac 100 mg/day was comparable to all inter-ventions, both at 6 and 12 weeks on a VAS scale (Figure 6). Pain Likert at 12 weeks showed a favourable result for diclofenac 100 mg/day compared to
cele-coxib (ΔCFB−1.1 (95% CrI −2.0,−0.2)) and naproxen
(ΔCFB−1.1 (95% CrI−2.0,−0.2)).
Physical functioning
Physical functioning measured by VAS was reported in 27 studies at 6 weeks and 16 studies at 12 weeks. Fewer studies reported data on a Likert scale; seven studies re-ported 6-week data and eight studies provided data on 12 weeks.
[image:7.595.60.541.88.273.2]Diclofenac 150 mg/day showed comparable efficacy on physical functioning (VAS) with celecoxib (6 weeks: ΔCFB 0.2 (−4.1, 4.6); 12 weeks: ΔCFB 2.3 (−5.7, 10.5)) and ibuprofen (6 weeks:ΔCFB 1.2 (−4.5, 6.9); 12 weeks: ΔCFB 3.3 (−5.9, 12.3)), while there was a trend in favour of naproxen and etoricoxib (Figure 5). When physical functioning was measured on a Likert scale at 6 weeks, diclofenac 150 mg/day was likely to be more effective compared to celecoxib (ΔCFB−2.2 (−4.5, 0.2)) and more
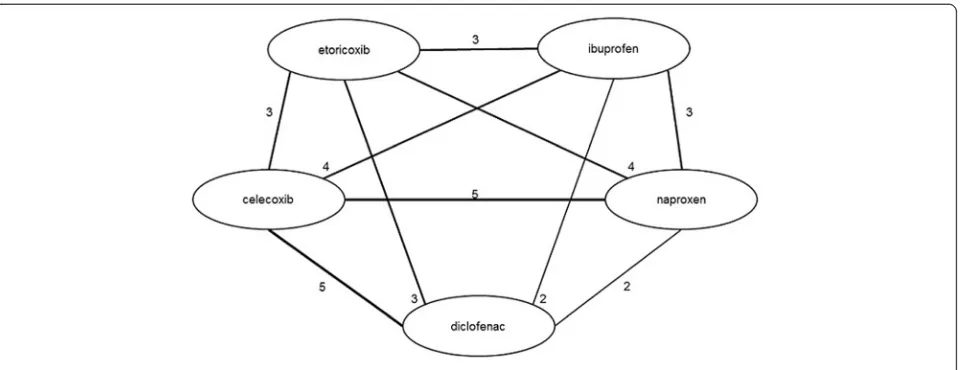
Figure 4Evidence network for safety outcomes.
effective than naproxen (ΔCFB −3.2 (−6.2, −0.2)). No data were available at 12 weeks.
Data for diclofenac 100 mg/day were only available for physical functioning VAS at 6 weeks and Likert at 12 weeks (Figure 6). In both cases, diclofenac 100 mg/day was likely to be more efficacious (Pr (diclofenac being better) >85%) than the rest of the treatments.
Patient global assessment
[image:8.595.56.539.88.589.2]There were 44 studies that provided data on PGA mea-sured by a VAS scale at 6 (24 studies) and 12 (20 studies) weeks, respectively. Data from Likert scale measurements were provided in 14 studies at 6 weeks and 13 studies at 12 weeks. For both diclofenac 150 and 100 mg/day, only one study provided data on PGA VAS at 6 weeks. No data were available for diclofenac 150 mg/day PGA VAS and
Likert at 12 weeks and one study reported data for diclofe-nac 100 mg/day PGA VAS. Likert data were unavailable for diclofenac 100 mg/day at 6 weeks.
When measured on a VAS scale at 6 weeks, the PGA results for diclofenac 150 mg/day are comparable to cel-ecoxib (ΔCFB −5.7 (−16.1, 4.7)), naproxen (ΔCFB −6.3 (−17.1, 4.4)), etoricoxib (−5.9 (−18.1, 6.0)), and ibuprofen (−3.7 (−14.7, 7.4)) (Figure 5). The results are similar when measured in Likert scale, with diclofenac being comparable to celecoxib (ΔCFB−0.3 (−0.7, 0.2)) and na-proxen (ΔCFB −0.1 (−0.1, 0.4)). No data were available for diclofenac 150 mg/day at 12 weeks.
The results for diclofenac 100 mg/day demonstrated comparable efficacy in terms of PGA VAS at 6 and
12 weeks with etoricoxib 60 mg/day, while it was likely to be more efficacious (Pr (diclofenac being better) >85%) versus all other treatments.
Scenario analyses
[image:9.595.55.539.88.544.2]A number of scenario analyses on the efficacy outcomes were performed to test the validity of the results pre-sented above. Comparing diclofenac 150 mg/day or 100 mg/day to the maximum dosages of etoricoxib (90 mg/day) and celecoxib (400 mg/day) allowed in RA did not change the conclusions. Neither did combining all doses into a single dose range for each intervention. Even though a substantial part of the studies identified was rela-tively old or small, including only recent studies or large
Figure 6Forest plots of relative efficacy of diclofenac 100 mg/day.
Table 1 Relative efficacy versus placebo
Diclofenac 150 mg Celecoxib 200 mg Naproxen 1,000 mg Etoricoxib 60 mg Ibuprofen 2,400 mg Acetaminophen 4,000 mg Diff CFB (95% CrI) Prob. better than placebo Diff CFB (95% CrI) Prob. better than placebo Diff CFB (95% CrI) Prob. better than placebo Diff CFB (95% CrI) Prob. better than placebo Diff CFB (95% CrI) Prob. better than placebo Diff CFB (95% CrI) Prob. better than placebo Pain VAS
6 weeks −
13.5 (−16.7;−10.4)
>99% −8.9
(−10.2;−7.6)
>99% −10.1
(−12.0;−8.2)
>99% −13.4
(−17.2;−9.7)
>99% −10.4
(−13.9;−6.8)
>99% −4.5 (−7.6;−1.3) >99%
Pain VAS
12 weeks −
12.3 (−17.3;−7.4)
>99% −7.2
(−8.8;−5.7)
>99% −9.0
(−10.7;−7.3)
>99% −9.0
(−12.1;−6.1)
>99% −7.8
(−12.7;−3.0)
>99% −4.2 (−12.9; 4.4) 83%
Pain Likert 6 weeks
−1.8 (−2.4;−1.2)
>99% −1.4
(−1.7;−1.1)
>99% −1.9
(−2.7;−1.2)
>99% NA NA NA NA NA NA
Pain Likert 12 weeks
NA NA −1.2
(−1.5;−1.0)
>99% −1.2
(−1.6;−0.8)
>99% NA NA NA NA NA NA
PF VAS
6 weeks −
7.7 (−11.9;−3.4)
>99% −7.9
(−9.8;−6.0)
>99% −10.5
(−13.0;−8.1)
>99% −10.2
(−14.4;−5.9)
>99% −8.9
(−12.7;−5.1)
>99% −2.4 (−8.4; 3.6) 79%
PF VAS
12 weeks −
4.5 (−12.4; 3.1)
88% −6.8
(−9.3;−4.9)
>99% −10.6
(−13.1;−8.0)
>99% −10.3
(−14.1;−6.6)
>99% −7.8
(−12.6;−3.2)
>99% 2.5 (−5.0; 10.2) 25%
PF Likert
6 weeks −
6.7 (−9.1;−4.4)
>99% −4.6
(−5.6;−3.6)
>99% −3.5
(−5.4;−1.7)
>99% NA NA NA NA NA NA
PF Likert 12 weeks
NA NA −4.6
(−5.6;−3.6)
>99% −4.0
(−5.0;−3.0)
>99% NA NA NA NA NA NA
PGA VAS
6 weeks −
15.3 (−25.4;−5.2)
>99% −9.6
(−12.0;−7.1)
>99% −9.0
(−12.7;−5.2)
>99% −9.4
(−15.9;−2.8)
>99% −11.6
(−16.2;−7.0)
>99% NA NA
PGA VAS 12 weeks
NA NA −7.5
(−9.4;−5.7)
>99% −9.3
(−11.8;−6.8)
>99% −10.2
(−13.5;−6.9)
>99% −8.2
(−13.4;−3.0)
>99% NA NA
PGA Likert
6 weeks −
0.5 (−0.9;−0.1)
>99% −0.2
(−0.5; 0.0)
97% −0.4
(−0.6;−0.2)
>99% NA NA NA NA NA NA
PGA Likert 12 weeks
NA NA −0.4
(−0.6;−0.2)
>99% −0.5
(−0.6;−0.3)
>99% NA NA −0.4
(−0.8; 0.0)
98% NA NA
Pain VAS, PF VAS, and PGA VAS are in mm. Pain Likert scale runs from 0 to 20, PF Likert scale runs from 0 to 68, PGA Likert scale runs from 0 to 5. CFB, change from baseline; CrI, credible interval; VAS, visual analogue scale; PF, physical functioning; PGA, patient global assessment; NA, data not available.
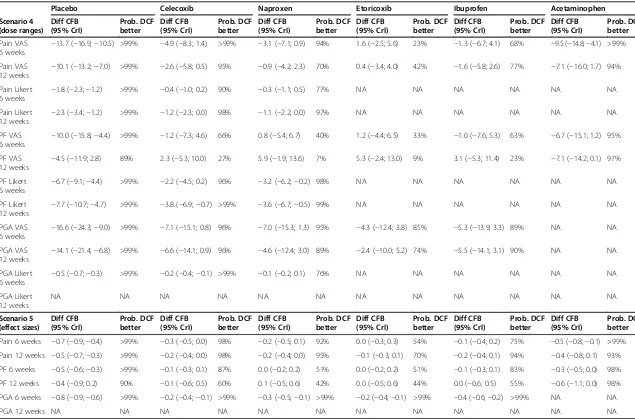
studies in the analysis did not influence the relative effi-cacy of diclofenac compared to other NSAIDs. Lastly, combining different outcome assessment tools, that is VAS and Likert scales, resulted in similar conclusions on efficacy as the base case analysis. Results of all scenario analyses are presented in Table 2 and Additional file 7.
Safety
The safety results presented below were based on all available data for the doses (that is, diclofenac 75 to 200 mg/day, naproxen 500 to 1,500 mg/day, ibuprofen 1,200 to 2,400 mg/day, celecoxib 100 to 800 mg/day, or etoricoxib 30 to 90 mg/day).
APTC
Data on APTC events were reported in 22 studies. Of these, 13 studies were included in the analyses after ex-clusion of the placebo arms. Most studies reported data for the two COXIBs (seven) and diclofenac (seven). Five studies provided data for ibuprofen and only two studies reported APTC events for naproxen. The longest avail-able follow-up was for diclofenac and etoricoxib (41,225 and 40,578 person years, respectively), with over 96% originating from the MEDAL program. Diclofenac was associated with a similar risk of an APTC event as all other interventions, with an RR of 1.1 (0.7, 1.8) versus celecoxib, 0.9 (0.4, 2.0) versus naproxen, 1.0 (0.9, 1.2) versus etoricoxib, and 0.9 (0.5, 1.6) versus ibuprofen.
Major CV events
Twenty-six studies provided data on major CV events, of which 15 were included in the NMA. Naturally, all studies reporting APTC events were included in this analysis and two additional studies reporting major CV events for naproxen, etoricoxib, and ibuprofen were identified [49,50]. Etoricoxib studies provided the longest follow-up (26,547 pyrs), with most of the data coming from the MEDAL program (>97% of pyrs). As demon-strated in Figure 7, diclofenac was associated with a similar risk of major CV events as all other interven-tions, with an RR of 1.2 (0.8, 1.8) versus celecoxib, 0.9 (0.4, 1.9) versus naproxen, 1.1 (0.9, 1.3) versus etori-coxib, and 1.1 (0.7, 1.9) versus ibuprofen. The probability of diclofenac being a safer treatment (that is, reducing the number of events) was low (<25%) for all pairwise comparisons, with the exception of naproxen (62%).
Major upper GI events
Major upper GI events were reported in 29 studies. The analysis included 20 studies comparing active treatment arms. Most data were available for celecoxib and na-proxen, with 10 studies reporting for each treatment. However, the longest follow-up was available for diclofe-nac (27,300 person years, >90% from MEDAL program).
Diclofenac was associated with a lower risk for major upper GI events than both naproxen and ibuprofen, with an RR of 0.3 (0.2, 0.6) versus naproxen and 0.5 (0.3, 0.9) versus ibuprofen. Diclofenac was associated with a com-parable risk of major upper GI events compared to cele-coxib (RR 1.4 (0.8, 2.3)) and higher compared to etoricoxib (RR 1.5 (1.3, 1.9)).
Tolerability
The analysis of tolerability outcomes was based on all available data for the dose ranges of interest (diclofenac 75 to 200 mg/day, naproxen 500 to 1,500 mg/day, ibu-profen 1,200 to 2,400 mg/day, celecoxib 100 to 800 mg/ day, or etoricoxib 30 to 90 mg/day).
Withdrawal due to any reason
The number of patients withdrawing for any reason was reported in 96 studies. As demonstrated in Figure 7, diclo-fenac was associated with a lower risk of withdrawal due to any reason than placebo, ibuprofen, and acetamino-phen, with an RR of 0.7 (0.6, 0.8), 0.7 (0.6, 0.9) and 0.8 (0.6, 1.0), respectively. The risk was similar for diclofenac compared to celecoxib and naproxen, with an RR of 1.1 (1.0, 1.3) and 1.0 (0.8, 1.2), respectively. Diclofenac was as-sociated with a higher risk of withdrawal compared to etoricoxib, with an RR of 1.2 (1.0, 1.5) (Figure 7).
Withdrawal due to adverse events
Patients withdrawing because of adverse events were re-ported in 105 studies. Diclofenac was comparable to na-proxen (RR 1.1 (0.9, 1.4)), ibuprofen (0.9 (0.7, 1.2)), and acetaminophen (0.9 (0.6, 1.4)). The risk was higher for diclofenac compared to placebo (RR 1.6 (1.3, 1.9)), cele-coxib (1.4 (1.2, 1.8)), and etoricele-coxib (1.7 (1.4, 2.2)) (Figure 7).
Withdrawal due to lack of efficacy
Patients withdrawing because of lack of efficacy were re-ported in 89 studies. Diclofenac was associated with a lower risk of withdrawals due to lack of efficacy com-pared to placebo (RR 0.4 (0.3, 0.4)), celecoxib (0.8 (0.7, 1.0)), ibuprofen (0.7 (0.5, 0.9)), and acetaminophen (0.6 (0.4, 0.8)), while the risk was comparable to that of na-proxen (0.9 (0.7, 1.1)) and etoricoxib (0.9 (0.7, 1.1)) (Figure 7).
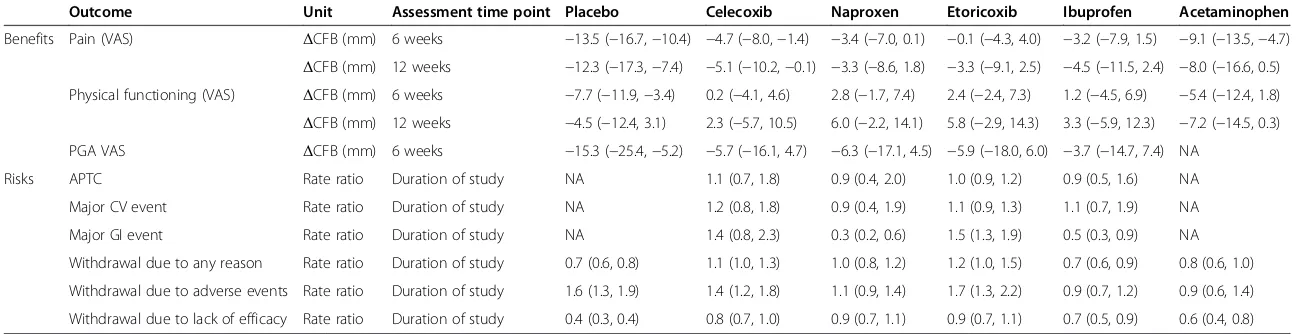
The results of the key benefits and risks for diclofenac 150 mg/day versus the other treatments of interest are summarised together in Table 3.
Discussion
(dose ranges) (95% CrI) better (95% CrI) better (95% CrI) better (95% CrI) better (95% CrI) better (95% CrI) better
Pain VAS
6 weeks −
13.7 (−16.9;−10.5) >99% −4.9 (−8.3; 1.4) >99% −3.1 (−7.1; 0.9) 94% 1.6 (−2.5; 5.6) 23% −1.3 (−6.7; 4.1) 68% −9.5 (−14.8;−4.1) >99%
Pain VAS 12 weeks
−10.1 (−13.2;−7.0) >99% −2.6 (−5.8; 0.5) 95% −0.9 (−4.2; 2.3) 70% 0.4 (−3.4; 4.0) 42% −1.6 (−5.8; 2.6) 77% −7.1 (−16.0; 1.7) 94%
Pain Likert
6 weeks −
1.8 (−2.3;−1.2) >99% −0.4 (−1.0; 0.2) 90% −0.3 (−1.1; 0.5) 77% NA NA NA NA NA NA
Pain Likert 12 weeks
−2.3 (−3.4;−1.2) >99% −1.2 (−2.3; 0.0) 98% −1.1 (−2.2; 0.0) 97% NA NA NA NA NA NA
PF VAS
6 weeks −
10.0 (−15.8;−4.4) >99% −1.2 (−7.3; 4.6) 66% 0.8 (−5.4; 6.7) 40% 1.2 (−4.4; 6.5) 33% −1.0 (−7.6; 5.3) 63% −6.7 (−15.1; 1.2) 95%
PF VAS 12 weeks
−4.5 (−11.9; 2.8) 89% 2.3 (−5.3; 10.0) 27% 5.9 (−1.9; 13.6) 7% 5.3 (−2.4; 13.0) 9% 3.1 (−5.3; 11.4) 23% −7.1 (−14.2; 0.1) 97%
PF Likert
6 weeks −
6.7 (−9.1;−4.4) >99% −2.2 (−4.5; 0.2) 96% −3.2 (−6.2;−0.2) 98% NA NA NA NA NA NA
PF Likert 12 weeks
−7.7 (−10.7;−4.7) >99% −3.8 (−6.9;−0.7) >99% −3.6 (−6.7;−0.5) 99% NA NA NA NA NA NA
PGA VAS
6 weeks −
16.6 (−24.3;−9.0) >99% −7.1 (−15.1; 0.8) 96% −7.0 (−15.3; 1.3) 95% −4.3 (−12.4; 3.8) 85% −5.3 (−13.9; 3.3) 89% NA NA
PGA VAS 12 weeks
−14.1 (−21.4;−6.8) >99% −6.6 (−14.1; 0.9) 96% −4.6 (−12.4; 3.0) 89% −2.4 (−10.0; 5.2) 74% −5.5 (−14.1; 3.1) 90% NA NA
PGA Likert
6 weeks −
0.5 (−0.7;−0.3) >99% −0.2 (−0.4;−0.1) >99% −0.1 (−0.2; 0.1) 76% NA NA NA NA NA NA
PGA Likert 12 weeks
NA NA NA NA NA NA NA NA NA NA NA NA
Scenario 5 (effect sizes)
Diff CFB (95% CrI)
Prob. DCF better
Diff CFB (95% CrI)
Prob. DCF better
Diff CFB (95% CrI)
Prob. DCF better
Diff CFB (95% CrI)
Prob. DCF better
Diff CFB (95% CrI)
Prob. DCF better
Diff CFB (95% CrI)
Prob. DCF better
Pain 6 weeks −0.7 (−0.9;−0.4) >99% −0.3 (−0.5; 0.0) 98% −0.2 (−0.5; 0.1) 92% 0.0 (−0.3; 0.3) 54% −0.1 (−0.4; 0.2) 75% −0.5 (−0.8;−0.1) >99%
Pain 12 weeks −0.5 (−0.7;−0.3) >99% −0.2 (−0.4; 0.0) 98% −0.2 (−0.4; 0.0) 95% −0.1 (−0.3; 0.1) 70% −0.2 (−0.4; 0.1) 94% −0.4 (−0.8; 0.1) 93%
PF 6 weeks −0.5 (−0.6;−0.3) >99% −0.1 (−0.3; 0.1) 87% 0.0 (−0.2; 0.2) 51% 0.0 (−0.2; 0.2) 51% −0.1 (−0.3; 0.1) 83% −0.3 (−0.5; 0.0) 98%
PF 12 weeks −0.4 (−0.9; 0.2) 90% −0.1 (−0.6; 0.5) 60% 0.1 (−0.5; 0.6) 42% 0.0 (−0.5; 0.6) 44% 0.0 (−0.6; 0.5) 55% −0.6 (−1.1; 0.0) 98%
PGA 6 weeks −0.8 (−0.9;−0.6) >99% −0.2 (−0.4;−0.1) >99% −0.3 (−0.5;−0.1) >99% −0.2 (−0.4;−0.1) >99% −0.4 (−0.6;−0.2) >99% NA NA
PGA 12 weeks NA NA NA NA NA NA NA NA NA NA NA NA
Pain VAS, PF VAS, and PGA VAS are in mm. Pain Likert scale runs from 0 to 20, PF Likert scale runs from 0 to 68, and PGA Likert scale runs from 0 to 5. CFB, change from baseline; CrI, credible interval; VAS, visual analogue scale; PF, physical functioning; PGA, patient global assessment; DCF, diclofenac; NA, data not available.
Scenario 4: combining all doses of NSAIDs and COXIBs in OA and RA into a dose range, namely: diclofenac 75 to 150 mg/day, naproxen 500 to 1,000 mg/day, ibuprofen 1,200 to 2,400 mg/day, celecoxib 100 to 400 mg/day, and etoricoxib 30 to 90 mg/day; Scenario 5: combining VAS and Likert scales using effect sizes, as described in theMethodssection.
al.
Arthritis
Research
&
Therapy
(2015) 17:66
Page
12
of
[image:12.794.62.697.76.495.2]Also, the comparison of various benefits and risks was undertaken in a rather homogenous population (arthritis patients) in comparison to previously published meta-analyses of various safety outcomes, which included patients with entirely different underlying conditions, for
example Alzheimer’s disease, adenomatous polyps, and
others [20,21]. This is in line with the benefit and risk evaluation done for underlying disease conditions in clin-ical practice and the fact that treatment decisions are dependent upon the defined patient circumstances.
[image:13.595.56.539.90.579.2]The objective was to assess the efficacy, safety, and toler-ability of diclofenac compared to ibuprofen, naproxen, cel-ecoxib, and etoricoxib in patients with pain caused by OA or RA. The analysis was based on RCTs published in peer-reviewed journals. The relevant studies were obtained by means of an SLR and synthesized using a Bayesian NMA, with 176 studies (146,524 patients) providing efficacy, safety, or tolerability data. High-quality SLRs and NMAs were reviewed to validate the results of the selection process, but no further relevant studies were identified.
Figure 7Forest plots of safety and tolerability outcomes (pooled doses).
Table 3 Relative benefits and risks of diclofenac
Outcome Unit Assessment time point Placebo Celecoxib Naproxen Etoricoxib Ibuprofen Acetaminophen
Benefits Pain (VAS) ΔCFB (mm) 6 weeks −13.5 (−16.7,−10.4) −4.7 (−8.0,−1.4) −3.4 (−7.0, 0.1) −0.1 (−4.3, 4.0) −3.2 (−7.9, 1.5) −9.1 (−13.5,−4.7)
ΔCFB (mm) 12 weeks −12.3 (−17.3,−7.4) −5.1 (−10.2,−0.1) −3.3 (−8.6, 1.8) −3.3 (−9.1, 2.5) −4.5 (−11.5, 2.4) −8.0 (−16.6, 0.5)
Physical functioning (VAS) ΔCFB (mm) 6 weeks −7.7 (−11.9,−3.4) 0.2 (−4.1, 4.6) 2.8 (−1.7, 7.4) 2.4 (−2.4, 7.3) 1.2 (−4.5, 6.9) −5.4 (−12.4, 1.8)
ΔCFB (mm) 12 weeks −4.5 (−12.4, 3.1) 2.3 (−5.7, 10.5) 6.0 (−2.2, 14.1) 5.8 (−2.9, 14.3) 3.3 (−5.9, 12.3) −7.2 (−14.5, 0.3)
PGA VAS ΔCFB (mm) 6 weeks −15.3 (−25.4,−5.2) −5.7 (−16.1, 4.7) −6.3 (−17.1, 4.5) −5.9 (−18.0, 6.0) −3.7 (−14.7, 7.4) NA
Risks APTC Rate ratio Duration of study NA 1.1 (0.7, 1.8) 0.9 (0.4, 2.0) 1.0 (0.9, 1.2) 0.9 (0.5, 1.6) NA
Major CV event Rate ratio Duration of study NA 1.2 (0.8, 1.8) 0.9 (0.4, 1.9) 1.1 (0.9, 1.3) 1.1 (0.7, 1.9) NA
Major GI event Rate ratio Duration of study NA 1.4 (0.8, 2.3) 0.3 (0.2, 0.6) 1.5 (1.3, 1.9) 0.5 (0.3, 0.9) NA
Withdrawal due to any reason Rate ratio Duration of study 0.7 (0.6, 0.8) 1.1 (1.0, 1.3) 1.0 (0.8, 1.2) 1.2 (1.0, 1.5) 0.7 (0.6, 0.9) 0.8 (0.6, 1.0)
Withdrawal due to adverse events Rate ratio Duration of study 1.6 (1.3, 1.9) 1.4 (1.2, 1.8) 1.1 (0.9, 1.4) 1.7 (1.3, 2.2) 0.9 (0.7, 1.2) 0.9 (0.6, 1.4)
Withdrawal due to lack of efficacy Rate ratio Duration of study 0.4 (0.3, 0.4) 0.8 (0.7, 1.0) 0.9 (0.7, 1.1) 0.9 (0.7, 1.1) 0.7 (0.5, 0.9) 0.6 (0.4, 0.8)
Mean and 95% credible intervals are presented; negativeΔCFB and rate ratios <1 favour diclofenac. Benefits were assessed using diclofenac 150 mg/day, naproxen 1,000 mg/day, ibuprofen 2,400 mg/day, celecoxib 200 mg/day, and etoricoxib 60 mg/day. Risks were assessed using dose ranges of the interventions of interest (diclofenac 75 to 200 mg/day, naproxen 500 to 1,500 mg/day, ibuprofen 1,200 to 2,400 mg/day, celecoxib 100 to 800 mg/day, or etoricoxib 30 to 90 mg/day). VAS, visual analogue scale;ΔCFB, difference in change from baseline; PGA, patient global assessment; APTC, Antiplatelets Trialists’Collaboration; CV, cardiovascular; GI, gastrointestinal.
al.
Arthritis
Research
&
Therapy
(2015) 17:66
Page
14
of
The efficacy analysis was based on the labelled doses for treatment of OA and RA for each treatment option. All drugs were significantly better than placebo for all efficacy outcomes. Diclofenac 150 mg/day was likely to be more effective in alleviating pain than celecoxib and ibuprofen (both scales: VAS and Likert), naproxen (VAS), and etoricoxib (VAS 12 weeks). Its efficacy was similar compared to etoricoxib (VAS) and naproxen (Likert) at 6 weeks. Diclofenac 100 mg/day was compar-able to all other interventions for pain relief. For physical functioning, diclofenac 150 mg/day seemed to be similar to celecoxib and ibuprofen on VAS at 6 and 12 weeks and seemed favourable to celecoxib and naproxen on Likert at 6 weeks. Diclofenac 100 mg/day was compar-able to the rest of the treatments for physical function-ing VAS at 6 weeks and Likert at 12 weeks, no other data were available. Although only a small number of studies provided data for PGA, diclofenac was com-parable to all treatments for the outcomes and time points available. Various scenario analyses were in line with the base case and did not change the main findings. The safety analysis was based on pooling of events from data available on all doses identified in the evidence base for each treatment because of the low frequency of observed events. All active treatments demonstrated similar incidence of CV outcomes (APTC and major CV). Diclofenac was associated with a lower incidence of major upper GI events compared to naproxen and ibuprofen, comparable to celecoxib, and higher than etoricoxib.
Risk of withdrawals due to any cause was lower for diclofenac than ibuprofen, similar to naproxen and cele-coxib, and higher than etoricoxib. Patients treated with diclofenac had a similar risk of withdrawals due to an adverse event to ibuprofen and naproxen and higher risk compared to celecoxib and etoricoxib. The risk of withdrawal due to lack of efficacy for diclofenac was lower than ibuprofen and celecoxib and similar to etori-coxib and naproxen.
The results presented in this study are in agreement with the findings of other Bayesian NMAs of RCTs on the efficacy and safety of COXIBs and NSAIDs pub-lished during the last 2 years [20,21,51]. Stamet al. com-pared the efficacy of diclofenac, ibuprofen, naproxen, celecoxib, etoricoxib, and lumiracoxib in OA [51]. Their main findings are in agreement with our results: etori-coxib had a low probability to provide a small improve-ment in pain relief and physical functioning over
diclofenac. For PGA, Stam et al. report similar results
versus placebo for diclofenac and etoricoxib, while our results are in favour of diclofenac [51]. This could be a result of the differences in the evidence base and methods used (for example all time points were pooled together in Stamet al.).
Trelle at al. conducted an NMA on the CV safety of
the five NSAIDs included in our study plus rofecoxib and lumiracoxib [20]. A much broader patient popula-tion (only cancer patients were excluded) and trials with at least 100 pyrs of follow-up per arm were in-cluded, leading to a different evidence base compared to our study. Despite this, a similar CV safety profile was reported for diclofenac compared to etoricoxib for all events (RR close to 1), which was confirmed in our findings for major CV and APTC. For celecoxib and ibuprofen, the APTC results versus diclofenac are in agreement with ours, while it is not easy to compare the rest of the outcomes as the mean RR varies per in-dividual CV event. For naproxen, they report either similar results (MI) versus diclofenac or in favour or naproxen (CV death), while in our analysis a mean RR of 0.9 in favour of diclofenac with wide CrIs (0.4, 1.9) were estimated for the major CV events. This differ-ence could be due to the fact that only an inflammatory arthritis population was included in our study.
The CNT Collaboration conducted a meta-analysis of safety outcomes for six COXIBs (celecoxib, etoricoxib, rofecoxib, valdecoxib, lumiracoxib, and GW403681) compared to traditional NSAIDs, including diclofenac [21]. The analysis was based on aggregated and individ-ual patient data from 754 studies, any of which were small and of short duration. Comparing the (pooled) COXIBs to diclofenac, the RR for major vascular events was 0.97 (95% CI 0.84 to 1.12), which is in line with the results of our analysis. Their results are similar for upper GI complications, with an RR of 0.94 (95% CI 0.72 to 1.24) for all COXIBs pooled together; in our study, diclofenac had a comparable profile to celecoxib and etoricoxib demonstrated a better profile. This disagree-ment could be explained by the difference in the evi-dence base and the pooling of all COXIBs.
review results were cross-checked with the results of the CNT Collaboration study [21].
Another potential limitation is that studies often use dif-ferent methods for handling missing data due to dropouts, including last observation carried forward, baseline obser-vation carried forward, multiple imputation, available data, and others. These differences can lead to differences in re-ported outcomes. However, it has been established that in the absence of a large excess of adverse event withdrawals with active drug over placebo, an imputation method makes little difference [53-56].
Furthermore, a low number of patients or shorter dur-ation can lead to an overestimdur-ation of the treatment ef-fect in pain studies and, particularly in OA, over 20%
overestimation has been reported by Nuesch et al.[57].
Some studies included in this NMA are reporting results for a low number of patients, which may have an impact on the estimation of the outcomes; however, only studies
with ≥4 weeks’ treatment duration were included.
Vari-ous scenario analyses including only studies with more than 100 patients were conducted to validate the results, which were not altered providing additional confidence in the conclusions made.
It could be argued that small changes in pain scales could not be clinically meaningful. However, small aver-age changes on a VAS scale translates into substantial gains in the percentage of people getting good, long-term pain relief. Mooreet al.reported that an average of 10 mm improvement in pain more than placebo equates to almost one in two patients having substantial benefit [58]. In this analysis, diclofenac 150 mg resulted in an average 12.3 mm improvement over placebo at 12 weeks; therefore, a significant proportion of patients would have had benefit. This was further supported by improve-ments observed in other benefit outcomes of physical functioning and PGA. Because individual patient data were not available in the publications reviewed, a limita-tion of our analysis is that it does not report probability of treatments achieving >30% or >50% improvement in pain accepted as clinically meaningful. It is also import-ant to note that general considerations for determining clinically important differences have evolved rather re-cently [59], and the conduct of most of the clinical stud-ies precede this era. Clinically meaningful differences are not uniformly reported or published. However, clinical response to NSAIDs is highly variable and influenced by a number of factors and is not just limited to the efficacy of individual drugs. No meta-analysis or even a clinical trial is an absolute predictor of meaningful clinical re-sponse in the individual patient.
For patients with pain and inflammation, NSAIDs are a recommended treatment option, and it is important to find a balance between known benefits and risks. With good pain relief also come significant improvements in
comorbid symptoms like fatigue and depression and large improvements in HRQoL and work [8]. Other treatment alternatives for pain management also have associated risks, for example acetaminophen is associ-ated with liver toxicity and severe cutaneous reactions [60]. Other treatment alternatives include opioids, which could be highly addictive, for example in a cross-sectional study of chronic pain patients, the prevalence of addiction was 14% [61]. Restrictive use of NSAIDs due to the decade-old debate on associated CV risks has led to a drastic increase in opioid prescriptions drug class use, associated with diversion, abuse, overdose, and even deaths due to respiratory depression [62].
NSAIDs have been the cornerstone in pain manage-ment for decades, and have a favourable benefit-risk pro-file and attributes that distinguish them from other available analgesics, also associated with some risks. Pa-tients might be willing to accept risks associated with NSAID treatment for their pain improvement, including a small increase in the risk of serious events, for example in exchange for 25-mm improvement on the VAS scale in ambulatory pain, OA patients were willing to accept an in-crease of 0.8% points (95% CI 0.4 to 1.4%) in MI risk [63,64]. Risk tolerance is poorly understood and may vary based upon the level of pain, the underlying indication, and the effectiveness and risk associated with a given dose of medication to alleviate painful, debilitating symptoms.
In clinical decision-making, the prescription of treat-ment involves a trade-off between the expected benefit of treatment and the potential of risk based on patient circumstances. Focusing just on associated risks without taking into consideration the benefits that NSAID treat-ment can bring could lead to erroneous conclusions in the holistic benefit-risk assessment for these drugs.
This study provides a benefit-risk assessment for a comparative evaluation of the commonly used NSAIDs that could be used to inform clinical practice.
Conclusions
All NSAIDs were shown to provide clinically meaning-ful pain relief in patients with chronic arthritis and im-prove physical function and well-being. The benefit-risk profile of diclofenac was comparable to other treat-ments used for pain relief in OA and RA. Both benefits and risks vary across treatments and must be taken into consideration while making decisions both by clinicians and by regulators.
Additional files
Additional file 1:Search strategy.
Additional file 2:Input data.
Additional file 4:Study design tables.
Additional file 5:Patient characteristic tables.
Additional file 6:Scenario analyses.
Additional file 7:Additional scenario analyses.
Abbreviations
ΔCFB:differences in change from baseline; APTC: Antiplatelet Trialists’ Collaboration; CFB: change from baseline; CNT: Coxib and Traditional NSAID Trialists’; COXIBs: COX 2 inhibitors; CrI: credible interval; CV: cardiovascular; GI: gastrointestinal; HRQoL: Health Related Quality of Life; ITT: intention-to-treat; MCMC: Markov chain Monte Carlo; MI: myocardial infarction; NMA: network meta-analysis; NSAIDS: nonselective nonsteroidal anti-inflammatory drugs; OA: osteoarthritis; PGA: patient global assessment; PICOS: population, intervention, comparators, outcomes, and study design; pyrs: patient years; RA: rheumatoid arthritis; RCTs: randomised controlled trials; RR: rate ratio; SLR: systematic literature review; tNSAIDs: traditional NSAIDs; VAS: visual analogue scale; WOMAC: Western Ontario and McMaster Universities Arthritis Index.
Competing interests
This study was conducted by Mapi on behalf of Novartis Pharma AG (Basel, Switzerland), who funded the study and the writing of this manuscript. AvW, PG, and AK are employees of Mapi and served as paid consultants to Novartis during the conduct of this study and the preparation of this manuscript. SP and RMN are employees of Novartis. RAM has no competing interests to declare in this work.
Authors’contributions
Mapi independently executed the research work and is accountable for the data quality and accuracy. AvW contributed to the design of the study, conduct of the analysis, interpretation of the results, and drafting of the manuscript. SP contributed to the design of the study, interpretation of the results, and drafting of the manuscript. RN contributed to the design of the study, interpretation of the results, and drafting of the manuscript. PG contributed to the analysis and drafting of the manuscript. AK contributed to the design of the study, conduct of the analysis, interpretation of the results, and drafting of the manuscript. AM contributed to the design of the study, interpretation of the results, and drafting of the manuscript. All authors had access to the extracted data in the study and agree to the conclusions made. All authors read and approved the manuscript.
Acknowledgements
The authors would like to acknowledge Michel Peters (Mapi) for editorial assistance in drafting the manuscript.
Author details
1Mapi, De Molen 84, 3995, AX Houten, The Netherlands.2Novartis Pharma AG, Lichtstrasse 35, CH-4002 Basel, Switzerland.3University of Oxford, Old Road, Headington, OX3 7LE Oxford, UK.
Received: 13 October 2014 Accepted: 13 February 2015
References
1. Sangha O. Epidemiology of rheumatic diseases. Rheumatology (Oxford). 2000;39:3–12.
2. Scott DL, Wolfe F, Huizinga TW. Rheumatoid arthritis. Lancet. 2010;376:1094–108. 3. Bijlsma JW, Berenbaum F, Lafeber FP. Osteoarthritis: an update with
relevance for clinical practice. Lancet. 2011;377:2115–26. 4. Callahan LF. The burden of rheumatoid arthritis: facts and figures.
J Rheumatol Suppl. 1998;53:8–12.
5. Gupta S, Hawker GA, Laporte A, Croxford R, Coyte PC. The economic burden of disabling hip and knee osteoarthritis (OA) from the perspective of individuals living with this condition. Rheumatology (Oxford). 2005;44:1531–7. 6. AAPM facts and figures on pain. [http://www.painmed.org/patientcenter/
facts_on_pain.aspx#incidence]
7. Goldberg DS, McGee SJ. Pain as a global public health priority. BMC Public Health. 2011;11:770.
8. Moore RA, Derry S, Taylor RS, Straube S, Phillips CJ. The costs and consequences of adequately managed chronic non-cancer pain and chronic neuropathic pain. Pain Prac. 2014;14:79–94.
9. Moore RA, Straube S, Aldington D. Pain measures and cut-offs -‘no worse than mild pain’as a simple, universal outcome. Anaesthesia. 2013;68:400–12. 10. Kidd BL, Langford RM, Wodehouse T. Arthritis and pain. Current approaches
in the treatment of arthritic pain. Arthritis Res Ther. 2007;9:214.
11. Zhang WN. OARSI recommendations for the management of hip and knee osteoarthritis. Part III: Changes in evidence following systematic cumulative update of research published through January 2009. Osteoarthritis Cartilage. 2010;18:476–99.
12. Deeks JJ, Smith LA, Bradley MD. Efficacy, tolerability, and upper gastrointestinal safety of celecoxib for treatment of osteoarthritis and rheumatoid arthritis: systematic review of randomised controlled trials. BMJ. 2002;325:619.
13. Pavelka K. A comparison of the therapeutic efficacy of diclofenac in osteoarthritis: a systematic review of randomised controlled trials. Curr Med Res Opin. 2012;28:163–78.
14. Zhang W, Jones A, Doherty M. Does paracetamol (acetaminophen) reduce the pain of osteoarthritis? A meta-analysis of randomised controlled trials. Ann Rheum Dis. 2004;63:901–7.
15. Bjordal JMK. Short-term efficacy of pharmacotherapeutic interventions in osteoarthritic knee pain: a meta-analysis of randomised placebo-controlled trials. Eur J Pain. 2007;11:125–38.
16. Chen YF, Jobanputra P, Barton P, Bryan S, Fry-Smith A, Harris G, et al. Cyclooxygenase-2 selective non-steroidal anti-inflammatory drugs (etodolac, meloxicam, celecoxib, rofecoxib, etoricoxib, valdecoxib and lumiracoxib) for osteoarthritis and rheumatoid arthritis: a systematic review and economic evaluation. Health Technol Assess. 2008;12:1–278. iii.
17. Vioxx and drug safety. [http://www.fda.gov/newsevents/testimony/ ucm113235.htm]
18. European Medicines Agency. sNew safety advice for diclofenac–CMDh endorses PRAC recommendation. 2013. [http://www.ema.europa.eu/ema/ index.jsp?curl=pages/news_and_events/news/2013/06/
news_detail_001830.jsp&mid=WC0b01ac058004d5c1]
19. Salvo F, Fourrier-Reglat A, Bazin F, Robinson P, Riera-Guardia N, Haag M, et al. Cardiovascular and gastrointestinal safety of NSAIDs: a systematic review of meta-analyses of randomized clinical trials. Clin Pharmacol Ther. 2011;89:855–66.
20. Trelle S, Reichenbach S, Wandel S, Hildebrand P, Tschannen B, Villiger PM, et al. Cardiovascular safety of non-steroidal anti-inflammatory drugs: network meta-analysis. BMJ. 2011;342:c7086.
21. Bhala N, Emberson J, Merhi A, Abramson S, Arber N, Baron JA, et al. Vascular and upper gastrointestinal effects of non-steroidal anti-inflammatory drugs: meta-analyses of individual participant data from randomised trials. Lancet. 2013;382:769–79.
22. Benefit-risk methodology. [http://www.ema.europa.eu/ema/ index.jsp?curl=pages/special_topics/document_listing/ document_listing_000314.jsp&mid=WC0b01ac0580223ed6]
23. Caldwell DM, Ades AE, Higgins JP. Simultaneous comparison of multiple treatments: combining direct and indirect evidence. BMJ. 2005;331:897–900. 24. Lu G, Ades AE. Combination of direct and indirect evidence in mixed
treatment comparisons. Stat Med. 2004;23:3105–24.
25. Jansen JP, Fleurence R, Devine B, Itzler R, Barrett A, Hawkins N, et al. Interpreting indirect treatment comparisons and network meta-analysis for health-care decision making: report of the ISPOR Task Force on Indirect Treatment Comparisons Good Research Practices: part 1. Value Health. 2011;14:417–28.
26. Coplan PM, Noel RA, Levitan BS, Ferguson J, Mussen F. Development of a framework for enhancing the transparency, reproducibility and communication of the benefit-risk balance of medicines. Clin Pharmacol Ther. 2011;89:312–5.
27. Levitan BS, Andrews EB, Gilsenan A, Ferguson J, Noel RA, Coplan PM, et al. Application of the BRAT framework to case studies: observations and insights. Clin Pharmacol Ther. 2011;89:217–24.
28. Study design search filters. [http://clinicalevidence.bmj.com/x/set/static/ ebm/learn/665076.html]
29. Borenstein M, Hedges LV, Higgins JPT, Rothstein HR. Converting among effect sizes. In: Introduction to meta-analysis. Chichester, UK: John Wiley & Sons, Ltd; 2009.
30. Jadad AR, Moore RA, Carroll D, Jenkinson C, Reynolds DJ, Gavaghan DJ, et al. Assessing the quality of reports of randomized clinical trials: is blinding necessary? Control Clin Trials. 1996;17:1–12.
31. Spiegelhalter DJ, Best NG, Carlin BP, Van Der Linde A. Bayesian measures of model complexity and fit. J R Stat Soc. 2002;64:583–639.
32. Dias AJSS, Ades AE, Welton NJ. Evidence synthesis for decision making 2: a generalized linear modeling framework for pairwise and network meta-analysis of randomized controlled trials. Med Decis Making. 2013;33:607–17. 33. Bucher HC, Guyatt GH, Griffith LE, Walter SD. The results of direct and
indirect treatment comparisons in meta-analysis of randomized controlled trials. J Clin Epidemiol. 1997;50:683–91.
34. Hoaglin DC, Hawkins N, Jansen JP, Scott DA, Itzler R, Cappelleri JC, et al. Conducting indirect-treatment-comparison and network-meta-analysis studies: report of the ISPOR Task Force on Indirect Treatment Comparisons Good Research Practices: part 2. Value Health. 2011;14:429–37.
35. Flather MD, Farkouh ME, Pogue JM, Yusuf S. Strengths and limitations of meta-analysis: larger studies may be more reliable. Control Clin Trials. 1997;18:568–79. discussion 661–66.
36. Shuster JJ. Fixing the number of events in large comparative trials with low event rates: a binomial approach. Control Clin Trials. 1993;14:198–208. 37. Cope S, Donohue JF, Jansen JP, Kraemer M, Capkun-Niggli G, Baldwin M,
et al. Comparative efficacy of long-acting bronchodilators for COPD: a network meta-analysis. Respir Res. 2013;14:100.
38. Lisse JE. Functional status and health-related quality of life of elderly osteoarthritic patients treated with celecoxib. J Gerontology A Biol Sci Med Sci. 2001;56:M167–75.
39. Datto CHR, Siddiqui MK. Efficacy and tolerability of naproxen/esomeprazole magnesium tablets compared with non-specific NSAIDs and COX-2 inhibitors: a systematic review and network analyses. Open Access Rheumatology. 2013;5:1–19.
40. Wegman A, van der Windt D, van Tulder M, Stalman W, de Vries T. Nonsteroidal antiinflammatory drugs or acetaminophen for osteoarthritis of the hip or knee? A systematic review of evidence and guidelines. J Rheumatol. 2004;31:344–54.
41. Scharf Y, Nahir M, Schapira D, Lorber M, Scharf Y, Nahir M, et al. A comparative study of naproxen with diclofenac sodium in osteoarthrosis of the knees. Rheumatol Rehabil. 1982;21:167–70.
42. Humberto LP, Pena CM. Single-blind parallel study comparing naproxen with sulindac and with diclofenac in rheumatoid arthritis. Current Therapeutic Res Clin Experimen. 1983;34:701–7.
43. Combe BS. Cardiovascular safety and gastrointestinal tolerability of etoricoxib vs diclofenac in a randomized controlled clinical trial (The MEDAL study). Rheumatology. 2009;48:425–32.
44. Sawitzke ADS. Clinical efficacy and safety of glucosamine, chondroitin sulphate, their combination, celecoxib or placebo taken to treat osteoarthritis of the knee: 2-Year results from GAIT. Ann Rheum Dis. 2010;69:1459–64.
45. Krueger KL. Gastrointestinal tolerability of etoricoxib in rheumatoid arthritis patients: Results of the etoricoxib vs diclofenac sodium gastrointestinal tolerability and effectiveness trial (EDGE-II). Ann Rheum Dis. 2008;67:315–22. 46. Cannon CPC. Cardiovascular outcomes with etoricoxib and diclofenac in
patients with osteoarthritis and rheumatoid arthritis in the Multinational Etoricoxib and Diclofenac Arthritis Long-term (MEDAL) programme: a randomised comparison. Lancet. 2006;368:1771–81.
47. Marcolongo R, Giordano N, Bassi GP, Giannini R, Borghi C, Francucci BM, et al. Double-blind preference and compliance multicentre study in osteoarthritis: once-a-day treatment. Clin Rheumatol. 1985;4:267–77. 48. Bhagat K. Effects of non-steroidal anti-inflammatory drugs on hypertension
control using angiotensin converting enzyme inhibitors and thiazide diuretics. East Afr Med J. 2001;78:507–9.
49. Curtis C. A multinational randomized, controlled, clinical trial of etoricoxib inthetreatment of rheumatoid arthritis [ISRCTN25142273]. BMC Fam Pract. 2001;3:1–10.
50. Wiesenhutter CWB. Evaluation of the comparative efficacy of etoricoxib and ibuprofen for treatment of patients with osteoarthritis: a randomized, double-blind, placebo-controlled trial. Mayo Clin Proc. 2005;80:470–9.
51. Stam W, Jansen J, Taylor S. Efficacy of etoricoxib, celecoxib, lumiracoxib, non-selective NSAIDs, and acetaminophen in osteoarthritis: a mixed treatment comparison. Open Rheumat J. 2012;6:6–20.
52. Moore RA, Gavaghan D, Tramer MR, Collins SL, McQuay HJ. Size is everything–large amounts of information are needed to overcome random effects in estimating direction and magnitude of treatment effects. Pain. 1998;78:209–16.
53. Moore RA, Straube S, Eccleston C, Derry S, Aldington D, Wiffen P, et al. Estimate at your peril: imputation methods for patient withdrawal can bias efficacy outcomes in chronic pain trials using responder analyses. Pain. 2012;153:265–8.
54. Moore RA, Straube S, Derry S, McQuay HJ. Chronic low back pain analgesic studies–a methodological minefield. Pain. 2010;149:431–4.
55. Moore RA, Smugar SS, Wang H, Peloso PM, Gammaitoni A. Numbers-needed-to-treat analyses–do timing, dropouts, and outcome matter? Pooled analysis of two randomized, placebo-controlled chronic low back pain trials. Pain. 2010;151:592–7.
56. Moore RA, Cai N, Skljarevski V, Tolle TR. Duloxetine use in chronic painful conditions–individual patient data responder analysis. Eur J Pain. 2014;18:67–75.
57. Nuesch E, Trelle S, Reichenbach S, Rutjes AW, Tschannen B, Altman DG, et al. Small study effects in meta-analyses of osteoarthritis trials: meta-epidemiological study. BMJ. 2010;341:c3515.
58. Moore RA, Moore OA, Derry S, Peloso PM, Gammaitoni AR, Wang H. Responder analysis for pain relief and numbers needed to treat in a meta-analysis of etoricoxib osteoarthritis trials: bridging a gap between clinical trials and clinical practice. Ann Rheum Dis. 2010;69:374–9. 59. Dworkin RH, Turk DC, Wyrwich KW, Beaton D, Cleeland CS, Farrar JT, et al.
Interpreting the clinical importance of treatment outcomes in chronic pain clinical trials: IMMPACT recommendations. J Pain. 2008;9:105–21. 60. Aronson J. Meyler’s side effects of drugs: the international encyclopedia of
adverse drug reactions and interactions. 15th ed. Amsterdam, Boston: Elsevier; 2006.
61. Hojsted J, Ekholm O, Kurita GP, Juel K, Sjogren P. Addictive behaviors related to opioid use for chronic pain: a population-based study. Pain. 2013;154:2677–83.
62. Kurita GP, Sjogren P, Juel K, Hojsted J, Ekholm O. The burden of chronic pain: a cross-sectional survey focussing on diseases, immigration, and opioid use. Pain. 2012;153:2332–8.
63. Hauber AB, Arden NK, Mohamed AF, Johnson FR, Peloso PM, Watson DJ, et al. A discrete-choice experiment of United Kingdom patients’willingness to risk adverse events for improved function and pain control in osteoarthritis. Osteoarthritis Cartilage. 2013;21:289–97.
64. Peters MJ, Symmons DP, McCarey D, Dijkmans BA, Nicola P, Kvien TK, et al. EULAR evidence-based recommendations for cardiovascular risk management in patients with rheumatoid arthritis and other forms of inflammatory arthritis. Ann Rheum Dis. 2010;69:325–31.
Submit your next manuscript to BioMed Central and take full advantage of:
• Convenient online submission
• Thorough peer review
• No space constraints or color figure charges
• Immediate publication on acceptance
• Inclusion in PubMed, CAS, Scopus and Google Scholar
• Research which is freely available for redistribution