R E S E A R C H A R T I C L E
Open Access
Serum metabolomic profiling predicts
synovial gene expression in rheumatoid
arthritis
Rekha Narasimhan
1†, Roxana Coras
1,2†, Sara B. Rosenthal
3, Shannon R. Sweeney
4, Alessia Lodi
4, Stefano Tiziani
4,
David Boyle
1, Arthur Kavanaugh
1†and Monica Guma
1,2*†Abstract
Background:Metabolomics is an emerging field of biomedical research that may offer a better understanding of the mechanisms of underlying conditions including inflammatory arthritis. Perturbations caused by inflamed synovial tissue can lead to correlated changes in concentrations of certain metabolites in the synovium and thereby function as potential biomarkers in blood. Here, we explore the hypothesis of whether characterization of patients’metabolomic profiles in blood, utilizing1H-nuclear magnetic resonance (NMR), predicts synovial marker profiling in rheumatoid arthritis (RA). Methods:Nineteen active, seropositive patients with RA, on concomitant methotrexate, were studied. One of the involved joints was a knee or a wrist appropriate for arthroscopy. A Bruker Avance 700 MHz spectrometer was used to acquire NMR spectra of serum samples. Gene expression in synovial tissue obtained by arthroscopy was analyzed by real-time PCR. Data processing and statistical analysis were performed in Python and SPSS.
Results:Analysis of the relationships between each synovial marker-metabolite pair using linear regression and controlling for age and gender revealed significant clustering within the data. We observed an association of serine/ glycine/phenylalanine metabolism and aminoacyl-tRNA biosynthesis with lymphoid cell gene signature. Alanine/aspartate/glutamate metabolism and choline-derived metabolites correlated with TNF-αsynovial expression. Circulating ketone bodies were associated with gene expression of synovial metalloproteinases. Discriminant analysis identified serum metabolites that classified patients according to their synovial marker levels.
Conclusion:The relationship between serum metabolite profiles and synovial biomarker profiling suggests that NMR may be a promising tool for predicting specific pathogenic pathways in the inflamed synovium of patients with RA.
Keywords:NMR, Metabolomics, Biomarkers, Synovium, Rheumatoid arthritis, Gene expression
Background
The hallmark of rheumatoid arthritis (RA) is chronic synovitis that affects multiple joints and invades cartilage causing bone erosions and joint destruction [1]. As the synovium is the principal target of inflammation in RA, and the resident synoviocytes (fibroblast-like synoviocytes and macrophages-like synoviocytes) along with recruited
cells (myeloid cells and lymphocytes) are implicated in the pathogenesis of synovitis, special interest has been given to the study of synovial tissue in this disease. These studies not only aim to clarify RA pathogenesis and provide insight into the mechanisms of action of therapeutic inter-ventions [1, 2], but are also a promising approach to search for biomarkers in the inflamed synovial tissue [1]. Changes in the cellular infiltrate or biomarkers such as cytokines or growth factors in RA-affected synovial tissue have long been known to be associated with the clinical course of disease and have been used to identify specific responses to RA therapies [1–4]. Recently there has been increasing interest in synovial biopsies to obtain inflamed synovial tissue from joints and thereby gain a better * Correspondence:mguma@ucsd.edu
†Rekha Narasimhan, Roxana Coras, Arthur Kavanaugh and Monica Guma
contributed equally to this work. 1
Division of Rheumatology, University of California, San Diego, 9500 Gilman Drive, San Diego, CA 92093, USA
2Department of Medicine, Autonomous University of Barcelona, Plaça Cívica, 08193 Bellaterra, Barcelona, Spain
Full list of author information is available at the end of the article
understanding of the pathogenic events in these diseases [5]. Histopathotype and pathological pathways-based pa-tient stratification prior to therapeutic intervention could be exploited to identify biomarker predictors of clinical outcomes and responses to therapy [6,7].
Tissue pathology and pathogenic pathways cannot yet be reliably explored through noninvasive circulating or imaging biomarkers. Given the complexity and heteroge-neous nature of RA, it is unlikely that a single cytokine will provide sufficient discrimination between patients and thus be a good biomarker [8, 9]. Global biomarker signatures may represent a more appropriate approach for improving treatment protocols and outcomes for patients with RA. Metabolomics is the science of identifying and quantifying the biochemical byproducts of metabolism in a cell, tissue, or organism [10]. Metabolomics is an emer-ging field of biomedical research that can offer a better understanding of the mechanisms underlying disease and help to develop new strategies for treatment [11]. Unlike genes and proteins, which are epigenetically regulated and post-translationally modified, metabolites are direct signa-tures of biochemical activity and thus it may be easier to test whether they are correlated with phenotype [12].
The fundamental rationale in metabolomics is that perturbations caused by a disease in a biological system will lead to changes that are correlated with the concen-trations of certain metabolites [13, 14]. Metabolite pat-terns represent the final response of biological systems to disease status, or in response to a medical or external intervention [12]. 1H-nuclear magnetic resonance (NMR) can delineate patterns of changes in biomarkers that are highly discriminatory for the observed disease or intervention [15]. We propose in this work, that the study of metabolomics in serum from patients with RA, using NMR, can be used to predict synovial pathology. We hypothesize that perturbations caused by inflamed synovial tissue will lead to changes that correlate with the concentration of certain metabolites in the syno-vium. These changes will then be reflected in blood serum and function as potential biomarkers of different synovial markers. Here we describe the first study that defines metabolite signatures in serum that correlate with gene expression profiling in synovial tissue from patients with active RA.
Methods Patients
The Assessment of rituximab’s immunomodulatory syn-ovial effects (ARISE) clinical trial (registered at Clinical-Trials.gov, NCT00147966) has been described in detail [3]. Briefly, the study enrolled people between 18 and 70 years of age with an established diagnosis of RA and a positive serum test for rheumatoid factor (RF). Patients had to have active disease (defined as a tender joint
count > 8/68, a swollen joint count > 6/66, and either early morning stiffness > 45 min in duration, or an eleva-tion in erythrocyte sedimentaeleva-tion rate (ESR) > 28 mm/h or C-reactive protein (CRP) > 1.5 mg/dL), despite the concomitant use of methotrexate (MTX) at a dose of > 12.5 mg/week for at least 12 weeks. One of the involved joints had to be a knee or a wrist that could be appropri-ately examined by arthroscopy. Concomitant use of non-steroidal anti-inflammatory drugs and oral prednis-one at doses of 10 mg/day or less were permitted, pro-vided dosing was stable for at least 4 weeks before the study. Patients previously treated with tumor necrosis factor (TNF-α) inhibitors were permitted to enroll in the study provided they had been off therapy for > 2 months for etanercept and > 3 months for adalimumab or inflixi-mab. Patients meeting eligibility criteria underwent base-line arthroscopic synovial biopsy of an affected knee or wrist. Nineteen patients for whom both baseline synovial biopsy gene expression data and baseline serum metabo-lomics data were available were analyzed in the current study. Clinical disease parameters, including disease activity score (DAS), health assessment questionnaire (HAQ), pain, joint swelling and tenderness, ESR, RF, and anti-cyclic citrullinated peptide (anti-CCP) are described in Additional file1: Table S1.
Synovial gene expression analysis
Synovial RNA was extracted from pools of six tissue frag-ments and complementary DNA (cDNA) was synthesized. TaqMan PCR was performed using predeveloped reagents (Applied Biosystems, Foster City, CA, USA) as described previously [3]. Gene expression, utilizing quantitative re-verse transcriptase (RT)-PCR, was performed to measure inflammatory mediators and B cell survival factors, includ-ing IgM (heavy chain), IgG (heavy chain), IgKappa (light chain), CD3E, TNF-α, interleukin (IL)-1β, IL-6, IL-8, matrix metalloproteinase (MMP)-1, MMP-3, B lympho-cyte stimulator (BLyS), stromal cell-derived factor 1 (SDF1), and a proliferation-inducing ligand (APRIL). Syn-ovial gene expression for the 19 patients analyzed in this study are summarized in Additional file1: Table S2.
ELISA
TNF-α, MMP3 IL-1β, and IL-6 from serum were evalu-ated by DuoSet enzyme-linked immunosorbent assays following the manufacturer’s protocol (R&D systems).
Metabolomics analysis
used for NMR analysis. An aliquot of 160 μL of filtered serum was mixed with 20μL D2O and 20μL of phosphate
buffer (100 mM final concentration) containing TMSP-d4 (0.1 mM final concentration) and sodium azide (0.05% (w/ v) final concentration). The prepared samples were centri-fuged to remove any remaining particulates and a 180μL aliquot was transferred to a 3 mm NMR tube (Norell, Landisville, NJ, USA) prior to acquisition. NMR spectra were acquired with a 16.4 T (700 MHz) Bruker Avance spectrometer (Bruker BioSpin Corp., Billerica, MA, USA) equipped with a 5 mm TCI cryogenically cooled probe and autosampler at 30 °C. Following acquisition, spectra were processed using NMRlab and MetaboLab [16]. Me-tabolite assignment and quantification was performed using several databases [16]. Metabolite assignment and quantification was performed using Chenomx NMR Suite (Chenomx Inc., Edmonton, AB, Canada), the Birmingham Metabolite Library [17], and the Human Metabolome Database [18]. The NMR results were recently published [19] and are summarized in Additional file1: Table S3 for the 19 patients analyzed in this study.
Data analysis
The data, consisting of 19 patient samples measured across 18 synovial markers and 49 metabolites, were processed using Python. Hierarchically clustered heat-maps were generated for correlation between synovial markers and metabolites separately. Hierarchical cluster-ing and visualization was performed uscluster-ing the scientific computing package SciPy, and the visualization package Seaborn (https://seaborn.pydata.org/). Dendrograms were divided into flat clusters using a cophenetic distance metric. Linear regression was performed between each cytokine-metabolite pair, controlling for patient age and gender using the ordinary least squares (OLS) method from the Python package StatsModels. Normally dis-tributed independent variables were standardized so they had a mean of zero and a standard deviation of one. Discriminant analyses were performed to deter-mine coefficients for linear combinations of variables that assigned cluster membership to individual cases. Basic descriptive statistics used to describe the patient population and discriminant analysis were performed using the SPSS software version 15.0.
Results
Synovial marker and blood metabolite clustering
We first analyzed whether synovial markers clustered into different groups (Fig. 1). IL-6, MMP1, and MMP3 are strongly correlated among themselves but are in-versely correlated with TNF-α, which interestingly, is strongly correlated with CD3E. MMP1 and MMP3 are also inversely correlated with another cluster that in-cludes IL-1β and IL-8. In addition, there was a big
cluster comprising B and plasma cell markers, and growth factors, including SDF1, APRIL, CD138, CD19, CD79A, IgG and IgM heavy chains, and IgKappa.
We also characterized the blood metabolites. As shown in Additional file1: Table S3 and Fig.2a, most of the me-tabolites were downregulated compared to reference values, suggesting that these metabolites might be con-sumed by the inflamed synovium due to an increase in its metabolic demand. A few metabolites were upregulated compared to reference values, including glycolytic metab-olites such as lactate and pyruvate. This likely reflects the increased bioenergetic and biosynthetic demands of sus-tained inflammation. Choline metabolism has recently been strongly related to inflammation [20]. Dietary intake of choline, through two circulating metabolites, trimethy-lamine (TMA) and trimethytrimethy-lamine N-oxide (TMAO), are mechanistically linked to cardiovascular inflammation [20]. Interestingly TMA was also elevated in our patients with RA. In addition, 3-hydroxybutyrate, a ketone body, and select amino acids, such as leucine, threonine, tyrosine, and aspartate were upregulated in patients with active RA. We also analyzed whether blood metabolites could be clustered in groups. Metabolites primarily clus-tered into groups according to their biological function or chemical classification (Fig.2b). As expected, the group of metabolites that were elevated in patients, namely lactate, methylmalonate, xanthine, and 3-hydroxybutyrate, were inversely correlated with the most of metabolites.
Linear regression analysis between grouped synovial markers and metabolites
biomarkers. Metabolite regressionpvalues are displayed in Fig. 3b, where the row and column order are pre-served from Fig.3aand Additional file2: Figure S1.
As observed in Fig.3, metabolites can be grouped into five clusters (Fig.4) that were further analyzed using the MetaboAnalyst [21, 22] web tool for functional enrich-ment of these groups of metabolites. Both pathway significance and pathway impact were assessed using this tool (Additional file3: Figure S2).
We then determined the most strongly correlated or anti-correlated serum metabolites for each synovial marker, using linear regression, and controlling for both age and gender. We also included Benjamini-Hochberg false discovery rate (FDR)-adjusted p values to correct for multiple testing. As shown in Fig. 5, the synovial markers TNF-α and CD3E were negatively correlated with several metabolites in serum. The significant polar metabolites were mapped to known metabolic pathways using MetaboAnalyst 3.0 [22, 23]. and ranked by their overall p values (Fig. 5c). Additional file 4: Figure S3, Additional file5: Figure S4, Additional file 6: Figure S5, and Additional file 7: Figure S6 show correlation be-tween metabolites and the remaining synovial marker clusters.
Discriminant analysis
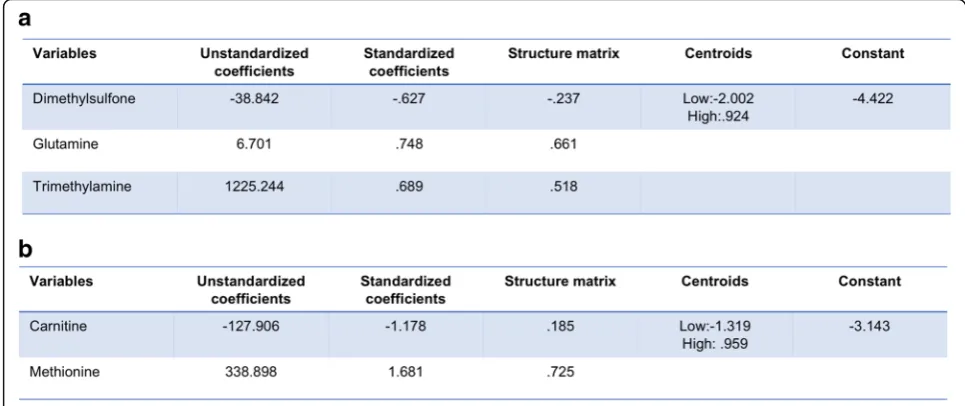
We then explored whether or not one or more metabo-lites in serum could discriminate between high or low levels of synovial marker gene expression. At present, no factors have been identified that fully explain or predict response to RA therapy [24], but pre-treatment differ-ences at baseline between patient groups have been identified, including synovial tissue TNF expression and an increased number of synovial macrophages and T cells in patients who subsequently exhibited clinical im-provement after initiation of anti-TNF therapy [25]. Therefore, we used stepwise discriminant function ana-lyses to discriminate TNF-αor CD3E levels. Multivariate and cross-validation classification using the “ leave-one--out” classification method was used for these calcula-tions. We defined high or low marker levels according to their synovial marker gene expression mean. This stepwise discriminant analysis is presented in Fig.6. For TNF-α discriminant analysis, three metabolites namely glutamine, TMA, and dimethylsulfone were sufficient to correctly classify 94.7% of TNF-α levels. There was ca-nonical correlation of 0.821 and Wilks’lambda of 0.326 when these three variables were used, with high signifi-cance (p < 0.001; Fig. 6a). For CD3E discriminant
[image:4.595.59.537.87.372.2]Fig. 2Blood metabolite clustering.aOverview of the metabolites identified by1H-nuclear magnetic resonance (NMR) organized by metabolic pathway. Metabolites that were elevated by at least 20% compared to reference values are in green and metabolites that were decreased by more than 20% compared to reference values are in red.. Metabolites not identified by NMR are in gray. Abbreviations: TMA, trimethylamine; TMAO, trimethylamine N-oxide; DMA, NN-dimethylamine; THF, tetrahydrofolate; IMP, inosine monophosphate.bHeat map and hierarchical cluster analysis indicate positive relationships between polar metabolites identified by1H-NMR in serum from patients with rheumatoid arthritis before treatment with rituximab. Pearson’s correlation coefficients for each metabolite and hierarchical clustering with Euclidean distance metric are shown
[image:5.595.57.536.88.331.2] [image:5.595.58.544.427.663.2]analysis, two metabolites namely carnitine and methio-nine were sufficient to correctly classify 89.6% of CD3E levels. There was canonical correlation of 0.765 and Wilks’lambda of 0.414 when these three variables were used, with high significance (p< 0.001; Fig.6b).
Discussion
Our increasing understanding of the pathogenesis of RA has transformed the therapeutic options available for people with this disease. The introduction of newer agents and novel treatment strategies has resulted in improved outcomes for patients. However, these successes have raised the bar for the goals of therapy. At present, disease remission, or low disease activity at the very least, has be-come the new goal of treatment for all patients. Therefore, there is still an unmet need in RA. Biomarkers employed
in“personalized” medicine might be useful in an attempt to match a patient with the most appropriate biologic therapy, and thereby optimize outcomes. The accessibility of a biological biomarker is an important factor in this ap-proach [8]. Although sampling inflamed synovial tissue from joints might be critical to gain a better understand-ing of the pathogenic events of inflammatory arthritis, a biomarker that can be obtained in a minimally invasive manner is more attractive, particularly for patients in early stages of the disease, where mostly small joints are in-volved [8]. In this study, we attempt, for the first time, to find serum metabolomics profiles that correlate with syn-ovial marker gene expression.
Recent studies have indicated that metabolic regula-tion and cell signaling are tightly and ubiquitously linked with immune responses. Metabolomics studies that aim
Fig. 4Identified metabolites clusters. Overview of the metabolites identified by1H-nuclear magnetic resonance organized by metabolic pathway
[image:6.595.56.542.85.484.2]to improve biological understanding through the analysis of metabolite profiles of the underlying biological path-ways are certainly relevant and have been successful in other fields, especially oncology. Though the application of metabolomics to RA is still in its infancy, early studies have yielded promising results [19, 26–33]. A small number of metabolomics studies have focused on identi-fying metabolites associated with rheumatic diseases, primarily in the serum for diagnostic purposes [30–32], but none have attempted to predict synovial pathology.
We hypothesized that perturbations caused by inflamed synovial tissue will lead to changes that correlate with the concentrations of certain metabolites in the synovium that will be then reflected in blood serum. A recent publication on a study of metabolic profiling in the synovial tissue re-ported altered glucose and choline metabolism [34]. Both pathways have recently been involved in RA pathogenesis [27, 34, 35]. Choline levels in patients from our cohorts are decreased in blood compared to the normal range;
this, along with an increased uptake in the joints on cho-line C-11 PET scanning in inflammatory arthritis [36] and high expression in fibrocyte-like synoviocytes (FLS) of choline like transporter (CTL)1 (high-affinity) and CTL2 (low-affinity) [37], suggest increased circulating choline uptake and consumption by the inflamed synovium. Glu-cose levels were decreased, and lactate levels increased in serum from our cohort. Glucose is consumed through up-regulation of aerobic glycolysis and when metabolized, gives rise to production of copious amounts of lactate, which must be extruded from the cell to prevent lactic acidosis [38]. Several studies have highlighted the increase in glucose metabolism in the hypoxic joint [27,35]. Thus, our results in serum seem to agree well with recently de-scribed synovial studies [34]. Of interest, both choline and glucose levels in the blood negatively correlated with TNF-αand CD3E gene expression in the synovium.
Literature in the field of oncology can help us to inter-pret some of our results. For instance, we observed an
Fig. 5Correlation between serum metabolites and synovial TNF-αand CD3E.aCorrelation between serum metabolites and each synovial marker, using linear regression, controlling for both age and gender. We also includedpvalues adjusted for Benjamini-Hochberg false discovery rate (fdr_bh) to correct for multiple testing.bOverview of the metabolites identified by1H-nuclear magnetic resonance organized by metabolic
[image:7.595.56.540.89.425.2]association of serine/glycine metabolism and aminoacyl-tRNA biosynthesis with TNF-α/CD3E and B/plasma cell signatures that suggest that lymphoid cells could be using these pathways after activation in the rheumatoid synovium. Although alterations in glucose and glutamine metabolism are central to metabolic transformation, re-cent studies have focused on the role of the nonessential amino acids serine and glycine in supporting tumor growth [39]. In addition to their role in protein synthe-sis, serine and glycine contribute to anabolic pathways important for the generation of glutathione, nucleotides, phospholipids, and other metabolites [40]. The require-ment for intracellular serine and glycine for the support of cell growth and proliferation is clear. Other amino acids are also critical substrates that fuel mitochondrial metabolism and the biosynthesis of proteins, lipids, and other molecules. Of particular interest in cancer are key mitochondrial enzymes in the metabolism of glutamine, glutamate, proline, aspartate, and alanine [41]. The branched chain amino acids (BCAAs) valine, leucine, and isoleucine are also highly metabolized by transami-nases. By coordinating cellular bioenergetics and biosyn-thesis through the tricarboxylic acid (TCA) cycle, amino acid metabolism could be critical not only in tumor cells but also in lymphoid cell proliferation and survival as described recently [42].
Another metabolite that correlates with several of our cytokine pathways is succinate. Succinate is an inter-mediate of the TCA cycle and plays a crucial role in ad-enosine triphosphate (ATP) generation in mitochondria. Recently, new roles for succinate outside metabolism have emerged. Succinate promotes expression of the pro-inflammatory cytokine IL-1β by inhibiting prolyl
hydroxylases and stabilizing the transcription factor hypoxia-inducible factor-1α (HIF-1α) in activated macrophages, and stimulates dendritic cells via succinate receptor 1 [38, 43]. Furthermore, succinate has been shown to post-translationally modify proteins. Of inter-est, the succinate level in blood positively associated with synovial IL-1β gene expression although it did not reach statistical significance.
The cluster comprising MMP1/MMP3/IL-6, which could represent a fibroblast-driven phenotype, was negatively correlated with ketone bodies. Acetoacetate is the common precursor of the two other circulating ketone bodies, acet-one and 3-hydroxybutyrate [44]. 3-hydroxybutyrate is the most abundant circulating ketone body and is less likely to degrade spontaneously into acetone than acetoacetate. One can speculate that rheumatoid fibroblasts require intracellu-lar ketone bodies for the support of their invasive pheno-type and that the increase in 3-hydroxybutyrate uptake and/or enzymes in this pathway could explain the negative correlation. Of note, the positive correlation between 3-hydroxybutyrate and IL-1βand IL-8 is also of interest, as 3-hydroxybutyrate, long viewed as a simple carrier of energy from the liver to peripheral tissues, also possesses signaling activities and is also an endogenous inhibitor of histone deacetylases (HDACs) [45]. Moreover, recent research has shown that 3-hydroxybutyrate can block the NOD-like receptor pyrin containing 3 (NLRP3) inflamma-some [46]. Further studies are needed to understand the effect of these metabolites in the synovium in RA.
As mentioned above, metabolites can not only be biomarkers of perturbations caused by inflamed synovial tissue but also can have a pathogenic effect that would amp-lify synovial inflammation. Secondary roles have emerged
[image:8.595.55.538.89.292.2]for glucose metabolites, metabolic enzymes, and TCA cycle intermediates outside of metabolism. Not only succinate but also other metabolites including α-ketoglutarate, fu-marate, and acetyl-CoA might be expected to accumulate in macrophages and FLS under hypoxic conditions, and are involved in eliciting important epigenetic changes, with unexplored potential for driving chronic inflamma-tion [47,48]. Also, essential glycolytic enzymes have been shown to translocate to the nucleus or mitochondria where they function independently of their canonical metabolic roles in the regulation of cytokines and anti-apoptotic responses [49, 50]. Thus, metabolomics studies have also the potential of defining the elements of synovial metabolic pathobiology.
Although NMR spectroscopy has less sensitivity com-pared to mass spectrometry instrumentation, NMR re-quires minimal sample preparation, and is not only non-destructive, inherently untargeted, highly reprodu-cible [51, 52], and intrinsically quantitative, but is also cheaper and more accessible than mass spectrometry [53–55]. Depending on the biological samples, NMR can identify and quantify more than 200 metabolites in an untargeted fashion and more than 100 metabolites are uniquely identified by NMR [56]. In this work, we also showed that the combination of only two or three me-tabolites identified in serum by NMR could discriminate between high or low levels of synovial TNF-αand CD3E gene expression. Studies in other cohorts of patients with active RA are needed to validate these results, yet the relationship between serum metabolic profiles and synovial biomarker profiling suggests that NMR may be a promising tool for predicting specific pathogenic path-ways in the inflamed synovium in RA.
Although these findings are certainly promising, this study is not without limitations. Most importantly, we evaluated a small number of clinical samples. Despite similar clinical parameters for patient inclusion, large biological variance is expected in primary samples. In addition, patients had long-standing disease and were exposed to various therapies prior to the study, and were on methotrexate at the time of the study, which is re-ported to change several metabolic pathways including adenosine metabolism [57]. Confirmation of our results in a larger sample size from a cohort of patients with new onset inflammatory arthritis before treatment initi-ation, studied prospectively, is necessary to strengthen our conclusions. Comparison with other arthritides or other systemic inflammatory diseases to determine if these changes in metabolite levels come from the joints or from different sources is also critical to interpret our results. One other confounder is the microbiome, which is altered in RA and can potentially cause metabolic changes in both serum and synovial tissues [58–60]. In addition, further studies are needed to evaluate the
relationship between circulating metabolites and syn-ovial pathology. Metabolite profiles in blood, if they cor-relate with metabolic changes in synovial tissue, will certainly reveal more about RA etiology. We did not identify correlation between cytokine serum levels and cytokine synovial gene expression (Additional file 8: Figure S7), yet it remains unknown whether or not metabolic changes will display stronger correlation be-tween blood and synovium.
Conclusions
The relationship between serum metabolite profiles and synovial biomarker profiling suggests that NMR may be a promising tool for predicting specific pathogenic pathways in the inflamed synovium of patients with RA. Further studies will help to better test the correlation and under-stand the metabolic profiles between cytokine and cell sig-natures, and address whether or not NMR metabolomics can be used to stratify patients with RA by predicting spe-cific cellular infiltrates or other synovial biomarkers, and to identify specific responses to RA therapies.
Additional files
Additional file 1:Table S1.Baseline clinical characteristics of patients
with rheumatoid arthritis.Table S2.Mean and standard deviation (SD) of synovial biomarker expression.Table S3.Mean and standard deviation (SD) of serum metabolites detected by1H-NMR (μM). Reference values are from
the Human Metabolome Database (HMDB) and were collected via NMR, unless otherwise noted.1GC/MS;2HPLC;3HPLC-fluoroescence;4
ion-exchange chromatography;5DFI/MS/MS6unknown. ND, no data available.
Metabolites that were upregulated by at least 20% compared to reference values are in green. Metabolites that were downregulated by more than 20% compared to reference values are in red. (DOCX 26 kb)
Additional file 2:Figure S1.Correlation between synovial markers and
serum metabolites. (TIFF 14826 kb)
Additional file 3:Figure S2.Pathway analysis of polar compounds by
MetaboAnalyst. (TIFF 14826 kb)
Additional file 4:Figure S3.Correlation between serum metabolites
and synovial CD19, CD79A, and IgGHC. (TIFF 14826 kb)
Additional file 5:Figure S4.Correlation between serum metabolites
and synovial APRIL, CD138, SDF1, IgKappa, and IgMHC. (TIFF 14826 kb)
Additional file 6:Figure S5.Correlation between serum metabolites
and synovial MMP1, MMP3, and IL-6. (TIFF 14826 kb)
Additional file 7:Figure S6.Correlation between serum metabolites
and synovial IL-1βand IL-8. (TIFF 14826 kb)
Additional file 8:Figure S7.Correlation between serum cytokines and
synovial cytokines and serum metabolites. (TIFF 14826 kb)
Abbreviations
APRIL:A proliferation-inducing ligand; ARISE: Assessment of rituximab’s immunomodulatory synovial effects; ATP: Adenosine triphosphate; BLySB: Lymphocyte stimulator; CRP: C-reactive protein; CTL: Choline like transporter; DAS: Disease activity score; FLS: Fibroblast-like synoviocytes; HAQ: Health assessment questionnaire; HIF-1α: Hypoxia-inducible factor-1α; IL-1β: Interleukin; MMP: Matrix metalloproteinase; MTX: Methotrexate; NMR:1H-nuclear magnetic resonance; RA: Rheumatoid arthritis; RF: Rheumatoid
Funding
This work was supported by grants from the National Institutes of Arthritis and Musculoskeletal and Skin (to MG, 1K08AR064834 and R03AR068094), and the Spanish Society of Rheumatology to RC.
Availability of data and materials
All data generated or analyzed during this study are included in this published article.
Authors’contributions
MG designed and supervised the overall project. DB and AK designed and conducted the ARISE trial. RN, RC, AK, SBR, and MG analyzed the data. ST, AL, and SS acquired and analyzed NMR data. SBR, AK, and MG wrote the manuscript. All authors read and approve the final manuscript.
Ethics approval and consent to participate
Patients were enrolled in the ARISE clinical trial following written informed consent. Ethical approval was granted by the Institutional Review Board (IRB) at UCSD.
Consent for publication N/A
Competing interests
The authors declare that thet have no competing interest.
Publisher’s Note
Springer Nature remains neutral with regard to jurisdictional claims in published maps and institutional affiliations.
Author details
1
Division of Rheumatology, University of California, San Diego, 9500 Gilman Drive, San Diego, CA 92093, USA.2Department of Medicine, Autonomous University of Barcelona, Plaça Cívica, 08193 Bellaterra, Barcelona, Spain. 3Center for Computational Biology and Bioinformatics, University of California, San Diego, 9500 Gilman Drive, San Diego, CA 92093, USA. 4Department of Nutritional Sciences & Dell Pediatric Research Institute, Dell Medical School, University of Texas at Austin, 1400 Barbara Jordan Blvd, Austin, TX, USA.
Received: 19 February 2018 Accepted: 29 June 2018
References
1. Orr C, Vieira-Sousa E, Boyle DL, Buch MH, Buckley CD, Canete JD, et al. Synovial tissue research: a state-of-the-art review. Nat Rev Rheumatol. 2017;13(8):463–75.
2. Vieira-Sousa E, Gerlag DM, Tak PP. Synovial tissue response to treatment in rheumatoid arthritis. Open Rheumatol J. 2011;5:115–22.
3. Kavanaugh A, Rosengren S, Lee SJ, Hammaker D, Firestein GS, Kalunian K, et al. Assessment of rituximab's immunomodulatory synovial effects (ARISE trial). 1: clinical and synovial biomarker results. Ann Rheum Dis. 2008;67(3):402–8. 4. Dennis G Jr, Holweg CT, Kummerfeld SK, Choy DF, Setiadi AF, Hackney JA,
et al. Synovial phenotypes in rheumatoid arthritis correlate with response to biologic therapeutics. Arthritis Res Ther. 2014;16(2):R90.
5. Kelly S, Humby F, Filer A, Ng N, Di Cicco M, Hands RE, et al. Ultrasound-guided synovial biopsy: a safe, well-tolerated and reliable technique for obtaining high-quality synovial tissue from both large and small joints in early arthritis patients. Ann Rheum Dis. 2015;74(3):611–7.
6. Astorri E, Nerviani A, Bombardieri M, Pitzalis C. Towards a stratified targeted approach with biologic treatments in rheumatoid arthritis: role of synovial pathobiology. Curr Pharm Des. 2015;21(17):2216–24.
7. Pitzalis C, Kelly S, Humby F. New learnings on the pathophysiology of RA from synovial biopsies. Curr Opin Rheumatol. 2013;25(3):334–44. 8. Burska A, Boissinot M, Ponchel F. Cytokines as biomarkers in rheumatoid
arthritis. Mediat Inflamm. 2014;2014:545493.
9. Burska AN, Roget K, Blits M, Soto Gomez L, van de Loo F, Hazelwood LD, et al. Gene expression analysis in RA: towards personalized medicine. Pharmacogenomics J. 2014;14(2):93–106.
10. Eckhart AD, Beebe K, Milburn M. Metabolomics as a key integrator for “omic”advancement of personalized medicine and future therapies. Clin Transl Sci. 2012;5(3):285–8.
11. Patti GJ, Yanes O, Siuzdak G. Innovation: metabolomics: the apogee of the omics trilogy. Nat Rev Mol Cell Biol. 2012;13(4):263–9.
12. Semerano L, Romeo PH, Boissier MC. Metabolomics for rheumatic diseases: has the time come? Ann Rheum Dis. 2015;74(7):1325–6.
13. Patti GJ, Tautenhahn R, Rinehart D, Cho K, Shriver LP, Manchester M, et al. A view from above: cloud plots to visualize global metabolomic data. Anal Chem. 2013;85(2):798–804.
14. Patti GJ, Yanes O, Shriver LP, Courade JP, Tautenhahn R, Manchester M, et al. Metabolomics implicates altered sphingolipids in chronic pain of neuropathic origin. Nat Chem Biol. 2012;8(3):232–4.
15. Priori R, Scrivo R, Brandt J, Valerio M, Casadei L, Valesini G, et al. Metabolomics in rheumatic diseases: the potential of an emerging methodology for improved patient diagnosis, prognosis, and treatment efficacy. Autoimmun Rev. 2013;12(10):1022–30.
16. Ludwig C, Gunther UL. MetaboLab–advanced NMR data processing and analysis for metabolomics. BMC Bioinformatics. 2011;12:366.
17. Ludwig CEJ, Lodi A, Tiziani S, Manzoor SE, et al. Birmingham metabolite library: a publicly accessible database of 1-D H-1 and 2-D H-1 J-resolved NMR spectra of authentic metabolite standards (BML-NMR). Metabolomics. 2012;8:8–18. 18. Wishart DS, Tzur D, Knox C, Eisner R, Guo AC, Young N, et al. HMDB: the
human metabolome database. Nucleic Acids Res. 2007;35(Database):D521–6. 19. Sweeney SR, Kavanaugh A, Lodi A, Wang B, Boyle D, Tiziani S, et al.
Metabolomic profiling predicts outcome of rituximab therapy in rheumatoid arthritis. RMD Open. 2016;2(2):e000289.
20. Smallwood T, Allayee H, Bennett BJ. Choline metabolites: gene by diet interactions. Curr Opin Lipidol. 2016;27(1):33–9.
21. Xia J, Wishart DS. Using MetaboAnalyst 3.0 for comprehensive
metabolomics data analysis. Curr Protoc Bioinformatics. 2016;55:14. 0 1–0 91 22. Xia J, Psychogios N, Young N, Wishart DS. MetaboAnalyst: a web server for
metabolomic data analysis and interpretation. Nucleic Acids Res. 2009; 37(Web Server issue):W652–60.
23. Xia J, Mandal R, Sinelnikov IV, Broadhurst D, Wishart DS. MetaboAnalyst 2.0– a comprehensive server for metabolomic data analysis. Nucleic Acids Res. 2012;40(Web Server issue):W127–33.
24. Wijbrandts CA, Tak PP. Prediction of response to targeted treatment in rheumatoid arthritis. Mayo Clin Proc. 2017;92(7):1129–43.
25. Wijbrandts CA, Dijkgraaf MG, Kraan MC, Vinkenoog M, Smeets TJ, Dinant H, et al. The clinical response to infliximab in rheumatoid arthritis is in part dependent on pretreatment tumour necrosis factor alpha expression in the synovium. Ann Rheum Dis. 2008;67(8):1139–44.
26. Kapoor SR, Filer A, Fitzpatrick MA, Fisher BA, Taylor PC, Buckley CD, et al. Metabolic profiling predicts response to anti-tumor necrosis factor alpha therapy in patients with rheumatoid arthritis. Arthritis Rheum. 2013;65(6):1448–56. 27. Garcia-Carbonell R, Divakaruni AS, Lodi A, Vicente-Suarez I, Saha A,
Cheroutre H, et al. Critical role of glucose metabolism in rheumatoid arthritis fibroblast-like synoviocytes. Arthritis Rheumatol. 2016;68(7):1614–26. 28. Guma M, Sanchez-Lopez E, Lodi A, Garcia-Carbonell R, Tiziani S, Karin M, et
al. Choline kinase inhibition in rheumatoid arthritis. Ann Rheum Dis. 2015; 74(7):1399–407.
29. Hugle T, Kovacs H, Heijnen IA, Daikeler T, Baisch U, Hicks JM, et al. Synovial fluid metabolomics in different forms of arthritis assessed by nuclear magnetic resonance spectroscopy. Clin Exp Rheumatol. 2012;30(2):240–5. 30. Kim S, Hwang J, Xuan J, Jung YH, Cha HS, Kim KH. Global metabolite
profiling of synovial fluid for the specific diagnosis of rheumatoid arthritis from other inflammatory arthritis. PLoS One. 2014;9(6):e97501.
31. Kosinska MK, Liebisch G, Lochnit G, Wilhelm J, Klein H, Kaesser U, et al. Sphingolipids in human synovial fluid–a lipidomic study. PLoS One. 2014;9(3):e91769.
32. Madsen RK, Lundstedt T, Gabrielsson J, Sennbro CJ, Alenius GM, Moritz T, et al. Diagnostic properties of metabolic perturbations in rheumatoid arthritis. Arthritis Res Ther. 2011;13(1):R19.
33. Guma M, Tiziani S, Firestein GS. Metabolomics in rheumatic diseases: desperately seeking biomarkers. Nat Rev Rheumatol. 2016;12(5):269–81. 34. Volchenkov R, Dung Cao M, Elgstoen KB, Goll GL, Eikvar K, Bjorneboe
O, et al. Metabolic profiling of synovial tissue shows altered glucose and choline metabolism in rheumatoid arthritis samples. Scand J Rheumatol. 2017;46(2):160–1.
bioenergetics: a key regulator of joint inflammation. Annals of the rheumatic diseases. 2016;75(12):2192-200.
36. Roivainen A, Parkkola R, Yli-Kerttula T, Lehikoinen P, Viljanen T, Mottonen T, et al. Use of positron emission tomography with methyl-11C-choline and 2-18F-fluoro-2-deoxy-D-glucose in comparison with magnetic resonance imaging for the assessment of inflammatory proliferation of synovium. Arthritis Rheum. 2003;48(11):3077–84.
37. Beckmann J, Schubert J, Morhenn HG, Grau V, Schnettler R, Lips KS. Expression of choline and acetylcholine transporters in synovial tissue and cartilage of patients with rheumatoid arthritis and osteoarthritis. Cell Tissue Res. 2015;359(2):465–77.
38. Corcoran SE, O’Neill LA. HIF1alpha and metabolic reprogramming in inflammation. J Clin Invest. 2016;126(10):3699–707.
39. Amelio I, Cutruzzola F, Antonov A, Agostini M, Melino G. Serine and glycine metabolism in cancer. Trends Biochem Sci. 2014;39(4):191–8.
40. Labuschagne CF, van den Broek NJ, Mackay GM, Vousden KH, Maddocks OD. Serine, but not glycine, supports one-carbon metabolism and proliferation of cancer cells. Cell Rep. 2014;7(4):1248–58.
41. Ahn CS, Metallo CM. Mitochondria as biosynthetic factories for cancer proliferation. Cancer Metab. 2015;3(1):1.
42. Ma EH, Bantug G, Griss T, Condotta S, Johnson RM, Samborska B, et al. Serine is an essential metabolite for effector T cell expansion. Cell Metab. 2017;25(2):345–57.
43. Mills EL, Kelly B, O'Neill LAJ. Mitochondria are the powerhouses of immunity. Nat Immunol. 2017;18(5):488–98.
44. Newman JC, Verdin E. Ketone bodies as signaling metabolites. Trends Endocrinol Metab. 2014;25(1):42–52.
45. Shimazu T, Hirschey MD, Newman J, He W, Shirakawa K, Le Moan N, et al. Suppression of oxidative stress by beta-hydroxybutyrate, an endogenous histone deacetylase inhibitor. Science. 2013;339(6116):211–4.
46. Youm YH, Nguyen KY, Grant RW, Goldberg EL, Bodogai M, Kim D, et al. The ketone metabolite beta-hydroxybutyrate blocks NLRP3 inflammasome-mediated inflammatory disease. Nat Med. 2015;21(3):263–9. 47. Li Y, Zheng JY, Liu JQ, Yang J, Liu Y, Wang C, et al. Succinate/NLRP3
Inflammasome induces synovial fibroblast activation: therapeutical effects of clematichinenoside AR on arthritis. Front Immunol. 2016;7:532.
48. Mills E, O’Neill LA. Succinate: a metabolic signal in inflammation. Trends Cell Biol. 2014;24(5):313–20.
49. Chang CH, Curtis JD, Maggi LB Jr, Faubert B, Villarino AV, O'Sullivan D, et al. Posttranscriptional control of T cell effector function by aerobic glycolysis. Cell. 2013;153(6):1239–51.
50. Yu X, Li S. Non-metabolic functions of glycolytic enzymes in tumorigenesis. Oncogene. 2017;36(19):2629.
51. Dumas M-E, Maibaum EC, Teague C, Ueshima H, Zhou B, Lindon JC, et al. Assessment of analytical reproducibility of 1H NMR spectroscopy based metabonomics for large-scale epidemiological research: the INTERMAP study. Anal Chem. 2006;78(7):2199–208.
52. Viant MR, Bearden DW, Bundy JG, Burton IW, Collette TW, Ekman DR, et al. International NMR-based environmental metabolomics intercomparison exercise. Environ Sci Technol. 2008;43(1):219–25.
53. Zhang S, Nagana Gowda GA, Ye T, Raftery D. Advances in NMR-based biofluid analysis and metabolite profiling. Analyst. 2010;135(7):1490–8. 54. Wishart DS. Quantitative metabolomics using NMR. TrAC Trends Anal Chem.
2008;27(3):228–37.
55. Whitfield PD, German AJ, Noble PJM. Metabolomics: an emerging post-genomic tool for nutrition. Br J Nutr. 2004;92(4):549–55.
56. Bouatra S, Aziat F, Mandal R, Guo AC, Wilson MR, Knox C, et al. The human urine metabolome. PLoS One. 2013;8(9):e73076.
57. Brown PM, Pratt AG, Isaacs JD. Mechanism of action of methotrexate in rheumatoid arthritis, and the search for biomarkers. Nat Rev Rheumatol. 2016;12(12):731–42.
58. Jubair WK, Hendrickson JD, Severs EL, Schulz HM, Adhikari S, Ir D, et al. Modulation of inflammatory arthritis by gut microbiota through mucosal inflammation and autoantibody generation. Arthritis Rheumatol. 2018. 59. Maeda Y, Kurakawa T, Umemoto E, Motooka D, Ito Y, Gotoh K, et al.
Dysbiosis contributes to arthritis development via activation of autoreactive T cells in the intestine. Arthritis Rheumatol. 2016;68(11):2646–61. 60. Scher JU, Abramson SB. The microbiome and rheumatoid arthritis. Nat Rev


![catena Poly[[trimethyltin(IV)] μ 2 p tolylacetato κ2O:O′]](data:image/gif;base64,R0lGODlhAQABAIAAAP///wAAACH5BAEAAAAALAAAAAABAAEAAAICRAEAOw==)