Munich Personal RePEc Archive
Education for all is central to Higher
Education Reforms in Developing
Countries
Mamoon, Dawood
NUFFIC
2005
Online at
https://mpra.ub.uni-muenchen.de/2696/
Education for all is central to successful Higher Education Reforms in Developing Countries1
(DAWOOD MAMOON)2
Abstract:
A successful higher education reform in the South is not limited to improvement in quality and access to higher education but it should directly and indirectly cater to the millennium development goals by ensuring pro poor pro growth outcomes. Once we link higher education reforms with a development agenda or strictly speaking millennium development goals, the reform process in higher education becomes much more than a mere pro growth strategy. The purpose of this paper is to identify ways in which the reform process in higher education is aligned with the larger development agenda of the South. To this effect, we discuss the issue that lie in the peripheries of higher education reform debate- which is to directly link up higher education policy to overall education policy formulation in the South. In the paper, we highlight that generally governments in the South promote higher education at the cost of primary education, and thus indirectly undermine the effectiveness of their development strategies. We have empirically analyzed the effects of higher education focus on economic welfare. As per decomposition, poverty can be either affected by economic growth or unequal distribution of income. In order to investigate whether higher education, as it prevails in the South, is good for the poor, we see the relationship of average years of higher schooling at age of 25 with economic growth and inequality. The paper undertakes regression analysis by utilizing 5 different proxies of economic growth/ economic development and 4 proxies for income inequality as basis for 14 separate IV regression models. Average years of higher schooling have been used as the common regressor. Our results do suggest that higher education is a significant determinant of economic development. However, our inequality regression models suggest that education policies in general and higher education policies in specific do not cater for the lowest income groups in the South and if anything higher education favors the more affluent. The study recommends that higher education policies should not be implemented in isolation with over all education policy frameworks. As a first step to this effect the paper calls for more coordination between higher education commissions and education ministries in the South.
1. Introduction:
Generally in most developing countries human capital is unevenly distributed (Ravallion, 2003). Thomas, Wang and Fan (2000) and Domenech and Castello (2002) have found out that Gini coefficient of distribution of human capital in Sub Saharan Africa and South Asia respectively, is the highest in the world. Berthelemy (2004) came up with the same conclusion not only for Sub Saharan Africa and South Asia but also for Middle East and North Africa (MENA). Further more, according to him, the unequal distribution of income in these regions are due to inequitable education policies of their respective governments who, on average, focus more attention on secondary and tertiary education compared to primary education. Chowdhury (1994)
1
Paper presented at the International Expert Meeting ‘Formula that Work: Making Higher Education Support More effective’; The Hague, The Netherlands, 23-24, May 2005
2
also suggests that there is misallocation of resources by the governments of
developing countries that favor higher education to the neglect of primary education.
In many countries a considerable proportion of public expenditures for education goes to middle- and upper-income families, because richer groups are over-represented at all levels of education, and particularly at the university level. Public expenditure per student increases by each level of education. In African countries, public expenditure per student on higher education is 28 (Francophone Africa) and 50 (Anglophone Africa) times that on primary education. Further, only a small number of people benefits from high public expenditure per student in higher education. For the developing countries as a whole, only 7 % of the school-age population enroll in higher education (Mingat and Tan 1985).
One reason for the bias in education policies in these developing countries towards higher education may lie in the belief that elementary education has a very limited direct role in determining growth rates. According to Barro (1999) the rate of economic growth responds more to secondary or higher education levels rather than elementary schooling. For example, in developing countries international trade, which is one of the key determinants of growth, favours either highly qualified university graduates or those who have at least finished their high school. So it is no surprise that in order to run the race to be competitive, many developing countries have a tendency to invest in higher education at the cost of primary education to achieve greater growth.
2. Unequal Education Policies lead to Unequal Outcomes:
Figure 1a and 1b (appendix 2) show that large inequalities in education attainment exist in Latin America, and there is an increase over time in educational inequalities as average years of educational attainment were more unequally distributed among the poorest and the richest in 1990s when compared to 1980s. Coincidently, Latin America has a Gini coefficient (about 0.50 for the region as a whole) which is approximately 15 points above the average for the rest of the world. Londoño and Székely (1997) estimate that the low level of education of Latin American workers and the enormous inequality in educational assets account for the largest portion of the region's excessive inequality, larger than other contributing factors -- lower physical capital accumulation, the relative abundance of natural resources, and a high concentration of land resources. In Latin America, only a relatively small proportion of the total population has completed secondary or higher education. These relatively few skilled workers earn a substantial wage premium due to their limited supply. Thus a poor distribution of education contributes to differentials in the returns to different levels of education, magnifying the effect of education gaps on income inequality.
inequality in the region. In short, though the supply of better-educated workers increased, it failed to keep pace with the increase in demand as technological change took place as the region opened up.
Figure 2: Real Wage Growth for Skilled and Unskilled Labor in Latin America
Source: E. Lora and G. Marquez. 1998. "The Employment Problem in Latin America: Perceptions and Stylized Facts?" citing Birdsall (1999)
In order to show how income inequalities increase with education inequality Gregorio and Lee (1999) worked with a traditional model of human capital where the level of earnings (Y) is accrued by an individual with S years of schooling:
∑
=
+ + +
= s
j
j o
s Y r u
Y
1
) 1 log( log
log ………(1)
where is the rate of return to the jth year of schooling. The function can be approximated by:
j
r
. log
logYs = Yo +rS +u ……….(2)
Whereas the distribution of earnings can be written as:
). , ( 2
) ( )
( )
( )
(logY Var rS r2Var S S2Var r rSCov r S
Var s = = + + ……….(3)
However, equation (3) also suggests that if the covariance between the return to education and the level of education is negative, an increase in schooling can reduce wage inequality. There is some empirical evidence that there is a negative relationship between the return to education and average years of schooling (Teulings and van Rens, 2001). The negative value of Cov (r, S) suggest that as the relative supply of highly skilled workers go up and that of unskilled workers go down, the relative wages of skilled labour decreases. Though Cov(r, S) gives some useful information regarding wage inequality, the information is far from perfect and can very well be misleading because movements in relative wages are as much a function of skilled labour demand as it is of skilled labour supply. For example, through trade liberalization, there is a transfer of technology in developing countries which increases the demand for skilled labour as learning by doing takes place. If this increased demand for skilled labour is more than its supply then the wages of skilled labour will rise. And if the wages of unskilled labour fail to rise because unskilled labour is in excess supply in developing countries, wage inequality is likely to increase, despite the negative relationship between the level of schooling and returns to education Cov (r, S). This fact is recognized by Dur and Tuelings (2002) when they admitted that in the Tinbergen’s (1975) famous race between technology (skilled labour demand) and education (skilled labour supply), technology has been a clear winner in recent times. So in developing countries the key to equality in relative wages may not lie so much in Cov (r, S), but in the value of Var(S).
3. Relationship between Higher Education, Economic Development and Poverty:
Apparently, the end objective of any economic policy devised to date is to generate welfare and wellbeing of the public and same is true for growth which must also fall in the category of welfare generating strategies since the idea has always been that at the end of the day growth should be good for poor. It makes sense because in
economics poverty decomposition identifies two channels through which poverty is affected. One is the growth channel and the other is inequality (Kakwani et al, 2000). Growth is good for poor whereas inequality is not good. Since pro growth policies sometimes puts an upward pressure on inequality, as it is in case of higher education focus in developing countries, growth itself is not sufficient for pro poor outcomes. Now more relevant question is how to align growth with poverty alleviation? The simple answer is to sterilize any adverse distributional effects of pro growth policies to make growth a ‘chaste pro poor experience’.
Recently World Bank realizes this fact: “For a given rate of growth, the extent of poverty reduction depends on how the distribution of income changes with growth and on initial inequalities in income, assets and access to opportunities that allow poor people to share in growth ………how growth affects poverty depends on how the additional income generated by growth is distributed with in a country” (2001:52).
focus are positive and significant in terms of economic development. There is truth to the statement as we see in the case of China and India where high growth rates have been accrued partly because both countries, in 1970s and 1980s, have successfully transformed a portion of their population into skilled labor by generously allocating funds to higher education. Today the cheaper skilled labor force of India and China is the prime factor behind the flow of billion dollar worth of outsourcing and foreign investments into these economies. However, one may also note that such hot pursuit for higher education has resulted in an unequal education policy stance, whereby higher education has been promoted at the cost of primary education. As discussed before such unequal education policies have been one of the significant determinants of increasing inequalities in the South, especially China, South Asia and Latin America.
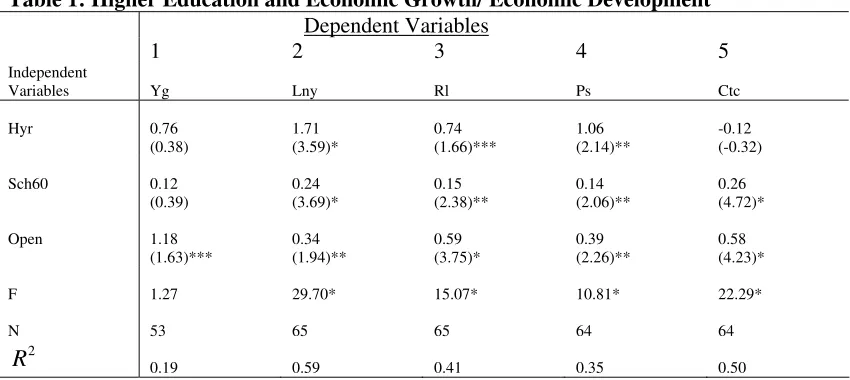
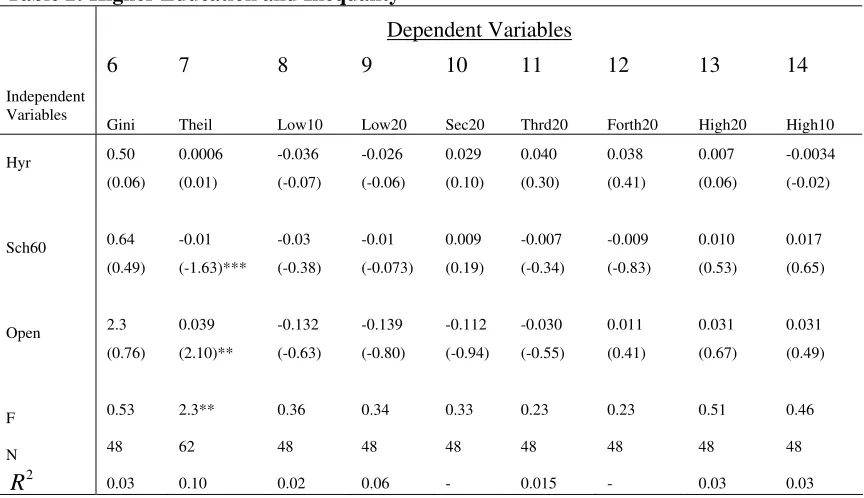
In this section we will empirically test growth effect and inequality effect of higher education policies for developing countries by carrying out IV linear regressions on a set of 14 separate regression models (see appendix 2 for details). Higher education (hyr) is represented by average years of higher schooling in the total population at 25 for 1999. We have taken 5 different proxies of economic development and 4 different proxies for income inequality.
Our first proxy of economic development Yg captures long run economic growth and calculated as the growth rate of per capita income covering the period of 40 years from 1960-2001. Lny, which captures the short term economic growth, is the natural logarithm of Per Capita Income at purchasing Power Prices for the year 2000. Since institutions are considered to be the most important determinants of long run economic growth (see Rodrik et al, 2004), we have taken three different key institutional definitions namely rule of law (Rl), political stability (Ps) and control for corruption (Ctc), proposed by Kaufman et al (2002).
To capture inequality we not only take GINI income inequality index (Gini) from UNU/WIDER World Income Inequality Database (WIID) but also we employ UTIP-UNIDO Theil measure (Theil) calculated by University of Texas Inequality Project (UTIP) which captures wage inequality between skilled and unskilled labour. Further more we take income deciles and percentiles from UNU/WIDER World Income Inequality Database (WIID) as other proxies of inequality. Higher education will be guilty of inequality if it has the negative impact on the incomes of bottom 10 percent (low10) and positive impact on the income of the top 10 percent (high 10). We also take income groups divided into quintiles where the effect of higher education is anticipated to be negative for bottom 20 percent (low20) and positive for top 20 percent (high20), where as the middle income groups (Sec20, Thrd20 and Forth20) it might be either way depending on the severity of inequality existing in primary and higher education as well as outreach of higher education to the middle income groups. Each country observation for all inequality measures is taken for the latest year for which data is available and in most cases represent inequality in mid 1990s.
(the ratio of nominal imports plus exports to GDP) for the year 1985, which has been extensively used in the literature (see Frankel and Romer, 1999; Acemoglu, Johnson and Robinson, 2001; Alcala and Ciccone, 2002; Dollar and Kraay, 2002; and Rodrik et al, 2004). Both sch60 and Open are employed as independent variables for our economic development/economic growth equations and inequality equations because on the one hand economic literature suggests that countries which start out with better educational attainments grow faster as well as perform well against inequality (see Fisher, 2001; Tuelings and van Rens, 2002; Eiche, 2001; Bourguignon and Morrisson, 1990; Tilak, 1989) and on the other hand countries which are more open do grow faster (Dollar and Kraay, 2002) but they may witness inequalities as trade liberalisation favours affluent segments of the society over less affluent ones ( see Chen and Ravallion, 2003; Cockburn, 2002; Friedman, 2000; Lofgren, 1999). In short sch60 and Open are important determinants of economic development as well as inequality. Here we need to isolate the impact of openness by finding a right instrument as Open is not a pure exogenous variable, and itself depends on income levels or institutions. The literature establishes the predicted trade share following Frankel and Romer (FR) (1999) from a gravity equation as an appropriate instrument for openness/trade policy (see, Dollar and Kraay, 2002; Rodrik et al, 2004; Acemolgu, Johnson and Robinson, 2001; Hall and Jones, 1999).
Table 1: Higher Education and Economic Growth/ Economic Development Dependent Variables
1 2 3 4 5
Independent
Variables Yg Lny Rl Ps Ctc
Hyr 0.76 (0.38) 1.71 (3.59)* 0.74 (1.66)*** 1.06 (2.14)** -0.12 (-0.32)
Sch60 0.12 (0.39) 0.24 (3.69)* 0.15 (2.38)** 0.14 (2.06)** 0.26 (4.72)*
Open 1.18 (1.63)*** 0.34 (1.94)** 0.59 (3.75)* 0.39 (2.26)** 0.58 (4.23)*
F 1.27 29.70* 15.07* 10.81* 22.29*
N 53 65 65 64 64
2
R 0.19 0.59 0.41 0.35 0.50
Note: *, **, *** shows significance at 1%, 5% and 10% level respectively.
In column 1, for Yg regression equation, GDP level at 1960 has been used as a control variable depicting the income level at base year.
Table 2: Higher Education and Inequality
Dependent Variables
6 7 8 9 10 11 12 13 14
Independent Variables
Gini Theil Low10 Low20 Sec20 Thrd20 Forth20 High20 High10
Hyr 0.50 (0.06) 0.0006 (0.01) -0.036 (-0.07) -0.026 (-0.06) 0.029 (0.10) 0.040 (0.30) 0.038 (0.41) 0.007 (0.06) -0.0034 (-0.02)
Sch60 0.64 (0.49) -0.01 (-1.63)*** -0.03 (-0.38) -0.01 (-0.073) 0.009 (0.19) -0.007 (-0.34) -0.009 (-0.83) 0.010 (0.53) 0.017 (0.65)
Open 2.3 (0.76) 0.039 (2.10)** -0.132 (-0.63) -0.139 (-0.80) -0.112 (-0.94) -0.030 (-0.55) 0.011 (0.41) 0.031 (0.67) 0.031 (0.49)
F 0.53 2.3** 0.36 0.34 0.33 0.23 0.23 0.51 0.46
N 48 62 48 48 48 48 48 48 48
2
R 0.03 0.10 0.02 0.06 - 0.015 - 0.03 0.03 Note: *, **, *** shows significance at 1%, 5% and 10% level respectively.
4. Outline of a Pro Poor Higher Education Reform Process:
[image:9.595.78.283.212.562.2]Economic literature suggests that inequality is not expected to be good for growth either (Aghion et al 1999; Kakwani et al, 2000). World Bank supports the notion that lower inequality can increase efficiency and economic growth through a variety of channels. The report says: “………policies to improve the distribution of income and assets can have a double benefit – by increasing growth and by increasing the share of growth that accrues to poor people”( (2001:56).
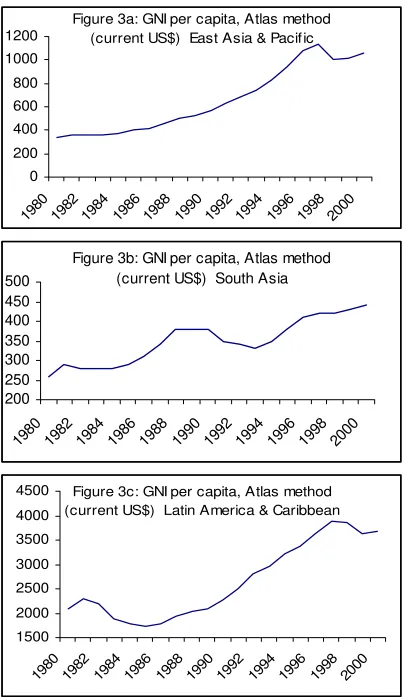
Figure 3a: GNI per capita, Atlas method (current US$) East Asia & Pacific
0 200 400 600 800 1000 1200
1980198 2 198 4 198 6 198 8 199 0 199 2 199 4 199 6 199 8 200 0
Figure 3b: GNI per capita, Atlas method (current US$) South Asia
200 250 300 350 400 450 500 198 0 1982 198 4
1986 1988 1990 1992 1994 1996 1998 200 0
Figure 3c: GNI per capita, Atlas method (current US$) Latin America & Caribbean
1500 2000 2500 3000 3500 4000 4500
19801982 19841986 1988 19901992 19941996 19982000
Recently inequality has been on the rise in many countries of the South as seen in figure 3a, 3b and 3c. Amid increasing inequalities, it becomes vital for education reforms to strike a balance between secondary, higher and primary education. Higher education should not be seen in isolation from overall education policy frame work. Investments in higher education at the cost of primary education would not help the South to achieve its development goals. The higher education policy can be successful only after the allocation of sufficient funds to basic education as education for all will bring the socially excluded segments of the population into the mainstream and allow them to
benefit from the processes of growth. Generally the governments in developing countries face budgetary constraints which force them to concentrate on higher education, whereas primary education is ignored because of its weaker relationship with economic growth. Enough budgetary allocation to development sector in general and education sector in particular is vital for the pursuit of balanced education policies in the South.
A higher education focus may bring fast dividends to the economy by boosting its growth in the short run, but if primary education is being ignored as an outcome of a country’s higher education focus, inequalities may rise in the society, whereas on the one hand these rising inequalities may hamper the long run growth potential of the country and on the other hand, they will be a direct obstacle to country’s development goals.
5. Conclusions and Policy Recommendations:
The paper attempts to outline a pro poor higher education reform process in the South. The theoretical discussion as well as the empirical exercise carried out in the paper strongly suggests that higher education, as it is in the developing countries, do contribute to growth and economic development. However the paper finds out that higher education has failed to cater the poor and if anything it is negatively related with the incomes of the lowest income groups and the poorest of the poor. The simple reason for unequal effects of higher education is the prevalence of unequal school attainments between the poor and the more affluent income groups. Unequal school attainments is a direct outcome of unequal education policies of the Southern governments who, in an effort to achieve higher growth rate, have been investing generously in higher education while at the same time have been ignoring primary education for being less growth retarding.
The paper proposes that higher education reforms should seek to neutralise the unequal effects of higher education because our empirical evidence suggests that a balanced education policy is a more effective policy choice than merely focusing at higher education. A balanced education policy, where primary education is promoted with the same vigour as higher education, is not only good for growth but the gains to welfare are greater with increasing possibilities of integration of socially excluded segments of the society into the mainstream.
In an effort to more equal education policy framework in developing countries, the paper proposes that governments in developing countries should not isolate higher education from over all education policy frameworks. This is an important step for higher education reforms, because many developing countries have separate institutional arrangements for higher education and primary education who work mutually exclusive to each other. More coordination between autonomous higher education commissions and ministry of education can be stepping stone for the formulation of balance education policies in the South.
Re fe r e n ce s:
ACEMOGLU, Daron, JOHNSON, Simon and ROBINSON, James A., “The Colonial Origins of Comparative Development: An Empirical Investigation,” American
Economic Review, Vol. 91, No. 5, 2001, pp. 1369-1401
http://emlab.berkeley.edu/users/chad/e236c_f04/ajr2001.pdf
AGHION, P., C. Eve, and Garcia-Penalosa, C., “Inequality and Economic Growth: The Perspective of the New Growth Theories,” Journal of Economic Literature XXXVII, December 1999: 1615-60.
FRANCISCO, Alcala and CICCONE, Antonio, “Trade and Productivity”, CEPR Discussion Paper No. 3095, 2001
BARRO, Robert J., “Does an Income Gap Put a Hex on Growth’ Business Week, March 29, 1999
BERTHELEMY, Jean-Claude, “To What Extent are African Education Policies Pro-Poor,” Unpublished, 2004
http://www.csae.ox.ac.uk/conferences/2004-GPRaHDiA/papers/5h-Berthelemy-CSAE2004.pdf
BIRDSALL, Nancy, “Education: the People’s Asset”, CSED Working Paper No. 5, 1999
http://www.brookings.org/dybdocroot/ES/dynamics/papers/education-tpa/education-tpa.htm
BOURGUIGNON, Francois and MORRISON, Christiasn., “Income Distribution, Development and Foreign Trade: A Cross Section Analysis,” European Economic Review, vol. 34, no. 6, 1999, pp. 1113-1132
CASTELLO, Climent, Maria Amparo and DOMENECH, Rafael, "Human Capital Inequality and Economic Growth: Some New Evidence,” Economic Journal, Vol. 112, 2002, pp. C187-C200
CHEN, Shaohua and RAVALLION, Martin, “Household Welfare Impacts of China’s Accession to the World Trade Organization,” World Bank Policy Research Working Paper 3040, 2003 www.econ.worldbank.org/files/26013_wps3040.pdf
CHOWDHURY, Kowsar P., “Literacy and Primary Education”, Human Capital Development and Operations Policy Working Paper (HCOWP) 50, 1994. http://www.worldbank.org/html/extdr/hnp/hddflash/workp/wp_00050.html
COCKBURN, John, “Trade Liberalization and Poverty in Nepal: A Computable General Equilibrium Micro Simulation Analysis,” The Centre for the Study of African Economies Working Paper Series. Working Paper 170, 2002
http://www.bepress.com/csae/paper170
http://www.carnegie-rochester.rochester.edu/April02-pdfs/ITG2.pdf
DUR, Robert A. J. and TEULINGS, Coen N, “Education, Income Distribution and Public Policy,” Unpublished draft, Tinbergen Institute, 2002
http://www.iza.org/iza/en/papers/transatlantic/1_teulings.pdf
DURYEA, S. and SZEKELY, M. Labour Markets in Latin America: A Supply-Side Story. Prepared for the seminar Employment in Latin America: What is the Problem and How to Address It? Annual Meeting of the Board of Governors, Inter-American Development Bank, Cartagena de Indias, Colombia, March 15, 1998.
EICHE, Theo S. and CECILIA Garcia-Penalosa , “Inequality and Growth: The Dual role of human Capital in Development,” Journal of Development Economics, vol. 66, issue 1, 2001, pages 173-197
FISCHER, Ronald D., “The Evolution of Inequality after Trade Liberalization,” Journal of Development Economics, Vol. 66, 2001, p. 555-579.
FRANKEL, Jaffery and ROMER, David, “Does Trade Cause Growth?” American Economic Review, vol. 89, no. 3, 1999, pp 379-399.
FRIEDMAN, Jed, “Differential Impacts of Trade Liberalisation on Indonesia’s Poor and Non-Poor,” Conference on International Trade and poverty, Stockholm, October 20, 2000.
GREGORIO, D. Jose. and LEE, Jong-Wha, “Education and Income Distribution: New Evidence from Cross-Country Data,” Development Discussion Paper No. 714, Harvard Institute for International Development (HIID), 1999
http://www.hiid.harvard.edu/pub/pdfs/714.pdf
HALL, Robert E., and CHARLES Jones, “Why do Some Countries Produce So Much More Output per Worker than others?” Quarterly Journal of Economics, Volume 114, 1999, pp. 83-116
KAUFMAN, Daniel, Kraay, Aart and ZOIDO-Lobaton, “Governance Matters II: Updated Indicators for 2000/01”, Policy Research Working Paper 2772, The World Bank, 2002.
http://www.worldbank.org/wbi/governance/pdf/govmatters2.pdf
KAKWANI, N., PRAKASH, B., and SON, H.,“Growth, Inequality, and Poverty: An Introduction”, Asian Development Review, 2000, Vol. 18, No.2, pp.1-21.
LOFGREN, Hans, “Trade Reform and the poor in morocco: A Rural-Urban General Equilibrium Analysis of Reduced Protection,” TMD Discussion paper, IFPRI, Washington DC, No. 38, 1999
MINGAT, Alain and TAN, J. P., “Subsidization of Higher Education versus Expansion of Primary Enrollments: What Can a Shift of Resources Achieve in Sub-Saharan Africa?” International Journal of Education Development, Vol.5, 1985, pp. 259-268.
RAVALLION, Martin, “The Debate on Globalization, Poverty, and Inequality: Why
Measurement Matters” World Bank Policy Research Working Paper 3038,
Washington DC, 2003 http://econ.worldbank.org/files/26010_wps3038.pdf
RODRIK, Dani, SUBRAMANIAN, Arvind, and TREBBI, Francesco, “Institutions Rule: The Primacy of Institutions Over Geography and Integration in Economic Development,” Journal of Economic Growth, Vol. 9, no. 2, June 2004, pp. 131-165
ROSE, Andrew K., “Do WTO Members Have a More Liberal Trade Policy?” NBER Working Paper 9347, 2002
THOMAS, Vinod, WANG, Yan, and FAN, Xibo, “Measuring Education Inequality: Gini Coefficients of Education,” Mimeo, Banque Mondiale, 2000
http://econ.worldbank.org/files/1341_wps2525.pdf
TINBERGEN, Jan, Income Distribution: Analysis and Policies, Amsterdam: American Elsevier, 1975
TILAK, Jandhyala B. G., Education and its Relation to Economic Growth, Poverty and Income Distribution, World Bank: Washington D. C., 1989
TEULINGS, Coen N. and RENS, van Thijs, "Education, Growth and Income Inequality,” CESifo Working Paper Series No. 653; Tinbergen Institute Working Paper No. 2002-001/3, 2002
APPENDIX 1
Figure 1a: Education Attainment of the Richest and Poorest 21 Year Olds in the 1990s (average years of education attained in some selected Latin American Countires)
Source: Birdsall (1999)
Figure 1b: Education Attainment of the Richest and Poorest 21 Year Olds in the 1980s and 1990s
(average years of education attained in some selected Latin American Countires)
[image:14.595.120.504.519.740.2]APPENDIX 2
2
ndStage Regression Models:
Economic Growth / Economic Development
i i i
i i
i Hyr Sch Open Gdp
Lg =α1 +β1 +χ1 60 +δ1 +ε1 60 +ε1 ….. Model 1
i i i
i
i Hyr Sch Open
Lny =α2 +β2 +χ2 60 +δ2 +ε2 ………...Model 2
i i i
i
i Hyr Sch Open
Rl =α3 +β3 +χ3 60 +δ3 +ε3 ………..Model 3
i i i
i
i Hyr Sch Open
Ps =α4 +β4 +χ4 60 +δ4 +ε4 ……….Model 4
i i i
i
i Hyr Sch Open
Ctc =α5 +β5 +χ5 60 +δ5 +ε5 ………Model 5
Income Inequality
i i i
i
i Hyr Sch Open
Gini =γ1+λ1 +ϖ1 60 +ς1 +Ε1 ………...Model 6
i i i
i
i Hyr Sch Open
Theil =γ2 +λ2 +ϖ2 60 +ς2 +Ε2 ………Model 7
i i i
i
i Hyr Sch Open
Low10 =γ3 +λ3 +ϖ3 60 +ς3 +Ε3 ………..Model 8
i i i
i
i Hyr Sch Open
Low20 =γ4 +λ4 +ϖ4 60 +ς4 +Ε4 ……….Model 9
i i i
i
i Hyr Sch Open
Sec20 =γ5 +λ5 +ϖ5 60 +ς5 +Ε5 ………..Model 10
i i i
i
i Hyr Sch Open
Thrd20 =γ6 +λ6 +ϖ6 60 +ς6 +Ε6 ………Model 11
i i i
i
i Hyr Sch Open
Forth20 =γ7 +λ7 +ϖ7 60 +ς7 +Ε7 …………..Model 12
i i i
i
i Hyr Sch Open
High20 =γ8 +λ8 +ϖ8 60 +ς8 +Ε8 ………Model 13
i i i
i
i Hyr Sch Open
High10 =γ9 +λ9 +ϖ9 60 +ς9 +Ε9 ………Model 14
First Stage Regression Equation for Open:
i i
i
i FR Disteq Error
APPENDIX 3
DATA AND SOURCES:
Ctc: Control of Corruption, Year: 1997/98. Source: Kaufman et al (2002)
Forth20: Fourth Income Percentile, Year: 1995, Source: UNU/WIDER World Income Inequality Database (WIID) http://www.wider.unu.edu/wiid/wiid.htm
Gdp60: Gross domestic Product, Year: 1960, Source: World Development Indicators (WDI), 2002.
Gini: Coefficient in Percentage Points as calculated by WIDER. Year: 1995, Source: UNU/WIDER World Income Inequality Database (WIID) http://www.wider.unu.edu/wiid/wiid.htm
High10: Highest Income Decile, Year: 1995, Source: UNU/WIDER World Income Inequality Database (WIID) http://www.wider.unu.edu/wiid/wiid.htm
High20: Fifth Income Percentile, Year: 1995, Source: UNU/WIDER World Income Inequality Database (WIID) http://www.wider.unu.edu/wiid/wiid.htm
Hyr: Average Years of Higher Schooling in the Total Population at 25, Year: 1999.
Source: Barro R & J. W. Lee data set, http://post.economics.harvard.edu/faculty/barro/data.html
Lg: Growth rate of Gross domestic product from 1960 to 2001. Source: World Development Indicators (WDI), 2002.
LnY: Natural logarithm of Per Capita Income at purchasing Power Prices (PPP), Year: 2000. Source: World Development Indicators (WDI), 2002.
FR: Natural logarithm of predicted trade shares computed following Frankel and Romer (1999) from a bilateral trade equation with ‘pure geography’ variables. Source: Frankel and Romer (1999).
Low 10:Lowest Income Decile, Year: 1995, Source: UNU/WIDER World Income Inequality Database (WIID) http://www.wider.unu.edu/wiid/wiid.htm
Low20: First Income Percentile, Year: 1995, Source: UNU/WIDER World Income Inequality Database (WIID) http://www.wider.unu.edu/wiid/wiid.htm
Open: Natural logarithm of openness. Openness is given by the ratio of (nomnal) imports plus exports to GDP (in nominal US dollars), Year: 1985. Source: Penn World Tables, Mark 6.
Pk: Gross Capital Formation as a percentage of GDP, Year: 2000. Source: World
Development Indicators (WDI), 2002.
Ps: Political Stability, Year: 1997/98. Source: Kaufman et al (2002)
Rl: Rule of Law, Year: 1997/98. Source: Kaufman et al (2002)
Sec20: Second Income Percentile, Year: 1995, Source: UNU/WIDER World Income Inequality Database (WIID) http://www.wider.unu.edu/wiid/wiid.htm
Thrd20: Third Income Percentile, Year: 1995, Source: UNU/WIDER World Income Inequality Database (WIID) http://www.wider.unu.edu/wiid/wiid.htm
Theil97: UTIP-UNIDO Wage Inequality THEIL Measure - calculated based on UNIDO2001 by UTIP, Year: 1997. Source: University of Texas Inequality Project (UTIP) http://utip.gov.utexas.edu.