Performance based Analysis and Comparison of
Multi-Algorithmic Clustering Techniques
Rajesh N. Phursule
Student, M.Tech.(CST) Shivaji University, Kolhapur.P. C. Bhaskar
Coordinator, M. Tech. (CST) Shivaji University, Kolhapur.
ABSTRACT
Clustering the documents based on similarity of words and searching the text is major search procedure and widely used for large set of documents. Documents can be clustered using many clustering algorithms such as Nearest Neighbor, K-Means, Hierarchical, Graph Theoretic etc [4] [5] [7]. The performance measurement in terms of space complexity and execution time and searched output in terms of accuracy and redundancy of these algorithms is a needful study [3]. This paper mainly focuses on performance measurement of Nearest Neighbor, K-Means and Hierarchical agglomerative clustering algorithms on text documents as well as compares them in terms of space complexity, execution time, accuracy and redundancy. In particular, preprocess the input text document and convert it into the document graph represented in the form of matrix. Then convert that document graph into relation matrix which gives relation (similarity score) among all the nodes from 0 to 1 [2]. Implementation and the results of applied clustering algorithms ( Nearest Neighbor, K-Means and Hierarchical agglomerative) on documents are discussed and implemented here.
General Terms
Clustering algorithms, Performance Measurement, Space Complexity, Execution time, Accuracy. Redundancy
Keywords
Analysis and Comparison of K-means, Nearest Neighbor, Agglomerative Hierarchical, Document Graph. Clustering algorithm.
1.
INTRODUCTION
Research in performance based analysis and comparison of different clustering algorithm is becoming a very significant in order to provide a good summary result to the different types of users [1] [11]. Different types of data mining techniques are used to mine the appropriate data from the document or the set of documents [4] [7]. This paper mainly focuses on clustering techniques. Some of these clustering techniques are K-Means, Nearest Neighbor, Agglomerative Hierarchical and Graph Theoretic etc [1] [16] [17]. Many efforts have been devoted to search new data mining techniques to get good results, but less attention has been devoted to analyze and compare them to get the effective technique for a particular application. In particular, make analysis of different clustering techniques and compare them in terms of space complexity, execution time, redundancy and accuracy. Final results showed the trade off criteria to choose the clustering techniques for a particular application [3]. Trade of criteria contains accuracy, space complexity, computational loops and redundant data in the result. In short make a framework/model which suggests best clustering technique for a particular application as well as any new clustering technique get compared with the existing.
This paper is organized as follows. Section 2 discusses the previous research work and proposed method to analyze and compare above mentioned three clustering techniques. Section 3 discusses related work. It contains preprocessing of input document and converts it into the relation graph in the form of matrix [2]. It describes the applicability of clustering algorithms on that. It converts the relation graph into the number of clusters [1] [2]. It describes the performance based comparison and trade-off criteria. The results of the experiment evaluating the performance of the three clustering techniques are represented in section 4 and 5. Finally section 6 draws the conclusion and future development work.
2.
METHOD
Figure 1: Performance Based Analysis and Comparison of Multi-algorithmic Clustering Techniques Framework
2.1
Preprocessing the Input Text File
The system accepts input text file. The file is read and stored into a string. The string is then split by the newline keyword. The split file is assigned to the string array as the split function returns the string array. The array contains paragraphs which are further treated as nodes [2].
2.2
Adding Weighted Edge to Document
Graph
A weighted edge is added to the document graph between two nodes if they either correspond to adjacent node or if they are semantically related, and the weight of an edge denotes the degree of the relationship. Here two nodes are considered to be related if they share common words (not stop words) and the degree of relationship is calculated by “Semantic parsing”. Also notice that the edge weights are query-independent, so they can be pre-computed.
The following input parameters are required at the pre computation stage to create the graph.
1. Threshold for edge weights. Only edges with weight not below threshold will be created in the document graph. (A threshold is user configurable value that controls the formation of edges).
Adding weighted edge is the next step after generating document graph. Here for each pair of nodes u, v we compute the association degree between them. It is the score (weight) EScore(e) of the edge e(u,v). If Score (e) ≥ threshold, then e is
added to E. The score of edge e(u,v) where nodes u, v have text fragments t(u), t(v) respectively is [2]:
𝐸𝑠𝑐𝑜𝑟𝑒 = 𝑤𝜖 𝑡 𝑢 ,𝑡 𝑣 ((𝑡𝑓 𝑡 𝑢 , 𝑤 + (𝑡𝑓 𝑡 𝑣 , 𝑤 )𝑖𝑑𝑓(𝑤) 𝑠𝑖𝑧𝑒(𝑡 𝑢 + 𝑠𝑖𝑧𝑒(𝑡(𝑣)
Where,
𝑡𝑓 𝑑, 𝑤 : is the number of occurrences of w in d
𝑖𝑑𝑓(𝑤) : is the inverse of the number of documents containing w, and
𝑠𝑖𝑧𝑒(𝑑) : is the size of the document (in words).That is, for every word w appearing in both text fragments, we add a quantity𝑡𝑓∗ 𝑖𝑑𝑓(𝑤) equal to the score of w. Notice that stop words are ignored.
2.3
Document Clustering
Clustering is grouping of similar nodes (The nodes which shows degree of closure greater than or equal to the Cluster Threshold specified by the user) into a group. The following approaches of clustering are used [1] [11] [16] [17]
a) K-Means b) Nearest Neighbor
c) Agglomerative Hierarchical
2.4
Adding Weights to Nodes in Cluster
When a query Q arrives, the nodes in V are assigned query-dependent weights according to their relevance to Q. In particular, we assign to each node v corresponding to a text fragment t(v), node score 𝑁𝑠𝑐𝑜𝑟𝑒 𝑣 defined by the Okapi formula as given below [2].
𝑁𝑠𝑐𝑜𝑟𝑒(𝑣)
= ln𝑁 − 𝑑𝑓 + 0.5 𝑑𝑓 + 0.5 𝑤𝜖𝑄 ,𝑑
(𝑘1+ 1)𝑑𝑓 (𝑘1 1 − 𝑏 + 𝑏 𝑑𝑙𝑎𝑣𝑑𝑙) + 𝑡𝑓
(𝑘3+ 1)𝑞𝑡𝑓 𝑘3+ 𝑞𝑡𝑓
tf : is the term‟s frequency in document, qtf : is the term‟s frequency in query,
N : is the total number of documents in the collection, df : is the number of documents that contain the term, dl : is the document length (in words),
avdl : is the average document length and
k1 (between “1.0–2.0”), b (usually 0.75), and k3 (between “0– 1000”) are constants.
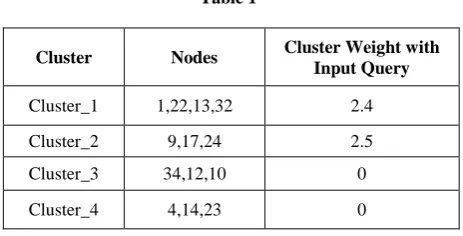
The returned Node Weight is stored in the table as follows:
Table 1
Cluster Nodes Cluster Weight with
Input Query
Cluster_1 1,22,13,32 2.4
Cluster_2 9,17,24 2.5
Cluster_3 34,12,10 0
Cluster_4 4,14,23 0
2.5
Performance Measurement
computational cycles than Nearest Neighbor. In case of K-Means both parameters depends on selection of master nodes and applied query.
2.6
Trade-off Criteria
Space and time complexity are two important parameters. Different clustering techniques performance is compared with each other on the basis of these parameters. That already been discussed in above section. Some other parameters are also equally important with space and time complexity to compare the performance of different clustering techniques. These parameters are accuracy of the resultant cluster and redundant data (redundancy) present in the result. But trade-off criteria is required if you want to use these four parameters to use the clustering techniques for a particular application. Experimental results proved that while you are choosing a particular clustering technique, these four parameters are very important. There is trade-off relation among them. Nearest Neighbor clustering technique has lowest redundancy almost nil and highest space utilization and computational cycles. Accuracy of Nearest Neighbor is also high. Agglomerative Hierarchical clustering technique has lowest space utilization and computational cycles but highest redundancy. Accuracy is moderate. In case of K-Means space utilization and computational cycles totally depends on master node selection and query applied. Accuracy and redundancy are also depends on master node selection and input query. User can choose clustering techniques according to the application and trade-off criteria.
3.
RELATED WORK
The process of grouping a set of physical or abstract objects into classes of similar objects is called clustering [7]. A cluster is a collection of data objects that are similar to one another within the same cluster and are dissimilar to the objects in other clusters. Data clustering is under vigorous development. Contributing areas of research include data mining, statistics, machine learning, spatial database technology, biology, and marketing. Owing to the huge amounts of data collected in databases, cluster analysis has recently become a highly active topic in data mining research. In this paper performance based analysis and comparison of three clustering algorithms are discussed which guides user while selection of clustering algorithm for their application. These three clustering algorithms are a) Nearest Neighbor b) Simple K Means c) Agglomerative Hierarchical
Performance of these algorithms are analyzed and compared with four parameters named space utilization, computational cycles, accuracy and redundancy.
3.1 Preprocessing of Input Text File
System accepts the input text file. File is split into the number of nodes or paragraphs by the newline character. These nodes are represented in the form of table named as Document Graph. Similarity score among all nodes is represented in table named as Relation Graph.
3.2 K Means Clustering
K Means is simple portioned algorithm can be used for clustering large dataset on predefined attributes.
Algorithm for k-means 1. Decide on a value for k.
2. Initialize the k cluster nodes (randomly, if necessary). 3. Decide the class memberships of the N objects by assigning them to the nearest cluster center.
4. Re-estimate the k cluster centers, by assuming the memberships found above are correct.
5. If none of the N objects changed membership in the last iteration, exit. Otherwise go to step 3.
3.3 Nearest Neighbor Clustering
Algorithm for Nearest Neighbor
1. Set i = 1 and k = 1. Assign pattern X1 to cluster C1.. 2. Set i = i + 1. Find nearest neighbor of Xi among the patterns already assigned to clusters. Let dm denote the distance from Xi to its nearest neighbor. Suppose the nearest neighbor is in cluster m
3. If dm greater than or equal to t then assign Xi to Cm where t is the threshold specified by the user. Otherwise set k = k+1 and assign Xi to a new cluster Ck
4. If every pattern has considered then exit. Otherwise go to Step 2.
3.4 Agglomerative Hierarchical Clustering
Algorithm for Agglomerative Hierarchical
1. Start by assigning each node to a cluster, so that if you have N nodes, you now have N clusters, each containing just one node. Let the distances (similarities) between the clusters the same as the distances (similarities) between the nodes they contain
2. Find the closest (most similar) pair of clusters and merge them into a single cluster, so that now you have one cluster less. 3. Compute distances (similarities) between the new cluster and each of the old clusters.
4. Repeat steps 2 and 3 until new clusters and old clusters are different. Otherwise exit.
3.5 Performance Measurement and
Trade-off Criteria.
After getting the minimal cluster for the input query, these three algorithms are compared with each other on the basis of four parameters space utilization, computational cycles, accuracy and redundancy. To show the trade of criteria, all parameters result for a particular input query is shown.
4.
IMPLEMENTATION
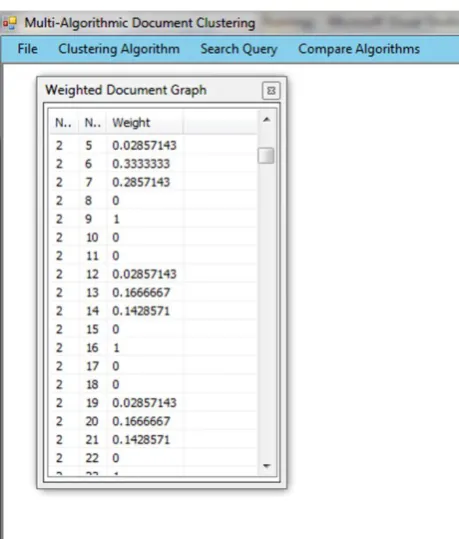
Figure 2: Relation Graph
Relation graph (Weighted Document Graph) gives the similarity score between all nodes. The range of similarity score is 0 to 1. For example, in above figure Node 2 and 9 have the highest similarity score (one). That means node 2 and 9 are perfectly matched. Similarly, node 2 and 8 have lowest similarity score (zero). That means node 2 and 9 are completely distinct.
In Figure 3, graphical representation shows that Nearest Neighbor has highest space (5371 Kb) and time (8457 computational cycles) complexity. K-Means clustering technique has lowest time complexity (269 computational cycles) and moderate space complexity (2051 Kb). Agglomerative Hierarchical technique has moderate time complexity (6971 computational cycles) and lowest space complexity (1757 Kb).
[image:4.595.316.554.71.212.2]Figure 3: Space Utilization and Computational Cycle Comparison
Figure 4: Comparative Results
Resultant clusters with matching score are represented for all three clustering techniques. Resultant clusters are found out for at least 50% match with the given query. In the result „Match Found (%)‟ column gives matching percentage of that particular query with each resultant cluster.
Figure 5: Trade-off Criteria
Trade-off criteria to choose a particular technique for an application depends on four parameters named as accuracy, redundancy, computational cycles and space complexity. Accuracy, computational cycles and space complexity are discussed in previous results. Here above three values with redundancy is shown. Redundancy is data other than input query is present in minimal cluster. Redundancy of Nearest Neighbor clustering technique is very low almost zeros. Redundancy of Agglomerative Hierarchical is highest (88%). Redundancy of K-Means is depends on master node selection. Here we have got 80%.
5.
RESULT AND DISCUSSION
[image:4.595.315.553.296.428.2] [image:4.595.54.290.546.675.2]6.
CONCLUSION AND FUTURE WORK
Performance based analysis and comparison of multi-algorithmic clustering techniques has been discussed. Four different parameters are considered for comparison names as space utilization, computational cycles, accuracy and redundancy. If your application needs exact data to mine, then Nearest Neighbor is best because it has lowest redundancy. Agglomerative hierarchical can be used if redundancy is not important factor. K-Means selection is depends on your application type.
The implemented system focuses only on three clustering algorithms. In future the model can be built in which any clustering algorithm can be compared with any existing or new clustering algorithm. Here I have considered input only as one text document. In future, it possible multiple file in multiple formats as a input.
7.
REFERENCES
[1] Sholom Weiss, Brian White and Chidanand Apte, “A Lightweight Document Clustering”, IBM T. J. Watson Research Centre NY10598, USA.
[2] Ramkrishna Varadrajan, Vagelis Hristidis, “A System for Query Specific Document Summarization”, Florida International University.
[3] Michael Steinbach, George Karypis, Vipin Kumar, “A Comparison of Document Clustering Techniques” ,University of Minnesota, Technical Report #00-034.
[4] A.K. Jain, Michigan State University, M.N. Murthy, Indian Institute of Science and P.J. Flynn, The Ohio State University, “Data Clustering: A Review”.
[5] King B., “Step-wise Clustering Procedures”, 1967J. Am. Stat. Assoc. 69, 86–101.
[6] Anderberg M. R.., “Cluster Analysis for Application”, 1973 Academic Press, Inc., New York Ny. Augustson, J.
[7] Abracos and G. Pereira-Lopes, “Statistical methods for retrieving most significant paragraphs in newspaper articles”, ACL/EACL Workshop on Intelligent Scalable Text Summarization, 1997.
[8] S. Agrawal, S. Chaudhuri, and G. Das, “DBXplorer: A System For Keyword-Based Search Over Relational Databases”, ICDE,2002.
[9] E. Amitay, C. Paris, “Automatically Summarizing Web Sites -Is there any way around it?”, CIKM,2000.
[10]H.H. Chen, J.J. Kuo, and T.C. Su, “Clustering and Visualization in a Multi-Lingual Multi- Document Summarization System ”, ECIR,2003
[11]G. Erkan and D.R. Radev. Lexrank, “Graph-based centrality as salience in text summarization”, JAIR,2004.
[12]J. Goldstein, M. Kantrowitz, V. Mittal, J. Carbonell, “Summarizing text documents: Sentence selection and evaluation metrics”, ACM SIGIR, 1999.
[13]C.Y. Lin, “Improving Summarization Performance by Sentence Compression - A Pilot Study”, IRAL,2003.
[14]D. Cutting, D. Karger, J. Pedersen, and J. Tukey, " Scatter/Gather: a Cluster-based Approach to Browsing Large Document collections", ACM SIGIR 1992.
[15]J. Hartigan and M Wong, “. A k-means clustering algorithm”, Applied Statitsics, 1979