http://dx.doi.org/10.4236/eng.2015.76031
Performance Optimization of Dual Pressure
Heat Recovery Steam Generator (HRSG) in
the Tropical Rainforest
Sidum Adumene
1, Barinaadaa Thaddeus Lebele-Alawa
21Department of Marine Engineering, Rivers State University of Science and Technology, Port Harcourt, Nigeria 2Department of Mechanical Engineering, Rivers State University of Science and Technology, Port Harcourt,
Nigeria
Email: sidum.adumene@ust.edu.ng, lebele-alawa.thaddeus@ust.edu.ng
Received 23 May 2015; accepted 26 June 2015; published 30 June 2015
Copyright © 2015 by authors and Scientific Research Publishing Inc.
This work is licensed under the Creative Commons Attribution International License (CC BY). http://creativecommons.org/licenses/by/4.0/
Abstract
This work evaluates the performance optimization of heat recovery steam generator system in Afam VI power plant, Rivers State. Nigeria. Steady state monitoring and direct collection of data from the plant was performed including logged data for a period of 12 months. The data were ana- lysed using various energy equations. Hysys software was used to model the temperature across the heating surfaces, and MATLAB software was used to determine the heat transfer coefficient, heat duties, steam flow, effectiveness of the HRSG. The optimization technique was carried out by varying the exhaust gas flow, exhaust gas temperature, steam pressure and the theoretical intro-duction of duct burner for supplementary firing. The results show that between 490˚C and 526˚C, the percentage increase in the overall heat absorbed in the HRSG is 37.39%. It also show that for an increase in the exhaust gas mass flow by 80 kg/s, the steam generation increase by 19.29% and 18.18% for the low and high pressure levels respectively. The overall result indicates an im-provement in the HRSG energy efficiency and steam generation. As the exhaust gas mass flow and temperature increases, the steam generation and system effectiveness greatly improved under the various considerations, which satisfy the research objective.
Keywords
HRSG, Effectiveness, Exhaust Gas Flow, Exhaust Gas Temperature, Steam Flow, Heat Duty
1. Introduction
gases. Heat recovery system is obviously a very desirable energy source, since the product is available almost operating cost-free and increases the efficiency of the cycle in which it is placed, either for steam generation or for incremental power generation. Heat recovery steam generator can regain energy from waste-gas streams, such as incinerator gases, furnace effluents or most commonly the exhaust of a gas turbine.
In modern operation of heat transfer equipment such as heat recovery steam generator (HRSG), the exit gas temperature determines the amount of energy extracted from the flue gas stream of the gas turbine. This is an indication of the HRSG performance. Therefore, efforts are often made to lower the stack temperature as much as possible taken into consideration cost effectiveness and low temperature corrosion. The modifications of a single pressure HRSG to multi-pressures have also improve the energy efficiency of the heat recovery steam generator unit [1]. Heat recovery steam generators can be made up from a number of components, including evaporators, economizers, superheaters, reheater, integral deaerators and preheaters. Each of the heat transfer sections performs a specific task, and the one that is selected are generally dictated by the required steam condi-tions for process use or power generation, the type of power generation and/or the efficiency requirement, weighed against HRSG costs.
Heat recovery steam generator evaporator sections act to vaporize water and produce steam in one component. A bank of finned tubes is extended through the gas turbine’s exhaust gas path from a steam drum (top) to a low-er (mud) drum. The gas turbine is a vlow-ery satisfactory means of producing mechanical powlow-er [2] [3]. Feed watlow-er is carefully supplied at the appropriate pressure to the upper drum below the water level, and circulates from the upper to lower drum, back to the upper drum by convection within the finned tube.
The economizers are serpentine finned-tube gas-to water heat exchangers, and add sensible heat (preheat) to the feed water, prior to its entry into the steam drum of the evaporator. Different heat transfer applications re-quire different types of hardware and different configurations of heat transfer equipment [4]. In single pressure HRSG, the economizer will be located directly downstream (with respect to gas flow) of the evaporator section. In multi-pressure unit, the various economizer sections may be split, and be located in several locations both up-stream and downup-stream of the evaporators. The superheater is a separate serpentine tube heat exchanger which is located upstream (with respect to gas flow) of the associated evaporator. This component adds sensible heat to the dry steam, superheating it beyond the saturation temperature.
In gas turbine heat recovery steam generator, its performance is dependent on the gas turbine exit temperature, inlet gas temperature, feed water temperature and steam pressure. The low exhaust gas temperature generates less steam on unit gas mass basis in the HRSG evaporator unit [5].
The HRSG is widely used equipment in various industries to which include process, power generation, and petroleum industry. The development of HRSG as a component part of the combined power cycle and cogenera-tion has improved power produccogenera-tion and enhanced costs effectiveness within the sector. Energy and materials saving consideration, as well as economical consideration have stimulated the high demand for high efficient HRSG.
Meeting the growing requirement for cost-effective and undisturbed operation in today’s economical envi-ronment drives power plants to reach for the best possible performance and higher availability. Power plants can no longer afford to operate without knowing the exact HRSG performances at all times or without taking imme-diate actions when problems occur. Even minor decreases in the HRSG efficiency and performance can cause significant financial and energy losses during the production phase of the plant. This called for several optimiza-tion techniques to maintain energy efficiency of the HRSG.
The hierarchical strategy implied for optimization of the whole combine-cycle power plant is as follows opti-mization of the gas turbine cycle, optiopti-mization of the operation parameters of the HRSG, and detailed optimiza-tion of the single heat exchanger secoptimiza-tion in the HRSG. One of the suggested ways to reach theoretically maxi-mum efficiency is by increasing the turbine inlet temperature [6]. This requires a highly advanced cooling sys-tem to cool down the blades of the gas turbine. With existing technology levels, focus can be fixed on the HRSG, and its operating parameters to improve the efficiency of the combined-cycle plants. Optimization of the operat-ing parameters of HRSG is the first step in the optimum design of the plants as stated in Franco and Russo [7].
Reddy et al. [8] suggested a second law analysis of the heat recovery steam generator. This method is basi-cally used to optimize and design various thermal units by minimizing the entropy generation in the unit. The operating parameters are non-dimensionalized, and an equation for the entropy generation number helps to study the effect of the dimensionless operating parameter.
due to temperature difference between hot and cold streams. Although this method did not apply any constraint on the cost of the HRSG, and on the surface area, it still gives a rough idea about the selection of operating pa-rameters for the HRSG.
Ongiro et al. [6] developed mathematical models to simulate and study the performance of the HRSG. Sub-hramanyam et al. [9] considered the computational complexity of the HRSG and how it could be model. The proposed method calculates the velocity and temperature fields by discretisation and the solution of conservation equation derived for a HRSG of particular geometry and duty.
Dumont and Heyen [10] suggested a mathematical model for modeling and designing a once-through heat recovery steam generator. In a conventional boiler, each tube plays a well defined role like water preheating, vaporization and superheating. Empirical equations are readily available to predict the average heat transfer in each region which is not the case in a once through boiler. This increases the mathematical complexity as well as the number of equations to be solved for modeling these boilers.
The even increasing technology is the field of HRSG, as a potential option to improve the efficiency of the system. This necessitates having a numerical flow model with the capability to simulate combustion and the flow in the HRSG model, as well as the flexibility to simulate those for different designs with acceptable accu-racy.
Valdes et al. [11] performed a thermo economic optimization of combined cycle gas turbine power plants us-ing a genetic algorithm. They proposed two different objective functions; aimed at minimizus-ing the cost of pro-duction per unit electricity and maximizing the annual cash flow.
Mohammad et al. [12] performed an exergetic and economic evaluation of the effect of HRSG configurations on the performance of combined cycle power plants. Their result showed that an increase in the number of pressure levels affects the exergy destruction rate in the HRSG.
Attala et al. [13] optimize a dual pressure level combined cycle gas turbine. They worked with a simulation program that included three models; the first simulates the cycle, the second evaluates the thermodynamic and thermo-economic parameters and the third is the optimization model.
Subrahmanyam et al. [9] discussed about the various factors affecting the HRSG design for achieving the highest combined cycle efficiency with cheaper, economical and competitive designs and with the highest re-quirement to meet the shorter deliveries.
Casarosa et al. [1] determine the operating parameters using both thermodynamic and thermo-economic func-tion by analytical and numerical (mathematical) methods.
Reddy et al. [8] applied second law analysis for a waste heat recovery steam generator which consists of an economizer, an evaporator and a superheater. Introducing multiple pressure steam generation in the HRSG of a combined power plant improves the performance of the plant than that of a corresponding single pressure sys-tem
Bassily [14] modeled a dual and triple pressure reheat combined cycle with a preset for pinch points, the temperature difference for superheat approach, the steam turbine inlet temperature at steam turbine and the out-let without a dearator in steam bottoming cycle. Srinvivas [15] suggested an improved location for a deaerator in a triple pressure HRSG.
Mohagheghi and Shayegan [16] developed computer code to examine the competence for a variety of types of HRSG, from the thermodynamic optimization of the HRSG, they obtained a high rate of generating power in the steam cycle. Zhixin et al. [17] designed a condition of a single pressure waste heat recovery system when the temperature or flow rate of exhaust gas fluctuates; the results show that systems designed at the upper boundary of fluctuation range of exhaust gas could generate more power.
Manassaldi et al. [18] proposed a methodology which applied a mixed non linear program model to obtain the design according to their criteria; Net power maximization, the ratio between net power and material weight maximization, and the net heat transfer maximization.
Alus and Petrovic [19] performed an optimization of a triple pressure combined cycle gas turbine (CCGT). The objective of the optimization was to minimize the production cost of electricity in the CCGT power plant based on energetic and economic analysis. Ghazl et al. [20] carried out an optimization study to find the best de-sign parameters (high and low degree pressures, steam mass flow rates, pinch point temperature difference and the duct burner fuel consumption flow rate) of a dual pressure combined cycle power. Total cost per unit of produced steam energy is defined as the objective function.
CFD analysis can be used to assess the impact of the gas-side flow on the HRSG performance and identify de-sign modification to improve the performance
In this work a sensitivity analysis and parametric modulation were carried out and the modeling of the HRSG using a computer program was created to produce the equation that can predict the functionality and optimiza-tion of the HRSG.
The study area is the Niger Delta area of Nigeria which lies between latitudes 4˚N and 6˚N, and longitude 5˚E and 8˚E. The vegetation of the area is equatorial rain forest. There are basically two seasons—the wet (April to September) and the dry (October to March). However, rain fall throughout the year. The mean annual rainfall in the area is between 200 mm in the North and 400 mm in the South of the region. The mean daily temperature of the region varies slightly from 27˚C to 30˚C all the year round. The maximum and minimum temperatures are 40˚C and 20˚C respectively. The relative humidity varies between a minimum of 70% and a maximum of 90% [22] [23].
2. Material and Methods
Data collected from the Afam VI HRSG was done by direct observation from the monitoring screen of the au-tomated system called human machine interface (HMI), including data from log books and manufacturers ma-nual as shown in Table 1 and Table 2. Such parameters include temperature of the flue gas, feed water pressure, mass flow rate, and ambient operating condition of the gas turbine. The Data obtained for this analysis are from the Afam VI power plant, Port Harcourt, Rivers State Nigeria. The design specification of the gas turbine and the dual heat recovery steam generator is shown below.
Technical Data of the Gas Turbine
Model: GT13E2
Power output (gross) 160 MW Compressor pressure ratio 14.1 Mass flow rates (kg/s) 500 Efficiency (LHV), % 35.7 Heat Rate (kJ/kWh) 10,084 Isentropic Efficiency % 86
Natural Gas (LHV) 46798 kJ/kg Combustor/burner Type Annular/EV Nox (at 15%O2, dy), ppmv <2
Technical Data of the HRSG
MCR (LP) 100 kg/s
S. H Steam Pressure 8 bar S. H Steam Temperature 300˚C
MCR (HP) 250 kg/s
S. H Steam Pressure 100 bar S. H Steam Temperature 600˚C
To predict the optimum performance of the HRSG, energy conservation principle is employed, hence the use of energy models to analyze the operating parameter of the HRSG is made. The total heat transfer may be re-lated with its governing (operating) parameter. Hysys was used in simulating the temperature drop across the heating element in the HRSG, and MATLAB software was used to analysed the performance for optimization.
2.1. Heat Transfer Coefficients and Effectiveness Calculation Model
This method is based on heat transfer coefficients to obtain the heat transfer area for each heat exchanger in high and low pressure level of the dual pressure HRSG. The effectiveness of the heating surfaces in the HRSG is also calculated with Equations (3), (4).
The overall heat transfer coefficient U by the total heat exchange area is calculated as follows (Ahmadi et al., [24]):
(
)
;T T hrsg SH EVA EC
SH EVA EC
Q
UA A A A A A
f LMTD
= = = + +
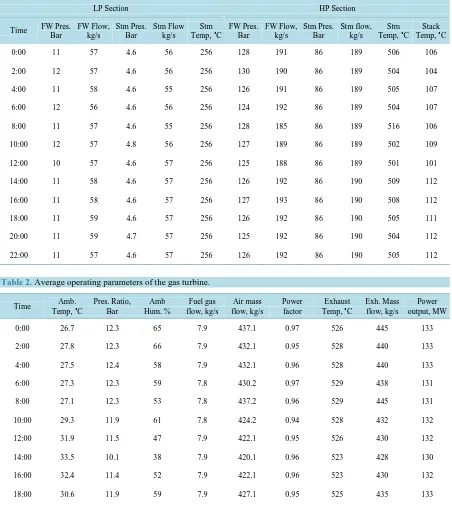
Table 1. Average operating parameters of the HRSG.
LP Section HP Section
Time FW Pres. Bar FW Flow, kg/s Stm Pres. Bar Stm Flow kg/s Stm
Temp, ˚C FW Pres. Bar
FW Flow, kg/s Stm Pres. Bar Stm flow, kg/s Stm
Temp, ˚C Temp, ˚C Stack
0:00 11 57 4.6 56 256 128 191 86 189 506 106
2:00 12 57 4.6 56 256 130 190 86 189 504 104
4:00 11 58 4.6 55 256 126 191 86 189 505 107
6:00 12 56 4.6 56 256 124 192 86 189 504 107
8:00 11 57 4.6 55 256 128 185 86 189 516 106
10:00 12 57 4.8 56 256 127 189 86 189 502 109
12:00 10 57 4.6 57 256 125 188 86 189 501 101
14:00 11 58 4.6 57 256 126 192 86 190 509 112
16:00 11 58 4.6 57 256 127 193 86 190 508 112
18:00 11 59 4.6 57 256 126 192 86 190 505 111
20:00 11 59 4.7 57 256 125 192 86 190 504 112
[image:5.595.89.539.386.622.2]22:00 11 57 4.6 57 256 126 192 86 190 505 112
Table 2. Average operating parameters of the gas turbine.
Time Temp, Amb. ˚C Pres. Ratio, Bar Hum. % Amb flow, kg/s Fuel gas flow, kg/s Air mass Power factor Temp, Exhaust ˚C Exh. Mass flow, kg/s output, MW Power
0:00 26.7 12.3 65 7.9 437.1 0.97 526 445 133
2:00 27.8 12.3 66 7.9 432.1 0.95 528 440 133
4:00 27.5 12.4 58 7.9 432.1 0.96 528 440 133
6:00 27.3 12.3 59 7.8 430.2 0.97 529 438 131
8:00 27.1 12.3 53 7.8 437.2 0.96 529 445 131
10:00 29.3 11.9 61 7.8 424.2 0.94 528 432 132
12:00 31.9 11.5 47 7.9 422.1 0.95 526 430 132
14:00 33.5 10.1 38 7.9 420.1 0.96 523 428 130
16:00 32.4 11.4 52 7.9 422.1 0.96 523 430 132
18:00 30.6 11.9 59 7.9 427.1 0.95 525 435 133
20:00 28.9 12.1 65 7.9 432.1 0.96 525 440 133
The logarithmic mean temperature difference is estimated from the following equation;
(
) (
)
ln
gi we ge wi
gi we ge wi
T T T T
(
)
(
)
(
(
)
)
components
max
Actual heat transfer rates Max. possible heat transfer rate
LP HRSG
s pw wout win s out in
g pg gin gout g pg gin gout
Q Q
m C T T LP
m h h LP
m C T T m C T T
ε = =
− − = = − − (3)
(
)
(
)
(
(
)
)
components max Actual heat transfer rates Max. possible heat transfer rate HP HRSG s pw wout win s out in g pg gin gout g pg gin gout Q Q m C T T HP m h h HP m C T T m C T T ε = = − − = = − − (4)2.2. Heat Duty Calculation Model
The first step to simulate the HRSG performance is to balance the mass and energy transfer between the hot and cold streams (gas side and water/steam side) on different heat exchanger when the designed parameters (the flow rate, temperature, pressure of superheated steam and outlet temp of the exhaust gases, the heat duty) can be obtained (Ahmadi P. and Dincer I. [25]). The heat duty of the HRSG elements and the exhaust gas were mod-eled using the below energy equations. Energy balance can be expressed as follows;[
]
[
]
T SH EVA EC HP SH EVA EC LP Q = Q +Q +Q + Q +Q +Q (5)(
QSH)
HP =QSH1HP +QSH2HP+QSH3HP (6)(
)
1HP 1 2 SH s g pg g g Q =m =m C T −T (7)(
)
(
)
2HP 15 14 2 3 SH s HP g pg g g Q =m h −h =m C T −T (8)(
)
(
)
3HP 14 13 3 4 SH s HP g pg g g Q =m h −h =m C T −T (9)(
QEVA)
HP =m hs(
12−h11)
HP =m Cg pg(
Tg4−Tg5)
(10)(
QEC)
HP =QEC1HP +QEC2HP +QEC3HP (11)(
)
(
)
1HP 10 9 5 6 EC w HP g pg g g Q =m h −h =m C T −T (12)(
)
(
)
2HP 9 8 6 7 EC w HP g pg g g Q =m h −h =m C T −T (13)(
)
(
)
3HP 8 7 7 8 EC w HP g pg g g Q =m h −h =m C T −T (14)(
QSH)
LP =m hs(
6−h5)
LP =m Cg pg(
Tg8−Tg9)
(15)(
QEVA)
LP=m hs(
4−h3)
LP =m Cg pg(
Tg9−Tg10)
(16)(
QEC)
LP=mw(
h2−h1)
LP =m Cg pg(
Tg10−Tg11)
(17)The temperature of the gas leaving the high pressure evaporator 11 sHP PP T =T +T (18)
(
)
(
8)
11g pg g g
sLP
ss s LP
m C T T
m
h h
− =
− (20)
3. Results and Discussions
The result from the direct observation and measurement of the operating parameters of the HRSG, including da-ta from the log book for the period under consideration are recorded in Table 1. These give detail of an average daily reading recorded from the human machine interface (HMI). The data include the feed water pressure, feed water temperature, feed water mass flow, steam pressure, steam temperature, stack temperature and steam mass flow for the low and high pressure levels, while Table 2 show the average operating data of the gas turbine plant for the period under consideration. The data measured include the ambient temperature, pressure, humidity, fuel gas flow rate, exhaust gas mass flow.
The Experiment platform was done through direct data monitoring on the human machine interface (HMI). See Appendix I for the experimental screen shot.
Hysys simulator was used to model the temperature gradient across the various heat exchanging units of the HRSG after several iterations. This gave the preliminary process of flow diagram, mass and energy balance at various gas turbine exhaust gas temperature and mass flow rate. For the normal operating mode; part load and base load, Tables 3-7 gives the heat exchange properties and performance detail.
A numerical method (MATLAB software) was also used to simulate the steam pressure, temperature, steam quality, effectiveness, and heat flux distribution for predicting the performance of the HRSG.
To calculate the performance of the heat exchangers in the HRSG in MATLAB, optimum performance was determined by sensitivity analyses of the varied parameters.
The optimum mode was modeled via sensitivity study by varying exhaust gas temperature and mass flow, steam pressure, steam flow from measurement.
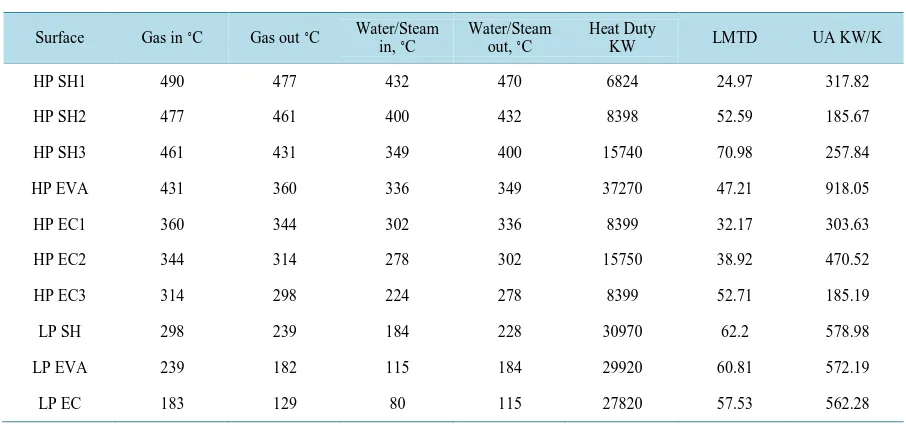
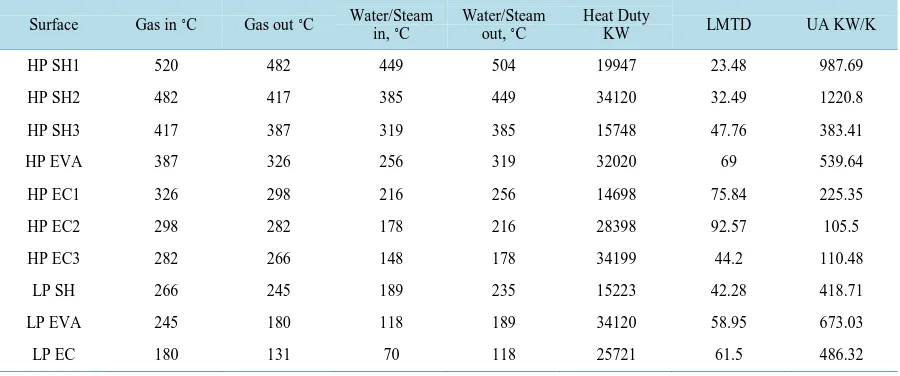
Tables 3-7 show the results of the modeled equations using MATLAB program. The model gave the heat du-ty, log mean temperature difference, the heat transfer coefficient for the heating surfaces of the HRSG at exhaust gas temperature of 490˚C, 500˚C, 510˚C, 520˚C, and 526˚C respectively.
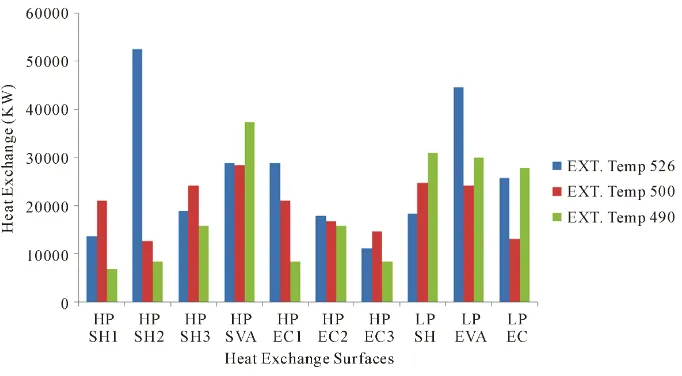
The results in Tables 3-7 were plotted as shown in Figures 1-3. The figures show the behavior of the heating elements in the HRSG. The heat duty of the element is plotted at different gas turbine exhaust gas temperature as shown in Figure 1. This give the various heat absorbed capacity of the heating surfaces of the HRSG. Figure 2 gave the heat exchange trend within the HRSG system, while Figure 3 show the plot of the total heat ex-change at different exhaust gas temperature of the gas turbine.
[image:7.595.86.539.508.721.2]Tables 8-11 show the results of the simulation for the exhaust gas temperature, HRSG effectiveness, steam
Table 3. HRSG performance analysis at exhaust gas temperature of 490˚C.
Surface Gas in ˚C Gas out ˚C Water/Steam in, ˚C Water/Steam out, ˚C Heat Duty KW LMTD UA KW/K
HP SH1 490 477 432 470 6824 24.97 317.82
HP SH2 477 461 400 432 8398 52.59 185.67
HP SH3 461 431 349 400 15740 70.98 257.84
HP EVA 431 360 336 349 37270 47.21 918.05
HP EC1 360 344 302 336 8399 32.17 303.63
HP EC2 344 314 278 302 15750 38.92 470.52
HP EC3 314 298 224 278 8399 52.71 185.19
LP SH 298 239 184 228 30970 62.2 578.98
LP EVA 239 182 115 184 29920 60.81 572.19
Table 4. HRSG performance analysis at exhaust gas temperature of 500˚C.
Surface Gas in ˚C Gas out ˚C Water/Steam in, ˚C Water/Steam out, ˚C Heat Duty
KW LMTD UA KW/K
HP SH1 500 460 370 450 20990 68.06 107.63
HP SH2 460 436 356 370 12590 84.9 172.43
HP SH3 436 390 330 356 24150 67.29 417.33
HP EVA 450 395 284 330 28350 49.33 668.31
HP EC1 390 336 254 284 20990 38.77 509.66
HP EC2 336 298 224 254 16790 41.97 465.19
HP EC3 298 264 200 224 14690 37.97 449.93
LP SH 264 236 150 194 24670 45.88 625.19
LP EVA 236 200 120 150 24150 46.41 605.05
[image:8.595.89.536.316.505.2]LP EC 163 119 85 120 13120 38.32 398.07
Table 5. HRSG performance analysis at exhaust gas temperature of 510˚C.
Surface Gas in ˚C Gas out ˚C Water/Steam in, ˚C Water/Steam out, ˚C Heat Duty
KW LMTD UA KW/K
HP SH1 510 455 435 503 28871 12.38 271.1
HP SH2 455 439 406 435 8398.7 25.96 376.19
HP SH3 439 414 358 406 13123 43.49 350.86
HP EVA 414 388 336 358 13648 53.98 294.02
HP EC1 388 366 304 336 11548 56.85 236.18
HP EC2 366 314 266 304 27296 54.71 580.23
HP EC3 314 288 192 266 13648 69.25 229.17
LP SH 288 254 164 220 17847 78.49 264.41
LP EVA 254 170 136 164 44093 57.53 891.24
LP EC 170 120 90 132 26246 33.84 901.78
Table 6. HRSG performance analysis at exhaust gas temperature of 520˚C.
Surface Gas in ˚C Gas out ˚C Water/Steam in, ˚C Water/Steam out, ˚C Heat Duty KW LMTD UA KW/K
HP SH1 520 482 449 504 19947 23.48 987.69
HP SH2 482 417 385 449 34120 32.49 1220.8
HP SH3 417 387 319 385 15748 47.76 383.41
HP EVA 387 326 256 319 32020 69 539.64
HP EC1 326 298 216 256 14698 75.84 225.35
HP EC2 298 282 178 216 28398 92.57 105.5
HP EC3 282 266 148 178 34199 44.2 110.48
LP SH 266 245 189 235 15223 42.28 418.71
LP EVA 245 180 118 189 34120 58.95 673.03
[image:8.595.89.539.532.720.2]Table 7. HRSG performance analysis at exhaust gas temperature of 526˚C.
Surface Gas in ˚C Gas out ˚C Water/Steam in, ˚C Water/Steam out, ˚C Heat Duty
KW LMTD UA KW/K
HP SH1 526 500 460 490 13640 26.88 590.06
HP SH2 500 486 420 460 52489 51.92 162.35
HP SH3 486 450 375 420 18897 70.41 312.1
HP EVA 450 395 350 375 28871 58.72 571.63
HP EC1 395 340 294 330 28871 54.95 441.62
HP EC2 340 306 266 294 17847 42.93 483.4
HP EC3 306 285 189 266 11023 63.97 200.38
LP SH 285 250 180 240 18372 56.58 377.55
LP EVA 250 165 135 180 44618 64.87 799.76
LP EC 165 116 70 135 25721 57.98 515.86
[image:9.595.84.538.99.514.2]Figure 1. Absorbed heat distribution profile across the heating surfaces.
[image:9.595.144.485.518.706.2]Figure 3. Total heat exchange in HRSG at different gas turbine exhaust temperature.
Table 8. Exhaust gas temp and turbine work at different pressure ratio.
Pressure Ratio TIT avg. ˚C Exh. Gas Temp ˚C Turbine Work (MW)
11 970 579 210
12 970 568 216
13 970 559 221
14 970 550 225
15 970 543 229
Table 9. HRSG effectiveness at different exhaust gas temperature.
HRSG Heating Surfaces
Effectiveness
526˚C 520˚C 510˚C 490˚C
HPSH1 0.7135 0.7769 0.8072 0.9743
HPSH2 0.6727 0.8877 0.7963 0.5591
HPSH3 0.5454 0.9061 0.7973 0.6126
HPEVA 0.3364 0.647 0.3795 0.1841
HPEC1 0.4795 0.4848 0.5725 0.7887
HPEC2 0.5091 0.426 0.5113 0.4892
HPEC3 0.8854 0.3012 0.8161 0.8072
LPSH 0.252 0.2635 0.1992 0.1702
LPEVA 0.1726 0.2465 0.1046 0.2454
LPEC 0.2091 0.1924 0.2315 0.1729
Table 10. HRSG effectiveness at different steam pressure.
Steam Pressures bar Effectiveness
LP (250˚C) HP (510˚C) LP HP
4 80 0.5397 0.3763
6 100 0.5389 0.3717
8 120 0.5373 0.3670
10 140 0.5356 0.3621
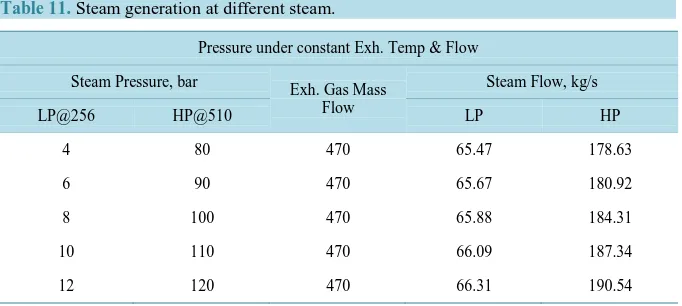
[image:10.595.145.483.389.579.2] [image:10.595.145.485.607.716.2]Table 11. Steam generation at different steam.
Pressure under constant Exh. Temp & Flow
Steam Pressure, bar Exh. Gas Mass
Flow
Steam Flow, kg/s
LP@256 HP@510 LP HP
4 80 470 65.47 178.63
6 90 470 65.67 180.92
8 100 470 65.88 184.31
10 110 470 66.09 187.34
12 120 470 66.31 190.54
generation analysis. The simulations were done by varying the parameters at various operating conditions. The modeled functions were the effectiveness at different steam pressure, effectiveness at different exhaust gas tem-perature, steam generation at different, exhaust gas flow and different steam pressure.
Figure 1, Figure 2 and Tables 3-7 show the absorbing capacity of the various heating element of the HRSG. The results give the amount of heat exchange in the superheater, economizer, and evaporator in both the low pressure and high pressure sections respectively. The plots show that HPSH2 had the highest heat exchange when the gas turbine exhaust gas temperature is 526˚C. At the exhaust gas temperature of 500˚C, the HPEVA had the highest heat exchange. The HPEVA give the same result when the exhaust gas temperature was at 520˚C and 490˚C reflectively. While when the exhaust gas temperature was 510˚C, the highest heat exchange occurred in the LPEVA.
From Figure 3, the amount of heat absorbed increased as the exhaust gas increased. This shows that the tem-perature gradient of the exhaust gas of the gas turbine imparted greatly on the energy efficiency of the HRSG. The result shows that between 490˚C and 526˚C, the temperature difference was 36˚C and there is a percentage increase in the heat absorbed of about 37.39%. This represents an increase in heat absorption of 1.04% for every 1˚C increase in the gas turbine exhaust gas temperature at constant flow.
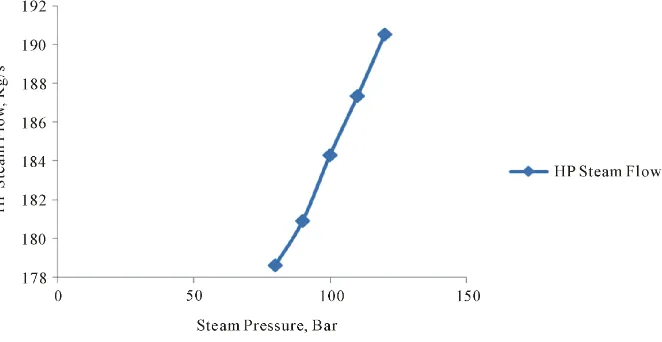
Table 11and Figure 4, Figure 5, showed the steam generated by varying the steam pressure at constant steam temperature and exhaust gas mass flow for the LP and HP sections. The LP steam pressure variation was carried out at 256˚C and 470 kg/s, while the HP was done at 510˚C and 470 kg/s. The result show that as the steam pressure increased from 4 bar to 12 bar for the LP and 80 bar to 120 bar for the HP, there exist a percen-tage increase in the steam generation of about 0.21% and 0.07% for the LP and HP respectively. This analysis represent that for every 1˚C increase in the steam pressure under the various consideration, the steam generation increased by 0.11% and 0.30% for the LP and HP section respectively.
It also shows the effectiveness of the HRSG LP and HP at different steam generation. The result indicated that for every 40 kg/s increase in the steam flow, the system effectiveness improved by about 13.3% in the LP sec-tion. The HP section shows that as the steam flow increased by 110 kg/s, the effectiveness of the system im-proved by 0.18%. The research indicated that the system effectiveness for the low pressure and high pressure level at different steam pressure. The result shows that as the steam pressure increased by 1bar, the effectiveness of the system decrease slightly by about 0.073%.
Table 9 and Figure 6 showed the effectiveness of the heating surface at different gas turbine exhaust gas temperatures. It indicates that at 526˚C, the HPSH1 show the highest effectiveness in heat exchange. At 520˚C, HPSH3 effectiveness was about 91%, while at 510˚C and 490˚C, HPSH1 gave about 80% and 97% respectively. This represents that the heat exchange efficiency could be optimum at higher exhaust gas temperature and high-er mass flow.
Figure 4. HP Steam generation at different steam pressure at constant exhaust gas flow.
Figure 5. LP Steam generation at different steam pressure at constant exhaust gas flow.
[image:12.595.145.488.489.695.2]4. Conclusions
The work revealed the various parameters and energy based equations used in assessing the heat duty and effec-tiveness of the HRSG at various operating condition of the gas turbine exhaust in order to sustain its perfor-mance.
The sensitivity study carried out by varying the operating parameters, such as mass flow, steam pressure, ex-haust gas temperature was analysed and the impact on the HRSG performance evaluated. The results for both the optimum mode and normal mode were compared. It provides a good improvement in the performance, espe-cially in steam generation and heat exchange capacity. With this analysis, a predictive temperature distribution profile across the heating surfaces of the HRSG was established.
References
[1] Casarosa, F., Donatin, C. and Franco, A. (2004) Thermoeconomic Optimization of Heat Recovery Steam Generator Operating Parameters for Combined Plant. Energy, 29, 389-413. http://dx.doi.org/10.1016/S0360-5442(02)00078-6
[2] Lebele-Alawa, B.T., Hart, H.T., Ogaji, S.O.T. and Probert, S.D. (2008) Rotor-Blades’ Profile Influence on a Gas Tur-bine’s Compressor Effectiveness. Applied Energy, 85, 494-505. http://dx.doi.org/10.1016/j.apenergy.2007.12.001
[3] Lebele-Alawa, B.T. (2010) Axial Thrust Responses due to a Gas Turbine’s Rotor Blade Distortions Journal of
Engi-neering Physics and Thermophysics, 83, 991-994. http://dx.doi.org/10.1007/s10891-010-0423-2
[4] Lebele-Alawa, B.T. and Egwanwo, V. (2012) Numerical Analysis of the Heat Transfer in Heat Exchangers.
Interna-tional Journal of Applied Science and Technology, 2, 60-64.
[5] Ganapathy, V. (2001) Optimize Energy Efficiency of the Heat Recovery Steam Generator. Power Engineering Article, 105. http://www.power-eng.com/articles/print/volume-
[6] Ongiro, A., Ugursal, V.I., Al Taweel, A.M. and Walker, J.D. (1997) Modeling of Heat Recovery Steam Generator Per- formance. Applied Thermal Engineering, 16, 427-444. http://dx.doi.org/10.1016/S1359-4311(96)00052-X
[7] Franco, A. and Russo, A. (2002) Combined Cycle Plant Efficiency Increase Based on the Optimization of Heat Recov-ery Steam Generator Operating Parameter. International Journal of Thermal Science, 41, 841-850.
http://dx.doi.org/10.1016/s1290-0729(02)01378-9
[8] Reddy, B.V., Ramkiran, G., Kumar, K.A. and Nag, P.K. (2002) Second Law Analysis of a Waste Heat Recovery Steam Generator. International Journal of Heat and Mass Transfer, 45, 1807-1814.
http://dx.doi.org/10.1016/S0017-9310(01)00293-9
[9] Subhramanyam, N., Rajaram, S. and Kamalnathan, N. (1995) HRSGs for Combined Cycle Power plants. Heat
Recov-ery System & CHP, 15, 153-161. http://dx.doi.org/10.1016/0890-4332(95)90022-5
[10] Dumont, M.N. and Heyen, G. (2004) Mathematical Modeling and Design of an Advanced Once through Heat Recov-ery Steam Generator. Computers and Chemical Engineering, 28, 651-660.
http://dx.doi.org/10.1016/j.compchemeng.2004.02.034
[11] Valdés, M., Durán, M.D. and Rovira, A. (2003) Thermoeconomic Optimist of Combined Cycle Gas Trubine Power Plants Using Genetic Algorithms. Applied Thermal Engineering, 23, 2168-2180.
http://dx.doi.org/10.1016/S1359-4311(03)00203-5
[12] Mohammad, T.M., Pouria, A., Abdolsaeid, G.K. and Mohammad, N.M.J. (2012) Exergetic and Economic Evaluation of the Effect of HRSG Configurations on the Performance of Combined Cycle Power Plants. Journal of Energy
Con-version and Management, 58, 47-58.
[13] Attala, L., Facchini, B. and Ferrara, B. (2001) Thermo Economic Optimization Method as Design Tool in Gas Steam Combined Plant Realisation. Energy Conversation and Management, 42, 2163-2172.
http://dx.doi.org/10.1016/S0196-8904(00)00129-1
[14] Bassily, A.M. (2007) Analysis and Cost Optimization of the Triple-Pressure Steam-Reheat Gas Reheat Gas-Recupe- rated Combined Power Cycle. International Journal of Energy Research, 32, 116-135.
http://dx.doi.org/10.1002/er.1338
[15] Srinivas, T. (2009) Study of a Deaerator Location in Triple Pressure—Reheat Combined Power Cycle. Energy, 34, 1364-1371. http://dx.doi.org/10.1016/j.energy.2009.05.034
[16] Mohagheghi, M. and Shayegan, J. (2009) Thermodynamic Optimization of Design Variable and Heat Exchanger Layout in HRSGs for CCGT, Using Genetic Algorithm. Applied Thermal Engineering, 29, 290-298.
http://dx.doi.org/10.1016/j.applthermaleng.2008.02.035
http://dx.doi.org/10.1016/j.energy.2012.04.043
[18] Manassaldi, J.I. and Scenna, N.J. (2011) Optimal Synthesis and Design of Heat Recovery Steam Generation (HRSG) via Mathematical Programming. Energy, 36, 475-485. http://dx.doi.org/10.1016/j.energy.2010.10.017
[19] Alus, M.M. and Petrovic, M.V. (2012) Optimization of Parameters for Heat Recovery Steam Generator (HRSG) in Combined Cycle Plants. Thermal Science, 16, 901-914. http://dx.doi.org/10.2298/TSCI120517137A
[20] Ghazi, M., Ahmadi, P., Stotoodeh, A.F. and Taherkhani, A. (2012) Modeling and Thermo-Economic Optimization of Heat Recovery Heat Exchanger Using a Multimodal Genetic Algorithm. Energy Conservation and Management, 58, 149-156. http://dx.doi.org/10.1016/j.enconman.2012.01.008
[21] Vytla, V.V.S.K. (2005) Thesis on CFD Modeling of Heat Recovery Steam Generator and Its Components Using Fluent. College of Engineering, University of Kentucky, Lexington.
[22] Lebele-Alawa, B.T. and Asuo, J.M. (2011) Exergy Analysis of Kolo Creek Gas Turbine Plant. Canadian Journal of
Mechanical Science and Engineering, 2, 172-184.
[23] Lebele-Alawa, B.T. and Jo-Appah, V. (2015) Thermodynamic Performance Analysis of a Gas Turbine in an Equatorial Rain Forest Environment. Journal of Power and Energy Engineering, 3, 11-23.
http://dx.doi.org/10.4236/jpee.2015.31002
[24] Ahmadi, P., Hajadollahi, H. and Dincer, I. (2011) An Exergy-Based Multi-Objective Optimization of a Heat Recovery Steam Generator (HRSG) in a Combined Cycle Power Plant (CCPP) Using Evolutionary Algorithm. International
Journal of Green Energy, 8, 44-64. http://dx.doi.org/10.1080/15435075.2010.529779
[25] Ahmadi, P. and Dincer, I. (2011) Thermodynamic Analysis and Thermoeconomic Optimization of a Dual Pressure Combined Cycle Power Plant with a Supplementary Firing Unit. Energy Convers Manage, 52, 296-308.
Nomenclature
QSHLP Heat Duty of the Superheater Low Pressure Section kW
QEVALP Heat Duty of the Evaporator in Low Pressure Section kW
QECLP Heat Duty of the Economizer in Low Pressure Section kW
Qav Heat Content of the Exhaust Gas kW
Qdb Heat Rate of the Duct Burner kW
Qmax Maximum Possible Heat Transfer Rate kW
Tg1-11 Exhaust Gas Temperature across the Heating Surfaces ˚C
TPP Pinch Point ˚C
TAP Approach Point ˚C
TS Saturation Temperature ˚C
T3 Turbine Inlet Temperature ˚C
T4 Exhaust Gas Temperature ˚C
Tgin Exhaust Gas Temperature into the Heating Surface ˚C Tgout Exhaust Gas Temperature out of the Heating Surface ˚C Twin Feed Water/Steam Temperature into the Heating Surface ˚C Twout Feed Water/Steam Temperature out of the Heating Surface ˚C
U Overall Heat Transfer Coefficient kW/m2
εHRSGLP Effectiveness of the components in the HRSG Low Pressure Section εHRSGHP Effectiveness of the components in the HRSG High Pressure Section
ηGT Turbine Isentropic Efficiency %
AT Total Heat Transfer Area m2
Cpg Specific Heat Capacity of Exhaust Gas kJ/kgK
Cps Specific Heat Capacity of Steam kJ/kgK
Cpw Specific Heat Capacity of Water kJ/kgK
f Correction Factor
h1-11 Enthalpy of Steam across the HRSG kJ/kg
hss Enthalpy of Superheated Steam kJ/kg
hs Enthalpy of Saturated Steam kJ/kg
LHV Lower Heating Value of Fuel kJ/kg
LMTD Log Mean Temperature Difference
mg Exhaust Gas Mass Flow kg/s
mw Feed Water Mass Flow kg/s
msHP Steam Flow in HP section kg/s
msLP Steam Flow in LP Section kg/s
Q(SH1-3)HP Heat Duty across the Superheaters In High Pressure Section kW
QEVAHP Heat Duty of the Evaporator in High Pressure Section kW
Q(EC1-3)HP Heat Duty of the Economizers in High Pressure Section kW
S.H Superheater