Using input-output to measure the GDP
and to estimate monthly growth rates of
productive complexes: the case of the
Brazilian agribusiness
Furtuoso, Maria Cristina Ortiz and Guilhoto, Joaquim José
Martins
Universidade de São Paulo
2000
Online at
https://mpra.ub.uni-muenchen.de/54316/
Rates of Productive Complexes: The Case of the Brazilian Agribusiness
Maria Cristina Ortiz Furtuoso2
Joaquim José Martins Guilhoto3
Paper Presented at the
13TH International Conference on Input-Output Techniques
Macerata, Italy August 21-25, 2000
Abstract
Through the use of input-output analysis tools, like backward and forward linkages (Hirschman-Rasmussen and Pure), it was possible to delineate which are the sectors that belong to the Brazilian Agribusiness. From the definition of the sectors and using the Brazilian input-output tables it was possible to measure the GDP of Brazilian Agribusiness which were estimated to be around 27% of the Brazilian GDP in 1999. The GDP of the Agribusiness was also estimated for two major complexes: a) Vegetal Products and b) Animal Products. Each of the Agribusiness complexes was divided into four components: a) inputs to agriculture; b) agriculture; c) agriculture based industry; and d) final distribution. To estimate the monthly growth rates of the Agribusiness it was used on one hand the input-output tables to estimate the weight of each sector in the complex and on the other hand it was used a series of economic indexes (price and quantity) available for the Brazilian economy. It is important to stress that the measure of the monthly growth rates of the Agribusiness GDP was done taking into consideration the income side of agriculture, i.e., we have tried to make the growth rates sensible to real price as well as real quantity changes, given that the quarterly estimates of the Brazilian Government Statistical Institute (IBGE) are given taken into consideration only growth rates into agricultural production, as so we do believe that the monthly growth rates that we have obtained are much more representative of what happen in the Brazilian Agriculture and Agribusiness than the ones released by IBGE.
Key Words: Brazilian Agribusiness, Input-Output, GDP.
1 The results presented here are part of a bigger project that is being conduct at the Center for Advanced Studies
in Applied Economics at the University of São Paulo (CEPEA-USP) under the financial support of the Brazilian National Confederation of Agriculture (CNA) and which is direct to study the role of the Agribusiness in the Brazilian economy as a whole as well as in its States.
2 University of São Paulo, Brazil. E-mail: mcofurtu@carpa.ciagri.usp.br
3 University of São Paulo, Brazil and REAL, University of Illinois, USA. E-mail: guilhoto@usp.br. This author
1.
I
NTRODUCTIONThe Gross Domestic Product (GDP) is one of the main aggregates of the National Accounts and it is an indicator used to express an economy growth, scooping all of its sectors, namely, the production of all services and final goods within the boundaries of the country in a given period (FIBGE, 1989).
Because it is a relevant indicator of the economic activity, the announcement of the GDP growth rates of the economy and of its different sectors is always anxiously expected by all.
Nonetheless, the growth rates of GDP, in value terms, estimated by the Brazilian Government Statistical Institute (IBGE), are only given in annual terms with a time lag of approximately 8 months. The quarterly estimates of GDP growth rates, also made by IBGE, are indexes of quantity announced with a time lag of approximately 45 days.
On the other hand, in the past decades the agricultural and animal sectors went through important structural transformation, going from almost isolated sectors to a great integration with the other sectors in the economy. Today these sectors are completely integrated in a market economy, with the formation of complex warehousing, processing, industrialization and distribution networks. In this new agricultural productive structure, with growing ties in the agriculture/industry/services relationship, agriculture is no longer a distinct economic sector but it is integrated in a new industrial production dynamics called Agribusiness.
As a result of such phenomenon, in which the technological, productive and financial relationships are gradually intensified, one felt that the structure of the Brazilian Agribusiness should be measured and evaluated from a systemic perspective. This paper tries to provide a better understanding of the agriculture under such a new economic context.
Thus, this paper through Agribusiness GDP estimates is direct to allow an economic evaluation of the Agricultural sector role in the economy such that it can be used to aid sectorial policy planning, management of the agroindustrial complex, as well as to detect fundamental elements of such new agricultural scheme in order to assist farmers as well as economic agents.
that in conjunction with indexes of price and quantity found in the Brazilian economy can generate monthly growth rates estimates, in value terms, of the Agribusiness GDP.
In the next section it is presented the methodology used in this paper, the third section presents an analysis of the structure of the Brazilian Agribusiness in the 1994-1999 period while the monthly growth rates estimates for the first 4 months or 2000 are presented in the fourth section. The final comments are made in the last section.
2.
M
ETHODOLOGICALN
OTEThe Agribusiness estimation, done in this paper for the Brazilian economy, is also done for its two major complexes: Vegetal and Animal.4
The total GDP value of the Agribusiness in each complex will also be divided into 4 aggregates: I) inputs; II) the sector itself; III) industrial processing; and IV) distribution and services.
The procedure adopted to estimate the Brazilian Agribusiness GDP is through the scope of the Product, i.e., by estimating the value added at market prices.
The value added at market prices is given by the sum of the value added at basic prices with indirect net taxes less the financial dummy, resulting in:
VAPM = VAPB + IIL – DuF (1)
where:
VAPM = Value added at market prices
VAPB = Value added at basic prices
IIL = Indirect net taxes
DuF = Financial dummy
To estimate the GDP of Aggregate I (input for vegetal and animal production) one uses the information available in the input-output tables regarding the input values acquired by the Vegetal and Animal sectors. The columns with input values are multiplied by the respective coefficient of value added (CVAi).
The Coefficients of the Value Added per sector (CVAi) are obtained by dividing the
Value Added at Market Prices (VAPM
CVA VA X i
PM
i
i
= (2)
Thus, the double-counting issue presented by previous Agribusiness GDP estimates when input values were considered, instead of the value added effectively generated is eliminated. In that sense the GDP of the Aggregate I is given by:
GDPI zik CVAi
i
k =
=
∑
*1 43
(3)
k = 1, 2 vegetal and animal sectors
i = 1, 2, ..., 43 remaining sectors
where:
GDPI
k= GDP of aggregate I (input) for vegetal (k=1) and animal (k=2)
zik = total input value of sector i for either vegetal or animal
CVAi= value added coefficient of sector i
For the total Aggregate I we have:
GDPI =GDPI +GDPI
1 2 (4)
where:
GDPI= GDP of aggregate I
and the other variables are as previously defined.
The estimates for the Aggregate II (the sector itself, vegetal and animal) considers the
value added generated by the respective sectors, subtracting the values used as input from the value added of these sectors, thus the double-counting issue, found in the previous Agribusiness GDP estimates, is again eliminated. Then one has:
GDP VA z CVA
k
II PM ik i
i
k = k −
=
=
∑
* ,1 43
1 2
(5)
where:
GDPII
k= GDP of aggregate II for vegetal (k=1) and animal (k=2)
and the other variables are as previously defined.
For the total Aggregate II we have:
GDPII =GDPII1 +GDPII2 (6)
where:
GDPII= GDP of aggregate II
and the other variables are as previously defined.
To define the composition of the Aggregate III (agriculture based industries) several indicators were adopted, as for instance: a) the main demanding sectors of agricultural products obtained by input-output matrix estimation; b) the participation of agricultural input in the intermediate consumption the agroindustrial sectors; and c) the economic activities carrying out the first, second and third transformation of agricultural raw materials. In this way, the agriculture based industries will consist of the following activities: i) Wood and Wood Products; ii) Pulp, Paper and Printing; iii) Processing of Chemical Elements (Alcohol); iv) Textile; v) Clothing; vi) Footwear, Leather and Skins; vii) Coffee Industry; viii) Vegetal Products Processing; ix) Animal Slaughtering; x) Dairy Industry; xi) Sugar Industry; xii) Vegetal Oil Processing; and xiii) Other Food Products.
Therefore, aggregates II and III express the income (value added) generated by these segments. The input-output matrix data for 1995 shows that out of the total output of vegetal and animal production for intermediary purposes, 21.8% is absorbed by the rural sector, 71.8% is sold to the agriculture based industries and only 6.4% is designated to the remaining sectors.
In the estimation of Aggregate III (Agriculture Based Industries) one adopted the
summation of the value added generated by the agroindustrial sectors subtracted from the value added of these sectors that have been used as input in the Aggregate II. As previously mentioned, this subtraction is done to eliminate the double-counting found in previous Agribusiness GDP estimates, as so, one has that:
GDP VA z CVA
k
III PM qk q
q k
k = q −
=
∑
*,
e
j
ε 1 2
(7)
where:
GDPIII
k= GDP of aggregate III for vegetal (k=1) and animal (k=2)
and the other variables are as previously defined. For the total Aggregate III we have:
GDPIII =GDPIII +GDPIII
1 2 (8)
where:
GDPIII= GDP of aggregate III
and the other variables are as previously defined.
In the case of Aggregate IV, regarding the Final Distribution, one considers the
aggregated value of the Transportation, Commerce and Service sectors. Out of the total value obtained for these sectors only the part corresponding to the share of the agricultural and agroindustrial products is designated to the Agribusiness in the final product demand. The approach adopted in the estimation of the final distribution value of the industrial agribusiness can be represented by:
DFG−IILDF −PIDF = DFD (9)
VATPM +VACPM +VASPM = MC (10)
GDP MC
DF DF
DFD k
IV
k q
q k
k =
+
=
∈
∑
*, 1 2
(11)
where:
DFG = global final demand
IILDF= indirect net taxes paid by the final demand
PIDF= imported products by the final demand
DFD = domestic final demand
VATPM = value added of the transportation sector at market prices
VACPM = value added of the commerce sector at market prices
VASPM = value added of the service sector at market prices
MC = trading margin
DFk = final demand of vegetal (k=1) and animal (k=2)
DFq = final demand of the agroindustrial sectors
GDPIV
k= GDP of aggregate IV for vegetal (k=1) and animal (k=2)
GDPIV =GDPIV +GDPIV
1 2 (12)
where:
GDPIV= GDP of aggregate IV
and the other variables are as previously defined.
The Agribusiness GDP for each sub-complex is given by the sum of its aggregates as:
GDPAgribu ess GDPI GDPII GDPIII GDPIV
k k k k k
sin = + + + (13)
where:
GDPAgribu ess
k
sin = GDP of the agribusiness for vegetal (k=1) and animal (k=2) and the other variables are as previously defined.
The total Agribusiness GDP is given by:
GDPAgribusiness =GDPAgribusiness1+GDPAgribusiness2 (14)
where:
GDPAgribusiness= Agribusiness GDP
and the other variables are as previously defined.
The methodology described above can be showed as a scheme (Figure 1), which presents the process of reaching the Agribusiness GDP. The Agribusiness GDP is then observed to be obtainable both by the weighed sum of the aggregates GDP and by the weighed sum of the GDP of Vegetal and Animal.
Vegetal
Dist. & Serv. Industry
Input
Industry
Input Animal
Total Agribusiness GDP
Vegetal
Agribusiness GDP Agribusiness GDPAnimal
Vegetal Animal
Animal Dist. and Serv.
Animal Industry
Vegetal Dist. and Serv.
Vegetal Industry
Vegetal
Inputs AnimalInputs Total AgricultureInputs Dist. & Serv.
Total Agribusiness GDP Total Agriculture
Total Agriculture Industry
[image:9.595.106.486.80.516.2]Total Agriculture Dist. and Serv.
Figure 1. Obtaining the Agribusiness GDP
3.
T
HEB
RAZILIANA
GRIBUSINESS,
1994
TO1999
The results of the Brazilian Agribusiness point out the importance that such complex has played in the national economy, accounting for approximately 27% of the GDP in 1999.
28.97 28.61 27.42 26.23 26.41 26.93
0 5 10 15 20 25 30 35
%
1994 1995 1996 1997 1998 1999
Year
[image:10.595.91.508.78.348.2]Source: CNA/CEPEA-USP Research Data
Figure 2. Share of the Total Agribusiness in the Brazilian GDP – 1994 to 1999
The GDP of the Brazilian Agribusiness for 1999 was estimated to be R$269,5 billions, with a real growth of 1.85% in relation to 1998 (Table 1). Such growth, in comparison with the 1994-1999 period, can be seen as the second best performance of the period (Figure 3).
Table 1. Agribusiness and Brazilian GDP at Market Prices. 1994-1999 (Thousand R$ of 1999)
Year Agribusiness GDP Brazilian GDP Share of the
Agribusiness GDP (%)
1994 262,135,138 904,759,152 28.97
1995 269,784,951 942,974,312 28.61
1996 265,410,370 968,044,130 27.42
1997 263,060,940 1,002,914,968 26.23
1998 264,580,605 1,001,666,424 26.41
1999 269,467,715 1,000,664,758 26.93
[image:10.595.67.526.551.662.2]2.92
-1.62
-0.89
0.58
1.85
-2 -1,5 -1 -0,5 0 0,5 1 1,5 2 2,5 3
%
1995 1996 1997 1998 1999
Year
Source: CNA/CEPEA-USP Research Data. 3
2.5 2 1.5 1 0.5 0 -0.5 -1 -1.5 -2
Figure 3. Annual Growth Rates of the Total Agribusiness GDP – 1995 to 1999
Table 2 shows the evolution of the Brazilian Agribusiness GDP, both in global terms (total) and for the two sub-complexes, with corresponding segments for the 1994-1999 period.
Table 2. Brazilian Agribusiness GDP (Thousand R$ of 1999)
AGRIBUSINESS Years
1994 1995 1996 1997 1998 1999
Agriculture 262,135,138 269,784,951 265,410,370 263,060,940 264,580,605 269,467,715
Input 23,372,496 22,650,243 22,895,596 22,581,999 23,924,854 25,996,564 Total Agriculture 62,760,453 64,319,947 61,869,660 60,989,169 64,790,422 64,719,650 Industry 88,031,596 94,446,268 90,298,070 90,808,537 86,023,478 88,357,177 Distribution 87,970,593 88,368,493 90,347,044 88,681,235 89,841,851 90,394,323
Vegetal 189,094,756 192,482,644 190,780,778 191,134,436 189,458,831 189,697,278
Input 14,968,858 14,261,339 14,787,001 14,741,754 15,494,027 16,295,039 Vegetal 36,687,840 36,697,681 36,494,664 36,421,725 38,329,430 36,349,719 Industry 74,441,542 79,383,988 75,114,385 76,374,757 72,190,097 74,306,905 Distribution 62,996,516 62,139,636 64,384,728 63,596,199 63,445,277 62,745,616
Animal 73,040,382 77,302,307 74,629,592 71,926,504 75,121,774 79,770,436
[image:11.595.96.502.81.334.2] [image:11.595.80.521.495.747.2]Regarding the annual growth of the sub-complexes one verifies that the Animal segment was the one presenting best results in 1998 and 1999, with real growth rates of 4.44% and 6.19%, respectively, in comparison with those of –0.88% and 0.13% for the Vegeral segment (Figures 4 and 5).
1.79
-0.88
0.19
-0.88
0.13
-1 -0,5 0 0,5 1 1,5 2
%
1995 1996 1997 1998 1999
Year
Source: CNA/CEPEA-USP Research Data. 2
[image:12.595.108.490.185.403.2]1.5 1 0.5 0 -0.5 -1
Figure 4. Annual Growth Rates of the Vegetal Agribusiness GDP – 1995 to 1999
5.84
-3.46 -3.62 4.44
6.19
-4 -2 0 2 4 6 8
%
1995 1996 1997 1998 1999
Year
Source: CNA/CEPEA-USP Research Data.
Figure 5. Annual Growth Rates of the Animal Agribusiness GDP – 1995 to 1999
[image:12.595.109.489.445.659.2]was recorded in 1998 and 1999. With regards to the Agriculture Based Industries and Distribution segments, they had a share of respectively 32.79% and 33.55% in 1999, for the total Complex.
The evolution of the Brazilian Agribusiness composition also shows the high shares of the Agriculture Based Industries and the Distribution segment, showing values always above 30%.
[image:13.595.57.543.388.538.2]In terms of values and shares, Table 3 shows the structure of the two major sub-complexes of the Brazilian Agribusiness – Vegetal and Animal. In 1999 the Vegetal Agribusiness GDP (R$ 189.70 billions) represented around 19% of Brazil’s GDP, while the Animal Agribusiness GDP corresponded to approximately 8% (R$79.77 billions) of Brazil’s GDP. In the case of the agriculture, the higher GDP share is justified by the diversity of the agricultural sector that has a higher number of processing industries than the animal sector.
Table 3. Brazilian GDP and Brazilian Agribusiness Complex GDP - 1994 to 1999
(Billions R$ of 1999 and Shares, %, in the Brazilian GDP)
Total 1994 1995 1996 1997 1998 1999
Value Share Value Share Value Share Value Share Value Share Value Share
Vegetal
Complex 189.10 20.89 192.48 20.41 190.78 19.71 191.13 19.06 189.46 18.91 189.70 18.96 Animal
Complex 73.04 8.08 77.30 8.20 74.63 7.71 71.93 7.17 75.12 7.50 79.77 7.97 Agriculture
Complex 262.14 28.97 269.78 28.61 265.41 27.42 263.06 26.23 264.58 26.41 269.47 26.93
Brazil 904.76 100.00 942.97 100.00 968.04 100.00 1.002.91 100.00 1.001.67 100.00 1.000.66 100.00
Source: CNA/CEPEA-USP Research Data.
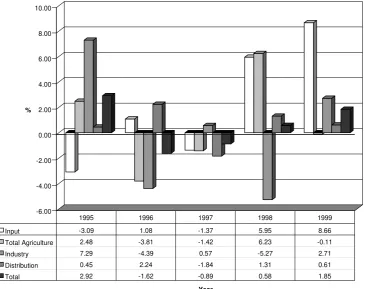
Considering that the Agribusiness is a segment with agents from the primary (agriculture), secondary (industry), and tertiary (services) sectors, the changes in the GDP will be a function of the relative variation of its components.
-6.00 -4.00 -2.00 0.00 2.00 4.00 6.00 8.00 10.00
%
Year
Input -3.09 1.08 -1.37 5.95 8.66 Total Agriculture 2.48 -3.81 -1.42 6.23 -0.11 Industry 7.29 -4.39 0.57 -5.27 2.71 Distribution 0.45 2.24 -1.84 1.31 0.61 Total 2.92 -1.62 -0.89 0.58 1.85 1995 1996 1997 1998 1999
[image:14.595.117.483.106.395.2]Source: CNA/CEPEA-USP Research Data.
Figure 6. Real Annual Growth Rates of the Total Agribusiness GDP and its Segments - 1995 to 1999
Considering the annual growth rates of the components of the Vegetal Agribusiness GDP one notices that only the Input and Industry segments had a positive performance in 1999, with growth rates, respectively, of 5.17% and 2.93%, compensating the negative results of Agriculture (-5.16%) and Distribution (-1.10%) (Figure 7).
-6.00 -4.00 -2.00 0.00 2.00 4.00 6.00 8.00
%
Year
Input -4.73 3.69 -0.31 5.10 5.17 Vegetal 0.03 -0.55 -0.20 5.24 -5.16 Industry 6.64 -5.38 1.68 -5.48 2.93 Distribution -1.36 3.61 -1.22 -0.24 -1.10 Total 1.79 -0.88 0.19 -0.88 0.13 1995 1996 1997 1998 1999
[image:15.595.135.461.88.356.2]Source: CNA/CEPEA-USP Research Data.
Figure 7. Real Annual Growth Rates of the Vegetal Agribusiness GDP and its Segments - 1995 to 1999.
-10.00 -5.00 0.00 5.00 10.00 15.00 20.00
%
Year
Input -0.18 -3.34 -3.31 7.53 15.07 Animal 5.94 -8.14 -3.18 7.71 7.21 Industry 10.83 0.81 -4.94 -4.16 1.57 Distribution 5.02 -1.02 -3.38 5.23 4.74 Total 5.84 -3.46 -3.62 4.44 6.19 1995 1996 1997 1998 1999
Source: CNA/CEPEA-USP Research Data.
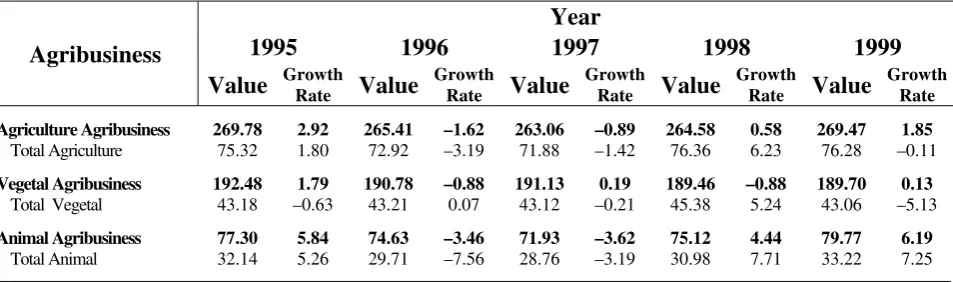
[image:15.595.139.462.438.711.2]The aggregate value derived from agriculture and animal products are made up by its output destiny, i.e.: a) inputs used in the agriculture; b) inputs used by the industries; c) exported; and d) final consumption by the families and the government. Given the above, one has that the value of the Total Agriculture GDP in 1999 was of R$76.28 billions, a difference of R$11.56 billions in comparison with the R$64.72 billions used as inputs by the industries or used by the components of the final demand, this difference reflects the value of using the vegetal and animal products as inputs in the Agricultural sector. Splitting the Total Agriculture GDP by the sub-complexes one has that in 1999 the total GDP for the Vegetal and Animal production was, respectively, of R$43.06 billions and R$33.22 billions (Table 4).
Table 4. Agribusiness and Agriculture GDP by Complexes, Brazil - 1995 to 1999 (Billion R$ of 1999 and Real Growth Rates, %)
Agribusiness
Year
1995 1996 1997 1998 1999
Value Growth Rate Value Growth Rate Value Growth Rate Value Growth Rate Value Growth Rate
Agriculture Agribusiness 269.78 2.92 265.41 –1.62 263.06 –0.89 264.58 0.58 269.47 1.85
Total Agriculture 75.32 1.80 72.92 –3.19 71.88 –1.42 76.36 6.23 76.28 –0.11
Vegetal Agribusiness 192.48 1.79 190.78 –0.88 191.13 0.19 189.46 –0.88 189.70 0.13
Total Vegetal 43.18 –0.63 43.21 0.07 43.12 –0.21 45.38 5.24 43.06 –5.13
Animal Agribusiness 77.30 5.84 74.63 –3.46 71.93 –3.62 75.12 4.44 79.77 6.19
Total Animal 32.14 5.26 29.71 –7.56 28.76 –3.19 30.98 7.71 33.22 7.25
Source: CNA/CEPEA-USP Research Data.
When measured by a broader concept, the sectoral GDP data from 1994-1999 allows a more accurate technical evaluation regarding the sectoral performance of the Brazilian Agribusiness. These results are shown in Tables 5 and 6. The activity regarding the vegetal and animal products also includes the value of the inputs used plus the value aggregated with the distribution of the vegetal and animal products; the value for the agriculture based industries also includes the value aggregated with the distribution of the industries production. Using this broader concept, the value of the agricultural sector was responsible, in 1999, for 42.23% of Brazil’s Total Agribusiness GDP.
1998 and 1999, with growth rates of 8.02% and 1.77%, respectively. One should point the highly positive performance of the Animal sector in the 1998-1999 period, with growth rates of 9.55% and 8.48%, respectively, which certainly reflected on the positive result of the Agriculture sector in that biennium (8.02% and 1.77%, respectively).
[image:17.595.85.513.331.618.2]Despite the not so significant growth of the Total Agribusiness GDP (1.85%) in 1999, some agroindustrial sectors managed to overcome the drawbacks and present highly satisfactory results. The Pulp, Paper and Printing industry had a GDP growth of 20.81%, going from R$12.01 billions in 1998 to R$14.50 billions in 1999 (Tables 5 and 6, and Figure 9).
Table 5. Sectoral Distribution of the Brazilian Agribusiness GDP, 1995 to 1999.
(Billion R$ of 1999)
Sector 1995 1996 1997 1998 1999
Agriculture (1) 109.10 105.84 103.51 111.81 113.78
Vegetal (2) 62.93 63.09 62.46 66.84 65.01
Animal (3) 46.14 42.74 41.04 44.96 48.78
Wood and Wood Products(4) 13.95 13.63 13.26 12.19 12.24
Pulp, Paper and Printing(4) 14.43 13.50 12.79 12.01 14.50
Chemical Elements (Alcohol)(4) 9.98 9.58 11.94 10.12 11.43
Textile Industry(4) 12.17 11.13 10.05 8.73 9.24
Clothing Industry(4) 13.54 13.35 12.03 11.40 9.72
Footwear Industry(4) 6.96 6.88 6.56 5.32 4.96
Coffee Industry(4) 5.02 5.22 5.04 6.65 7.13
Vegetal Products Processing(4) 20.42 21.67 22.96 21.15 19.94
Animal Slaughtering(4) 16.73 17.10 16.52 16.84 18.80
Dairy Industry(4) 7.47 7.91 7.80 8.00 7.23
Sugar Industry(4) 4.10 3.95 4.12 4.12 4.06
Vegetal Oil Processing(4) 7.23 7.29 8.20 7.67 7.42
Other Food Products(4) 28.68 28.35 28.27 28.57 29.00
Total 269.78 265.41 263.06 264.58 269.47
Source: CNA/CEPEA-USP Research Data.
(1) These values refer to the sum of the aggregated value generated by the agriculture sector, the inputs used by the sector and the distribution value of the vegetal and animal products.
(2) These values refer to the sum of the aggregated value generated by the vegetal sector, the inputs used by the sector and the distribution value of the vegetal products.
(3) These values refer to the sum of the aggregated value generated by the animal sector, the inputs used by the sector and the distribution value of the animal products.
Table 6. Real Growth Rates (%) of the Sectoral Distribution of the Brazilian Agribusiness GDP, 1995 to 1999
Sector 1995 1996 1997 1998 1999
Agriculture (1) 1.67 –2.99 –2.20 8.02 1.77
Vegetal (2) –0.75 0.27 –1.00 7.01 –2.75
Animal (3) 5.10 –7.36 –3.97 9.55 8.48
Wood and Wood Products(4) 4.99 –2.29 –2.73 –8.03 0.41
Pulp, Paper and Printing(4) 24.85 –6.49 –5.22 –6.14 20.81
Chemical Elements (Alcohol)(4) –20.98 –4.02 24.67 –15.28 12.97
Textile Industry(4) 2.30 –8.49 –9.70 –13.13 5.77
Clothing Industry(4) 5.50 –1.43 –9.87 –5.21 –14.76
Footwear Industry(4) –5.11 –1.19 –4.58 –19.01 –6.61
Coffee Industry(4) –15.38 4.10 –3.58 32.11 7.09
Vegetal Products Processing(4) –1.61 6.12 5.94 –7.90 –5.73
Animal Slaughtering(4) 6.55 2.25 –3.43 1.96 11.67
Dairy Industry(4) 22.38 5.80 –1.31 2.57 –9.72
Sugar Industry(4) –7.98 –3.57 4.21 –0.13 –1.34
Vegetal Oil Processing(4) –5.71 0.89 12.42 –6.50 –3.17
Other Food Products(4) 16.25 –1.15 –0.27 1.06 1.51
Total 2.92 –1.62 –0.89 0.58 1.85
Source: CNA/CEPEA-USP Research Data.
(1) These values refer to the sum of the aggregated value generated by the agriculture sector, the inputs used by the sector and the distribution value of the vegetal and animal products.
(2) These values refer to the sum of the aggregated value generated by the vegetal sector, the inputs used by the sector and the distribution value of the vegetal products.
(3) These values refer to the sum of the aggregated value generated by the animal sector, the inputs used by the sector and the distribution value of the animal products.
(4) These values refer to the sum of the aggregated value generated by the industrial sector plus the distribution value of the processed products.
0.41 20.81 12.97 5.77 -14.76 -6.61 7.09 -5.73 11.67 -9.72 -1.34 -3.17 1.51 -20 -15 -10 -5 0 5 10 15 20 25 % Woo d an
d W ood
Prod ucts
Pulp , Pap
er a nd P
rintin g
Che mic
al E lem ents (Alc ohol ) Text ile In
dust ry
Clo thin
g In dust
ry
Foot wea
r Ind ustry Cof fee Indu stry Vege tal P
rodu cts Proc essi ng Anim al S
laug hter
ing
Dai ry In
dust ry
Suga r Ind
ustry
Vege tal O
il Pr oces
sing
Oth er F
ood Prod
ucts
[image:19.595.135.483.89.353.2]Source: CNA/CEPEA-USP Research Data.
Figure 9. Yearly Growth Rates (%) of the Agriculture-Based Industries GDP – 1999
The results confirm the Agribusiness behavior trend in highly industrialized economies, in which the share of the agriculture based industries and final distribution, tends to be more and more representative in the value of the output sold by farmers. In that process, the vegetal and animal sector becomes less important in the composition of the Agribusiness output, with a relative sector’s income decrease.
Through the data presented it is possible to see that the Brazilian agriculture is inserted into the current trend of the world’s economy by adapting itself to the situation of the consumers, concentrated on the urban regions, with sophisticated consuming structures in which a larger share of industrialized and diversified products is a constant demand.
In short, the Brazilian Agribusiness adds value on the agricultural raw materials in which the warehousing, processing and final distribution sector tends to be more representative of the total value of the output sold to the consumer, thus dominating the agriculture/industry relationships.
leading to a relative reduction of the rural sector in relationship with the other Agribusiness components.
4.
T
HEB
RAZILIANA
GRIBUSINESS,
M
ONTHLYG
ROWTHR
ATES FOR2000
To estimate the monthly growth rates of the Brazilian Agribusiness GDP it was used the input-output tables to derive the weights of the different sectors in the complex, and at the same time it was made use of different price and quantity indexes available in the Brazilian economy. It is important to stress that the measure of the monthly growth rates of the Agribusiness GDP was done taking into consideration the income side of agriculture, i.e., we have tried to make the growth rates sensible to real price as well as real quantity changes, given that the quarterly estimates of the Brazilian Government Statistical Institute (IBGE) are given taken into consideration only growth rates into agricultural production, as so we do believe that the monthly growth rates that we have obtained are much more representative of what happen in the Brazilian Agriculture and Agribusiness than the ones released by IBGE.
The results for the Brazilian economy (Table 7), up to April of 2000, show that the GDP for the Total Agricultural sector grew 0,96% over the 1999 value. This growth rate is due in part of the good performance of the Animal sub-sector that grew 2.59% while the Vegetal sector had a negative growth rate of -0.31%.
While the sub-sector of Vegetal is having a negative growth, the Agribusiness GDP of this sub-complex had an accumulated growth rate of 0.7% up to April 2000, due mainly to the growth of Inputs (1.48%), Industry (1.56%), and Distribution (0.08%).
For the Animal sub-complex, the Agribusiness GDP showed an accumulated growth rate of 2.03%, with a growth rate of 3.70% for Inputs, 0.47% for Industry, and 1.65% for Distribution.
The GDP of the Total Agribusiness grew 1.09% in the first four months of the year, with a growth rate of 2.31% for inputs, 1.38% for Industry, and 0.56% for Distribution.
Table 7. Monthly Real Growth Rates (%) of the Brazilian Agribusiness GDP, January to April 2000
Agriculture
Agribusiness Inputs
Total
Agriculture Industry Distribution
January 0.2227 0.4911 0.1141 0.3115 0.1366 February 0.4904 0.5473 0.0827 0.7660 0.4959 March -0.0002 0.3600 0.0544 0.0719 -0.2140
April 0.3764 0.8885 0.7039 0.2283 0.1394
Accumulated 1.0931 2.3058 0.9570 1.3835 0.5579
Vegetal
Agribusiness Inputs Vegetal Industry Distribution
January 0.0983 0.2650 -0.2463 0.3259 -0.0148 February 0.4611 0.3331 -0.3113 0.8476 0.4816
March -0.1542 0.1009 -0.2853 0.0840 -0.4295 April 0.2950 0.7705 0.5314 0.2905 0.0403
Accumulated 0.7010 1.4765 -0.3136 1.5554 0.0756
Animal
Agribusiness Inputs Animal Industry Distribution
January 0.5186 0.8708 0.5758 0.2354 0.4803 February 0.5597 0.9050 0.5833 0.3341 0.5282 March 0.3640 0.7900 0.4822 0.0075 0.2724 April 0.5680 1.0830 0.9196 -0.1028 0.3613
Accumulated 2.0254 3.6987 2.5850 0.4744 1.6522
Wood and
Wood Prod. Pulp, Paper and Printing Chemical Elements Textile Industry Clothing Industry Footwear Industry
January 0.0699 1.8029 1.1292 0.4588 -1.3328 -0.5361 February 0.3002 2.1189 1.5108 0.5639 -1.0374 -0.3030 March 0.1675 2.3243 1.7902 0.3382 -1.1504 -0.4886 April 0.7357 2.4919 0.4359 0.2094 -1.1848 -0.5309
Accumulated 1.2780 9.0270 4.9504 1.5791 -4.6232 -1.8459
Coffee Industry Vegetal Products Animal Slaughtering Dairy Industry Sugar Industry Vegetal Oil Processing Other Food Products
January 0.4965 -0.4056 1.0130 -0.8254 0.0510 -0.3866 0.0809 February 0.5072 2.4018 1.0052 -0.6279 0.4189 -0.6276 0.0397 March -0.0768 -3.1224 0.5658 -0.8365 1.0923 -1.3033 0.0536 April 0.2893 -0.3661 0.3559 -0.7940 0.7200 -1.2653 -0.4936
Accumulated 1.2206 -1.5597 2.9707 -3.0484 2.2989 -3.5380 -0.3203
5.
C
ONCLUSIONSBy analyzing the results of this research one can infer the complexity of the Brazilian economy, which presents an advanced stage of a productive structure with a high interlinking degree among the national productive sectors.
As to the Agribusiness results, the empirical data show the fundamental role that this segment has performed in the Brazilian economy, responsible for approximately 27% of the GDP in 1999.
The contribution of the different sectors to the Agribusiness GDP confirm that the Agribusiness adds value to the agricultural raw materials, with the warehousing, processing and final distribution sectors tending to be more and more representative in the value of the output sold to the consumer, as so, the results point out that the agriculture based industries and the distribution segment are the dynamic poles in the agrarian transformation process.
R
EFERENCESFUNDAÇÃO INSTITUTO BRASILEIRO DE GEOGRAFIA E ESTATÍSTICA. Sistema de
Contas Nacionais Consolidadas – Brasil. Rio de Janeiro: IBGE, 1989. (Text for
discussion, n. 17).
FURTUOSO, M.C.O. O Produto Interno Bruto do Complexo Agroindustrial Brasileiro. Tese de doutorado. Piracicaba, 1998. 278 p. – Universidade de São Paulo/ESALQ/USP. GUILHOTO, J. J. M.; FURTUOSO, M. C.O. & BARROS, G. S. D. C. O Agronegócio na