Image Compression using DCT based Compressive
Sensing and Vector Quantization
Dipti Bhatnagar
U.I.E.T, Panjab University
Chandigarh
Sumit Budhiraja
U.I.E.T, Panjab University
Chandigarh
ABSTRACT
Compressive sensing (CS) provides a mathematical framework for utilizing the potentiality of sparse nature of the commonly used signals and has been the subject of scientific research in recent years. CS involves the compression of the data at the first step of image acquisition. This paper presents an image compression algorithm based on DCT based CS and Vector Quantization (VQ). It has been observed from the implementation of the Proposed CS-VQ algorithm that the proposed algorithm gives better PSNR and visual quality when compared with the existing CS-VQ algorithm. The results obtained are even comparable with JPEG algorithm but only when small queue size is considered. The basic concept behind the CS states that small collections of non-adaptive linear projections of a sparse signal can efficiently helps in the reconstruction of the image through the image data sent to the decoder making use of some optimization procedure.
General Terms
Compressive Sensing, Vector Quantization, Image Processing
Keywords
Image Compression, Discrete Cosine Transform (DCT), Discrete Wavelet Transform (DWT), Huffman Coding, Image pre-processing, Remote Sensing.
1.
INTRODUCTION
In the past few years, there came a revolutionary change in the entertainment market as the usage of the internet services has become the indispensable part of the life. The internet service includes the storage, transmission and processing of the multimedia data. As a result, compression techniques have become very important in order to provide economy storage, time and cost as the cost is dependent on size of data. Image compression comes under the category of data compression but it has grown as a fully fledged field having standards of its own. It is because images forms a considerable portion of the data dealt these days. Along with providing all the features of data compression, Image compression has the added advantage of being tolerant to distortion due to peculiar characteristics of human visual system.
In CS the data compression is achieved to some extent at the first step of signal acquisition which leads to accumulation of fewer amounts of data at the encoder and hence less number of measurements is involved at the encoder to compress this data [1]. CS is the result of recent advancement in the field of signal acquisition. So, it has become absolutely crucial to look for its integration in previously existing fields. For this purpose, there should be sufficient empirical proof and practical algorithm available for CS based image compression that could meet the performance of current standards in image compression [2]. This paper presents a DCT based CS and VQ based image compression system which combines the advantages of the CS field and the JPEG image compression standard.
The rest of the paper has organized as follows. Section 2 gives a short introduction to the related work. Section 3 provides the details of the proposed algorithm for CS-VQ system. The experimental results obtained after implementation of the proposed CS-VQ algorithm has been compared with the previous work in Section 4 and then in the last Section 5 gives the conclusions drawn from the analysis of the results and also gives the future scope for the possible advancements in the proposed algorithm.
2.
RELATED WORK
An analysis was done by A. Fletcher, S. Rangan, and V. Goyal on the operational rate distortion performance of the CS framework for the source coding done with uncertain knowledge of the sparsity pattern and with the maximum likelihood estimation of the sparsity pattern [3]. Within the CS framework, the encoding of the source signal was done using fixed basis and random measurements. When the result of both the techniques was compared, it was concluded that the random measurements induce an additive logarithmic rate penalty but the deterministic measurements were matched to the source which resulted in their better performance.
In a scheme introduced by J Wen, Z Chen, Y Hen, J D Villasenor and S Yang, quantized DCT and noiselet information was combined with CS in order to improve the efficiency of CS [4]. In this technique, local 8*8 DCT is performed on the original image and then the most significant K1 coefficients are selected as per the sorted list over all the blocks of the image. As a result the number of coefficients contributed by each 8*8 block differs. After this step, K2 noiselet coefficients are obtained and sent to the decoder. At the decoder, the original image is reconstructed by the combination of both the K1 DCT coefficients and K2 noiselet coefficients using the concept of minimization of the total variation (TV).
requires high complexity encoder.
L.M .Merino and L. E. Mendoza [6] gave the scheme of robust compressive sensing in which they reconstructed the sparse signal by making use of few randomly acquired samples. This technique was beneficial in the applications where the image data is sent over the noisy channels. CS measurements of 2D-DWT carry nearly the same amount of information. So using this concept the lost information can be retrieved by CS framework and hence bit loss effects get reduced. Karim Kanoun [7] used the CS in the field of Real Time monitoring of the ECG signals. Based on this concept personal ECG monitoring systems were designed which employed a computationally light ECG encoder and a real time decoder running on the devices like iPhone. Recently T.S. Gunawan, O.O. Khalifa, A.A. Shafie, E. Ambikairajah proposed a scheme in which CS gas been applied to the field of speech compression [8]. Gammatone filterbank and DCT is used to convert the speech signals into sparse form and then coefficients obtained are given to the CS framework for compression. Then the VQ is added to the system in order to achieve further reduction in the bit requirement. Recently a comparative study has been done by Wei Dai and Olgica Milenkovic regarding the average distortion produced by scalar, vector and entropy coded quantization when they deal with CS measurements [9]. Their study reveals that the performance gap produced by the scalar quantization can be closed by using entropy and uniform quantization. Vector Quantization shows significant distortion reduction in case of reconstruction of lower bounds only.
3.
PROPOSED ALGORITHM
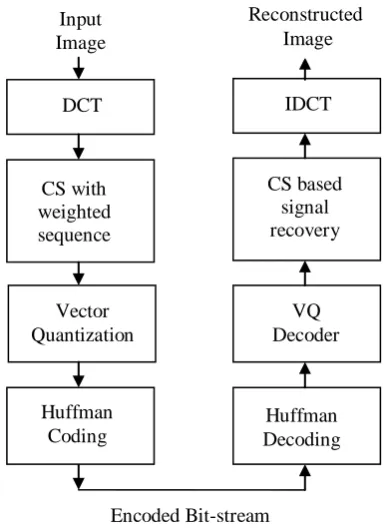
[image:2.595.68.261.435.699.2]The detailed procedure in the case of proposed CS-VQ scheme has been explained in this section. Figure 1 shows the processing stages of the proposed algorithm.
Fig 1: Flowchart of proposed CS-VQ algorithm
3.1
Image Preprocessing
When an image is acquired, there may be noises present in the image which affect the recognition rate greatly. So, these
processing various steps are used like gray processing which involves the conversion of color image to gray scale image, median filtering which involves removal of noise by employing filters, image binarization which involves conversion of the image to black and white image. In the proposed algorithm gray processing was done on the input image.
3.2
Discrete Cosine Transform
The image data is divided up into 8*8 block of pixels. A DCT is applied to each 8*8 block. DCT converts the spatial image representation into a frequency map: the average value in the block is represented by the low-order term, while successive high order terms represent the strength of more and more rapid changes across the width or height of the block. The strength of a cosine wave alternating from maximum to minimum at adjacent pixels is represented by the highest order term [4]. The DCT of a signal f(x, y) and the inverse DCT (IDCT) of coefficients Fc(u,v) are given by:
(3.1)
(3.2) where
(3.3)
3.3
Compressive Sensing
This step removes the redundant information present in the image and converts the image data into its sparsest form. In the proposed Image compression algorithm based on Compressive Sensing and Vector Quantization (Proposed CS-VQ), CS has been done using weighted sequence.
The weighted coefficients i.e., the Fourier coefficients obtained after the application of DCT are subjected to the weighing logic. The logic is based on the concept that all the elements of the queue are given the fixed coefficient value based on the probability of occurrence of all the elements forming that queue. Also the coefficients which are not present in the input image data, are not considered at all to form the measurements of the CS framework. . The weighted logic that is used to assign fixed coefficient value can be mathematically shown as:
Weighted coefficient
=
(3.4)
Queue size affects the PSNR of the reconstructed image as more the queue size less are the number of measurements formed and more is the quantization noise introduced to the image data. So there exists an inverse relation between the queue size and the PSNR obtained. Support of a vector x is defined as the locations of significant nonzero entries in the vector x. So, the location of significant non-zero measurements obtained can be given by the formula:
where
(3.5)
DCT
CS with
weighted
sequence
Vector
Quantization
Huffman
Coding
Huffman
Decoding
VQ
Decoder
CS based
signal
recovery
IDCT
Encoded Bit-stream
Input
Image
3.4
Vector Quantization
The measurements obtained by CS method are then subjected to Vector Quantization. In VQ, the index of the codebook whose entry is closest to the measurement value that is to be compressed is found. The codebook (that is needed for the index determination) is prepared before performing the operation [10]. It is the lossy step in which quantization noise is introduced to the image and this noise cannot be recovered back by using any method. The number of binary bits required for the index is [log2 N], where N is the number of entries in the codebook. The number of bits needed to represent a code vector is kR, where k is the dimension of the vector and R is the rate. To achieve compression N can be made less than 2kR.
Compression is measured in terms of the number of bits required per sample i.e., [log2 N]/ k. The most used measure of error for a block quantizer is the squared-error distortion measure written as( 2where is defined as:
(3.6) The compression achieved increases with the dimension k of the vector, but the cost of the codebook grows exponentially with k. Before the codebook indices are losslessly compressed the spatial redundancy present in the image data is removed by taking the image block size which is smaller than the complete image.
3.5
Huffman Coding
It is a statistical lossless technique which helps to represent a string of symbols with lesser number of bits [11]. In this scheme of lossless compression shorter codes are assigned to the most frequently used symbols, and longer codes to the symbols which appear less frequently in the string. The Huffman code for a set of codebook indices may be generated by constructing a binary tree with nodes containing the indices to be encoded and their probabilities of occurrence. After the generation of the Huffman codes, data may be encoded simply by replacing each symbol with its code. Thus the encoded bit-stream formed is sent to the decoder where the exactly reverse steps are performed in order to get the reconstructed image. Huffman decoding may be accomplished by reading the encoded data one bit at a time. Once the bits read match a code for symbol, write out the symbol and start collecting bits again. After this the codebook indices are decoded to get back the vector codes. The CS recovery algorithm used is iterative thresholding algorithm which is in common use nowadays. This algorithm iterates a gradient descent step followed by hard thresholding until a convergence criterion is met. In the last the quality of the reconstructed image can be tested using performance parameters like PSNR, MSE, bits per pixel (bpp). Comparative analysis of the results obtained from proposed algorithm and existingalgorithm is done and conclusions are drawn which have explained in the next section.
4.
EXPERIMENTAL RESULTS
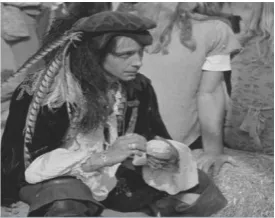
[image:3.595.360.498.71.180.2]A database of standard test image Pirate of size (1024*1024), shown in Figure 2, was taken during the implementation of the Proposed CS-VQ algorithm.
Fig 2: Standard test image of Pirate (1024*1024)
4.1
Performance Evaluation Parameters
1. The parameters that were used to evaluate and compare the performance of the Proposed CS-VQ algorithm with existing CS-VQ algorithm and JPEG have been described ahead. Peak Signal to Noise Ratio (PSNR): It is the ratio between maximum possible power of a signal and the power of corrupting noise that affects the fidelity of its representation. Because many signals have a very wide dynamic range, PSNR is usually expressed in terms of logarithmic decibel (dB) scale. The PSNR is defined as:
(4.1) Mean Square Error (MSE): MSE gives the measure of difference between the original image and the reconstructed image. The MSE should be less, which means that the pixel intensity of the input and output image should be as close as possible.
Bits per pixel (bpp): It is defined as the ratio of bits used in the compressed image to the number of pixels in the original input image.
4.2
Implementation Results:
The above performance parameters are evaluated after implementing the proposed algorithm on standard test image of Pirate (1024*1024) and taking the block size of (256*256) and taking 25% DCT level. In the case of Proposed algorithm queue size (Q.S) used in the weighted logic is varied and hence different results have been collected which are then used for analysis. Table 1 shows the value of PSNR for the value of bpp attained in case of the three techniques i.e., Proposed CS-VQ, existing CS-VQ and JPEG.
Table 1: PSNR (in decibels) for different techniques
bpp
CS-VQ
JPEG
Proposed CS-VQ
PSNR
Q. S
0.4079
27
28.40
27.5936
50
0.4328
27.20
28.85
28.3278
40
0.4485
27.85
29.00
30.7386
27
0.4819
27.95
29.20
31.8211
15
From Table 1, it is observed that for fixed value of bpp achieved, PSNR for Proposed CS-VQis better in comparison to the existing CS-VQ. Also it can be seen that PSNR obtained for Proposed CS-VQ is less than that of JPEG at large values of queue size but as queue size is decreased, the PSNR obtained by Proposed CS-VQ outperforms even that obtained by JPEG technique. From the values shown in the Table 1, it can also be concluded that as queue size increases, bpp decreases and the PSNR also decreases because of the formation of less number of measurements, which leads to increase in quantization noise. Figure 3 shows the PSNR v/s bpp graph to depict the results obtained by the three techniques graphically.
Fig 3: PSNR v/s bpp of Pirate image (1024*1024) for the different techniques
Comparison of the three algorithms in terms of MSE at different value of bpp is given in Table 2. The term in second column of the Proposed CS-VQ column represents the queue size i.e. the number of elements on which the weighted logic has been applied at a time.
Table 2: MSE of for different techniques
bpp
CS-VQ
JPEG
Proposed CS-VQ
MSE
Q.S
0.4079
130.7615
94.7283
114.0565
50
0.4328
124.8763
85.9043
96.3163
40
0.4485
107.5177
82.5049
55.2870
27
0.4819
105.0703
78.7916
43.0893
15
0.5038
102.6786
65.5360
39.3712
2
[image:4.595.368.507.327.711.2]From Table 2, it is clear that MSE obtained is less for Proposed CS-VQ in comparison to existing CS-VQ technique and as the queue size is increased in case of Proposed CS-VQ, MSE increase due more quantization noise. Figure 4 shows the MSE v/s bpp graph for the three techniques.
Fig 4: MSE v/s bpp of Pirate image (1024*1024) for the different techniques
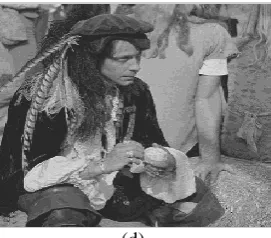
In the graph shown in Figure 4, the curves clearly depict the higher values of MSE in case of existing CS-VQ algorithm. In case of Proposed CS-VQ algorithm, MSE initially is high at larger values of queue size but gradually decreases as queue size is decreased. Figure 5 shows the original image and the reconstructed images obtained from the JPEG, existing CS-VQ and Proposed CS-CS-VQ algorithm at 0.47 bpp.
(a)
(b)
(c)
20 22 24 26 28 30 32 34 36 38
0.4 0.42 0.44 0.46 0.48 0.5 0.52
P
SN
R
(D
e
ci
b
le
s)
Bits Per Pixel
CS-VQ JPEG PSNR
20 40 60 80 100 120 140
0.4 0.42 0.44 0.46 0.48 0.5 0.52
M
e
an
S
q
u
ar
e
E
rr
o
r
Bits Per Pixel
[image:4.595.54.281.540.692.2](d)
Fig 5: Reconstructed images of the JPEG, CS-VQ and
proposed CS-VQ technique: (a) Original image
(1024*1024), (b) Image Reconstructed Using existing CS-VQ at 0.47 bpp, (c) Image Reconstructed Using JPEG at 0.47 bpp, (d) Image Reconstructed Using existing CS-VQ at 0.47 bpp
Table 4.3 depicts the PSNR values obtained for different DCT levels obtained for the same input image at different queue size.
Table 3: PSNR (in decibels) for different levels of DCT
Queue Size
10% 25% 40% 80%
2 32.2125 32.2130 32.2129 32.0875
15 31.8216 31.8211 31.8213 31.7241
27 30.7383 30.7386 30.7343 28.1024
40 28.3275 28.3278 28.3275 28.2271
From Table 4.3, it can be concluded that as we go on increasing the levels of DCT, the PSNR decreases as higher levels introduce more noise in the image whereas the decrease in the bpp is negligible.
5.
CONCLUSION
In this paper, CS has been implemented using weighted sequence and then the vectors formed after VQ are compressed using Huffman Coding. The results obtained have been compared with the existing CS-VQ algorithm which makes the use of pseudo-random sequence in the CS framework and with the JPEG image compression standard. From all the implementation done and the results obtained, some conclusions can be drawn which have been explained ahead. Among all the three techniques compared JPEG, CS-VQ, Proposed CS-CS-VQ, it is analyzed that the PSNR obtained for the Proposed scheme is highest when the queue size is taken small but as it increases JPEG performs better. The bpp decrease with the increase in queue size in the case of Proposed CS-VQ algorithm. The PSNR slightly decrease with the increase in DCT levels whereas the decrease in bpp is very negligible. So, lower levels of DCT should be preferred. For researchers who are interested to work in the field of CS and VQ, future scope includes the combination of robustness based technique with the proposed algorithm as sometimes the signal is transmitted through the noisy channels. Also the use of color images as the test database.
6. REFERENCES
[1]E. J. Candès, “Compressive sampling,” in 2006 IEEE International Congress of Mathematics,2006. ICM 06,Spain, Madrid,Mathematicians., aug 2006.
[2]R. Baraniuk, “Compressive sensing [lecture notes],” IEEE Signal Processing Magazine, vol. 24, pp. 118 –121, july 2007.
[3]A. Fletcher, S. Rangan, and V. Goyal, “On the rate-distortion performance of compressed sensing,” in IEEE International Conference on Acoustics, Speech and Signal Processing, 2007. ICASSP 2007, vol. 3, (Honolulu, Hawaii, USA), pp. III–885 –III– 888, april 2007.
[4]J Wen, Z Chen, Y Hen,J D Villasenor and S Yang “A Compressive sensing image compression algorithm using quantized DCT and Noiselet information” IEEE Signal Processing Magazine, 2010.
[5]S.Kadambe and J.Davis, Compressive Sensing and Vector Quantization Based Image Compression, IEEE Signal Processing Conference, 978-1-4244-9721, 2010.
[6]Chenwei Deng, Weisi Lin, Bu-sung Lee and Chiew Tong Lau, “Robust Image Compression based on Compressive Sensing”, IEEE Signal Processing Conference, 2010.
[7]Karim Kanoun, Hossein Mamaghanian, Nadia Khaled and David Atienze, “A Real time Compressed Sensing-based personal Electrocardiogram Monitoring System”, EDAA, 2011.
[8]T.S. Gunawan, O.O. Khalifa, A.A. Shafie, E. Ambikairajah, “Speech Compression using Compressive Sensing on a Multicore System”, IEEE, 4th International Conference on Mechatronics (ICOM), 17-19 May 2011. [9] Wei Dai and Olgica Milenkovic, “Information
Theoretical and Algorithmic approaches to Quantized Compressive Sensing” IEEE Transaction on Communication, vol. 59, No.- 7, pp. 1857 – 1866, July 2011.
[10]D. A. Huffman, “ A method for the construction of Minimum Redundancy Codes”, Proc. Of Institute of Radio Engineers (IRE), vol. 40, Issue: 9, pp. 1098-1101, Sept. 1952.
[image:5.595.100.236.71.190.2]