7473
A STUDY ON THE EDUCATIONAL EFFECT OF MIXED
REALITY IMPLEMENTATION EXPERIENCES: FOCUSED
ON THE PROGRAMMING TASK VALUE OF ELEMENTARY
SCHOOL STUDENTS
1JI-YUN KIM, 2TAE-WUK LEE
1 Cheongju, Korea National University of Education, Department Computer Education, Korea
2 Cheongju, Korea National University of Education, Department Computer Education, Korea
E-mail: 1[email protected], 2[email protected]
ABSTRACT
Mixed Reality (MR) is one of promising technologies in the 4th industrial revolution era. The purpose of this study is to let elementary school students experience directly programming of MR implementation and to examine how educationally the task value of programming is effective. To achieve that, 100 elementary school students were divided into an experimental group (50 students) and a control group (50 students), and a preliminary questionnaire survey as pre-test was conducted for homogeneity test. With the same theme, MR implementation programming class was applied to the experimental group and general programming class was applied to the control group, ten times. After the experimental application, the two groups had post-test with the same questionnaire used in pre-test. To find the difference between the two groups, data were analyzed at the significance level of .05. As a result, the experimental group recognized the value of programming tasks more highly than the control group (t=2.009, P=.048). According to the analysis on the change in the programming task value between the groups depending on a class type, the control group recognized the programming task value in the same level as in the one before the class (t=1.446, p=.525), whereas the experimental group more recognized it than before the class (t=-2.327, p=.024).
Keywords: Mixed Reality, Task Value, Programming Education, Scratch, Webcam
1. INTRODUCTION
Garter, a global IT research enterprise, selected Virtual Reality (VR) and Augmented Reality (AR) as one of the Top 10 Strategic Technology Trends for 2017. According to the company, VR and AR is the technology to establish an advanced immersive virtual world in combination of various technologies, such as multiple mobile, wearable, and Internet of Things(IoT) [1]. Mixed Reality (MR), the theme of this study, includes the concept of AR and VR and comprehensively means the technology of mixing reality and virtuality. Today, global IT enterprises, such as Microsoft, Alphabet, and Facebook, research the MR. Its market scale continues to grow in the times of the 4th industrial revolution.
In this study, elementary school students as the main character of the future society are asked to implement MR, and how this experience was effective educationally is examined. This is one of trials in the recent trend that computer science related course tries to be applied to public education in the world.
2. RELATED WORKS
2.1 Mixed Reality
MR as the technology of mixing reality and virtuality was first used by Milgram and Koshino(1994). MR can be classified into Augmented Reality (AR), Augmented Virtuality (AV), Virtual Reality(VR), and Virtual Environment(VE) depending on a level of mixture * This paper is revised and expanded version of
7474 of real world and virtual image. This classification is presented in figure 1 [2].
Figure 1: Virtuality Continuum(VC)[2]
As one of the classified types of MR, AR means all cases of augmenting a real world into a virtual image[2]. AV, which is closer to VE in terms of continuity, means that information of real world is added to a virtual image. In VR, a user is completely immersed in a virtual environment so that it is impossible to see real surroundings [3]. Of the three types, AR and VR are most widely used. Table 1 shows the comparison of the two types. Given all, AR means the environment where new information is added in a virtual space. VR means the indirect experience of a new circumstance with the background of totally different time and space in the condition where a real world is never visible..
Table 1:Comparison between Augmented Reality and
Virtual Reality.
Augmented
Reality Virtual Reality Form Reality
+ Virtuality Virtuality
Relation with reality
-Augmented reality -Based on reality
-Replaced reality -A variety of indirect situational experience beyond time and space
Immersion Relatively
low High
Device Diverse sizes
A device enable to hide the whole sight, like HMD(head mounted display), is needed.
No. of available
users
Concurrent use of multiple persons
Use by one
The interaction and immersion of MR enables a user to experience something which is hard to be experienced. Thanks to the feature, MR is widely applied to various areas, including military, medical service, game, advertising, broadcasting, and performance.
In the education area, MR is recognized to have a high value in terms of application. According to Suh, Kim, Lee, and Lee(2007), the educational effects of MR are to promote the activity of obtaining a complicated concept and taking research activity through 3D virtual simulation connected with a real environment, to understand a phenomenon and facilitate immersion through the high presence of virtual contents, to improve learners’ interaction through a tangible interface, and to enhance learners’ control of learning contents[4].
Shelton(2003) researched AR based learning in a constructive approach. According to the researcher, AR based learning triggers a learner’s active operating activity which helps a leaner design knowledge on its own. In addition, AR based learning brings about such educational effects as stimulation of active learning, promotion of constructive learning, implementation of intentional learning, offering of actual learning, and facilitation of collaborative learning [5].
2.2 Scratch Programming for Mixed Reality
Implementation
Scratch is an educational programming language (EPL) that uses block-type commands for programming. Compared to text-based programming languages, Scratch reduces cognitive load and induces interest in learners and, therefore, is popularly used in the education field. While many studies discussed the educational effects of using Scratch, few concerned Scratch programming for implementing MR.
[image:2.612.93.294.418.666.2]7475 To create MR, Scratch 2.0 and webcam are required and, among Scratch commands, video-related blocks in ‘Events’ and ‘Sensing’ are used. These video blocks detect and convert movements in the images received via webcam into values on a scale of 0 to 100, which are then used by the users for programming.
[image:3.612.91.299.250.411.2]Table 2 describes video-related blocks in Scratch and their roles while figure 2 and figure 3 shows a sample project of Scratch programming implementing MR[6][7][8].
[image:3.612.90.297.462.628.2]Figure 2: Scratch Project: Let’s Make My Own Instrument[7]
Figure 3: Scratch Project: Jumping on a Trampoline[8]
2.3 Task Value
The expectancy-value model explains the effects of cognitive elements that influence choices that are relevant to learners’ achievement. Wigfield
and Eccles(2000) argued achievement motivation of learners are determined by expectancy and value, with the former denoting expectation of success learners have and the latter subjective perception of value regarding a given task[9]. This value is represented by ‘task value’ and, according to the expectancy-value model, subjective task value influences achievement motivation. Figure 4 shows a diagram of the expectancy-value model.
Task value consists of attainment value, interest value, and utility value. First, attainment value(or importance) means the learner considers successful completion of the task to be important. Interest value(or intrinsic value) denotes the joy intrinsic to the task itself and that is, therefore, experienced while performing the task in question. By contrast, utility value is an extrinsic value that is related to the future goal that can be attained through the task[9][10]. In this study, the characteristics of elementary school students a study subjects were taken into account and two factors excluding attainment value were set as dependent variables.
This study looks into the value of programming tasks as the scale of the educational effects of MR implementation experience. The programming task value means a learner’s subjective value for programming tasks. As of now, programming course is selected as a required one in many different countries. In order to keep such a mood and make possible ‘sustainable programming education’, learners should positively recognize the value of programming tasks. Sustainable programming education not only leads to raising IT talented persons effectively through specialized curriculum, but makes its position secured as a general and required course for all students.
7476 Johnson, Edwards, and Dai(2014) investigated changes in undergraduate students’ task value and self-efficacy across an academic semester. As a result, task value and self-efficacy showed similar trajectories[13]. And Brown(2018) tried to find relationships between subjective task value and A-level achievement. In conclusion, there were positive associations between achievement and the attainment, intrinsic and utility value[14].
In research on programming, Burgin, Reilly and Traynor(2005) found that students who have high levels of intrinsic motivation and task value perform better in programming. In addition, they use more metacognitive and resource management strategies than low level students[15].
For another study, Yoon, Jang, Jeong, and Lee(2015) applied IT convergence learning to elementary gifted students and measured expectancy-value according to students’ level. Consequently, advanced level students’ expectancy -value score is higher than core level students’ score[16].
3. METHOD
3.1 Research Hypothesis
This study tried to find how elementary school students’ MR implementation experience influences their programming task value. Therefore, the study hypotheses were set up as follows:
RH1. Elementary students’ experience of MR implementation programming will improve their value of programming tasks.
RH2. The group that experiences MR implementation programming will more highly recognize the programming task value than the group which has general programming experience.
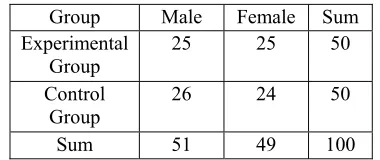
3.2 Participants
[image:4.612.322.512.106.186.2]In this study, 100 sixth-grade students of four classes at G Elementary School participated as subjects, and, according to their class, were divided into an experimental group and a control group. A pre-test was conducted for measuring task value of subjects, and the two groups were verified as being homogeneous. Table 3 shows subjects of the study
Table 3: Subjects of The Study
Group Male Female Sum
Experimental
Group 25 25 50
Control
Group 26 24 50
Sum 51 49 100
3.3 Procedure
After the pre-test, the experimental group received 10 sessions of MR implementation Scratch programming class, and the control group 10 sessions of general Scratch programming class. The contents of the education were developed by using and modifying the program proposed by Kim and Lee (2017) according to the class settings[17]. Table 4 shows instructional design for the experiment.
Table 4: Classes Design
Session Subject Activities
1-2 Meeting First
Overview of the Scratch interface and the blocks
Try simple operation of sprites
3-4 Today’s Diary
Learn how to operate sprite and solve the simple problem
Create and share students’ own project
5-7 Penguin Run,
Demonstrate and overview the game
Complete a partially finished game
Reorganize and create students’ own game
8-10 Catch the Mice
Demonstrate and overview the game
Complete a partially finished game
Reorganize and create students’ own game
7477
3.4 Measures
[image:5.612.89.301.245.619.2]Items were taken from the programming task value scale[18] to assess students’ task value regarding programming. It consists of a total of 13 questions, with 7 questions related to interest and 6 related to usefulness. The same questionnaire was used before and after the experiment. Participants indicated their response to each item on a 6 point scale ranging from 1(strongly disagree) to 6(strongly agree). The items of the questionnaire are shown in table 5.
Table 5: Programming Task Value Survey[19]
Factor No. Question
Interest value
1 I like programming.
2 I am not interested in programming.
3 Programming class is more interesting than other classes. 4 I want to know more about
programming.
5 Solving a problem for programming is interesting. 6 Programming is a pleasant
theme to study.
7 I want to learn programming more time.
Utility value
8 Programming is worthwhile.
9 Knowledge about
programming is not helpful to solve a problem that will occur in the future.
10 Contents in programming class will be helpful to me. 11 Learning programming is
helpful in my everyday life. 12 Compared to other kinds of
knowledge (all of the things learnt in school and everyday life), programming knowledge is useful.
13 It is possible to apply contents of programming to various areas.
4. RESULT AND ANALYSIS
4.1 Group Comparison
4.1.1 Pre-test
Pre-test was conducted in order to find homogenity between the control group and the experimental group. Data were collected in a questionnaire survey. Based on the data, independent sample t-test was conducted with the two groups. The result of the pre-test is presented in table 6.
According to the pre-test, the average task value of the control group was 58.04, and its standard deviation was 12.90. The average task value of the experimental group was 58.95, and its was 10.01. According to the independent sample t-test, the two groups has no statistically significant difference in the average value. Therefore, the two groups were found to be homegenous at the significant level of .05(t=.378, p=.706, p>.05).
4.1.2 Post-test
After 10 sessions of programming class were provided to the experimental and control groups, a post-test was conducted by using the same questionnaire as the one used for the pre-test in this study. To verify homoscedasticity between the two groups, Levene’s test was performed and the result showed that, with p= .027 in interest, p = .009 in utility, and p= .023 in overall task value, the null hypothesis that the two populations have the same variance was rejected (p < .05). Therefore, to compare the averages between the two groups, a Welch-Aspin test was conducted, and the result is shown in table 7.
7478 In conclusion, the result of this study suggests, compared to programming experiences that is solely based on Scratch, MR implementation programming have more positive effects on task value.
4.2 Comparison of Pre-test and Post-test
Results
After 10 sessions of programming class were provided to the subjects, a post-test was conducted by using the same questionnaire as the one used for the pre-test in this study.
To compare perception of programming task value before programming education and after it, a dependent sample t-test was conducted.
4.2.1 Control group
The pre-test and post-test results of the control group which had general programming learning experience were compared. The comparison is presented in table 8
According to the analysis on the pre-test and post-test of the assignment value in the control group, the average assignment value before test was 58.55, and that after test was 55.32. Therefore, the post-test value was a little lower than the pre-test value, but there was no statistically significant difference at t = 1.446 and p= .155 (p > .05). According to the analysis on sub categories, in the sub category of interest, its pre-test average value was 29.78, and its post-test average value was 29.04, and therefore, there was no statistically significant difference between pre-test and post-test values (p > .05). In the sub category of usability, its pre-test average value was 28.26, and its post-test average value was 26.28. The post-test value was lower than the pre-test value, and there was a statistically significant difference (p < .05).
Given the results, the study subjects had interest and overall task value in the same levels statistically before and after experiment. Therefore, their recognition at the beginning remained unchanged in a certain level. However, in case of utility, its value fell significantly. That was because the programming class in a beginning level fell short of their large expectation for programming usability which they had at the beginning.
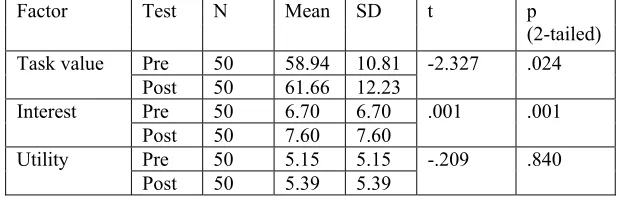
4.2.2 Experimental group
Table 9 presents the comparison between pre-test and post-test results of the experimental
group which experienced MR implementation programming.
The average interest, which is one of the sub-factors, was higher after the experiment, with a significant difference found in a paired sample t-test, with t = -3.516 and p = .001(p < .05). In another sub-factor, utility, the average was slightly higher after the experiment compared to before the experiment. However, the difference was not statistically significant with t = -.209 and p = .840 (p > .05). This implies learners perceived the same level of utility value related to programming before and after the experiment.
Regarding the overall task value, the average was higher in the post-test than in the pre-test, with t = -2.327, p = .024, indicating a statistically significant difference (p < .05). In conclusion, MR implementation experiences had positive effects on improving task value in learners, especially on interest.
5. CONCLUSION
This study found MR implementation experiences had positive effects on perception of programming task value among learners. With recently growing awareness of the need for software education, further research and effort are required in order to continue such awareness. In that regard, it is important to find a way to help teachers, students, and parents have positive perception of the task value of overall software education. Such continued awareness of the need for software education among participants of the education field will create the foundation for fostering members of society equipped with knowledge of information culture, which is essential in the age of the fourth industrial revolution.
REFRENCES:
[1] https://www.gartner.com/newsroom/id/3482617 22:00 GMT +9 and 04/07/2018
[2] Paul Milgram, and Fumio Kishino, “A Taxonomy of Mixed Reality Visual Displays”, IEICE Transactions on Information Systems, Vol. E77-D, No. 12, 1994, pp.1321-1329. [3] Ronald T. Azuma, “A Survey of Augmented
Reality”, Presence, Vol. 6, No, 3, 1997, pp. 355-385.
7479 Electronics and Telecommunications Trends, Vol. 22, No. 4, 2007, pp.87-95.
[5] Brett E. Shelton, “How Augmented Reality Helps Students Learn Dynamic Spatial Relationships”, Ph,D. dissertation, University of Washington, 2003.
[6] https://scratch.mit.edu/projects/editor/?tip_bar =home GMT+9 and 04/15/2018
[7] https://scratch.mit.edu/projects/163230374/ GMT+9 and 04/15/2018
[8] https://scratch.mit.edu/projects/163740082/ GMT+9 and 04/15/2018
[9] Allan Wigfield and Jacquelynne S. Eccles, “Expectancy-Value Theory of Achievement Motivation”, Contemporary Educational Psychology, Vol. 25, No.1, 2000, pp.68-81. [10] Jacquelynne Eccles, “Expectancies, Values, and
Academic Behaviors”, Achievement and Achievement Motives, 1983, pp.76-146. [11] Yun Hee Song, “The Structural Relationships
among Task Value, Academic Burnout, Learning Satisfaction and Persistence in an e-Learning Course”, Journal of Lifelong e-Learning Society, Vol. 9, No. 3, 2013, pp.171-187. [12] Mimi Bong, “Role of Self-Efficacy and
Task-Value in Predicting College Students’ Course Performance and Future Enrollment Intentions”, Contemporary Educational Psychology, Vol. 26, No. 4, 2001, pp.533-570.
[13] Marcus Lee Johnson, Ordene V. Edwards, and Ting Dai, “Growth Trajectories of Task Value and Self-efficacy Across and Academic Semester”, Universal Journal of Educational Research, Vol. 2, No. 1, 2014, pp.10-18. [14] Carol Brown, “What Motivates A-level
Students to Achieve? Exploring the Role of Expectations and Task Values”, The Psychology of Education Review, Vol. 42, No. 1, 2018, pp.53-63.
[15] Susan Bergin, Ronan Reilly and Desmond Traynor, “Examining the Role of Self-Regulated Learning on Introductory Programming Performance”, Proceedings of The First International Workshop on
Computing Education Research, University of
Washington (USA), October 1-2, 2005, pp.81-86.
[16] Il-Kyu Yoon, Yun-Jae Jang, Soon-Young Jeong, and Won-Kyu Lee, “An Analysis of the Difference of Perception on IT Convergence Learning after the Smart Device based Robot
Programming Education According to Elementary Gifted Students’ Level”, Journal of the Korea Society of Computer and Information, Vol. 20, No. 5, 2015, pp.161-169.
[17] Ji-yun Kim and Tae-wuk Lee, “Development of Scratch Learning Contents using Webcam for Enhancing Interest in Programming”,
Proceedings of The Korean Association of
Computer Education Conference, DCU
(Korea), August 10-11, 2017, pp.121-124. [18] Ji-Yun Kim and Tae-Wuk Lee, “Development
of Scale Tools for Measure Programming Task Value and Learning Persistence at Elementary School Students”, Journal of The Korea Society of Computer and Information, Vol. 22, No. 9, 2917, pp.187-192.
[19] Ji-Yun Kim, “The Effect of Mixed Reality Programming based Motion Recognition on Task Value and Persistence of Elementary Students”, Master’s thesis, Korea National University of Education, 2018.
7480
Table 2: Video-related Blocks of Scratch[6]
Blocks Field Use
Events greater than a specified value. Runs a script when the video motion if
Sensing
Check the amount of motion over the entire video image.
Check the amount of motion in the video under the current sprite.
Check the direction of motion in the video under the current sprite
Check the direction of motion in the video image.
Turn the video camera on.
Turn the video camera off.
Set the video transparency from 0-100. Higher numbers make the video more transparent(lighter), while lower numbers make it less transparent(darker).
7481
Table 6: Result of the Pre-test.
Factor Group N Mean SD Levene’s test t p
(2-tailed)
F p
Task value Control 50 12.90 12.90 1.947 .166 .378 .706 Experimental 50 10.81 10.81
Interest Control 50 29.78 8.39 2.368 .127 -.066 .948
Experimental 50 29.68 6.70
Utility Control 50 28.26 2.13 .086 .770 .972 .333
[image:9.612.110.418.400.499.2]Experimental 50 29.26 5.15
Table 7: Result of the Post-test.
Factor Group N Mean SD Levene’s test t p
(2-tailed)
F p
Task value Control 50 55.32 18.66 5.304 .023 2.009 .048 Experimental 50 61.66 12.23
Interest Control 50 29.04 10.52 5.043 .027 1.765 .081
Experimental 50 32.28 7.60
Utility Control 50 28.26 5.13 7.044 .009 2.152 .034
Experimental 50 29.26 5.15
Table 8: Comparison between Pre-test and Post-test Results of Control Group
Factor Test N Mean SD t p
(2-tailed)
Task value Pre 50 58.04 12.90 1.446 .525
Post 50 55.32 18.66
Interest Pre 50 29.78 8.39 .640 .027
Post 50 29.04 10.52
Utility Pre 50 28.26 5.13 2.280 .155
Post 50 26.28 8.64
Table 9: Comparison between Pre-test and Post-test Results of Experimental Group
Factor Test N Mean SD t p
(2-tailed)
Task value Pre 50 58.94 10.81 -2.327 .024
Post 50 61.66 12.23
Interest Pre 50 6.70 6.70 .001 .001
Post 50 7.60 7.60
Utility Pre 50 5.15 5.15 -.209 .840
[image:9.612.111.421.538.637.2]![Figure 1: Virtuality Continuum(VC)[2]](https://thumb-us.123doks.com/thumbv2/123dok_us/8901403.955017/2.612.93.294.418.666/figure-virtuality-continuum-vc.webp)
![Figure 2: Scratch Project: Let’s Make My Own Instrument[7]](https://thumb-us.123doks.com/thumbv2/123dok_us/8901403.955017/3.612.91.299.250.411/figure-scratch-project-let-s-make-instrument.webp)
![Table 5: Programming Task Value Survey[19]](https://thumb-us.123doks.com/thumbv2/123dok_us/8901403.955017/5.612.89.301.245.619/table-programming-task-value-survey.webp)
![Table 2: Video-related Blocks of Scratch[6]](https://thumb-us.123doks.com/thumbv2/123dok_us/8901403.955017/8.612.101.526.111.611/table-video-related-blocks-of-scratch.webp)