ORIGINAL RESEARCH ARTICLE
STATISTICAL APPROACHES IN TENSILE TESTS OF BOND STRENGTH
1
Ivan Balducci,
2Fernanda Alves Feitosa,
2, *Amjad Abu Hasna,
4Amanda Guedes Nogueira Matuda,
5Marcia Carneiro Valera,
6César Rogério Pucci and
7Rodrigo Maximo de Araújo
1PhD – Department of Social and Pediatric Dentistry, São Paulo State University (Unesp),Institute of Science and Technology, São Jose dos Campos, São Paulo, Brazil
2DDS,MSc, PhD– Department of Social and Pediatric Dentistry, São Paulo State University (Unesp),Institute of Science and Technology, São Jose dos Campos, São Paulo, Brazil, and São Lucas university (Av. Da saudade, 26- Caçapava-SP, Brazil)
3DDS, MSc, PhD Student – Department of Restorative Dentistry, Endodontic Division, São Paulo State University (Unesp), Institute of Science and Technology, São José dos Campos, São Paulo, Brazil
4DDS, MSc Student – Department of Restorative Dentistry, Operative Dentistry Division,São Paulo State University (Unesp), Institute of Science and Technology, São José dos Campos, São Paulo, Brazil
5DDS, MSc, PhD, Full Professor – Department of Restorative Dentistry, Endodontic Division, São Paulo State University (Unesp), Institute of Science and Technology, São José dos Campos, São Paulo, Brazil
6DDS, MSc, PhD, Ass prof – Department of Restorative Dentistry, Operative Dentistry Division, São Paulo State University(Unesp), Institute of Science and Technology, São José dos Campos, São Paulo, Brazil
7DDS, MSc, PhD, Ass prof – Department of Dental Materials and Prosthodontic, São Paulo State University, Institute of Science and Technology, São Jose dos Campos, São Paulo, Brazil
ARTICLE INFO ABSTRACT
This study aimed to analyze data of bond strength tests of composite resin by different statistical approaches using 48-bovine teeth embedded in acrylic resin after sectioned 2 mm below the cemento-enamel junction and divided into four-groups (n=12). Firstly, micro-tensile test (Mi), Adper Single Bond 2- (3M) was applied over an area of 8 mm2, followed by air jet for 2 to 5s and
light cured for 15s and then Z350 XT- (3M) composite resin was inserted. For each tooth a variable number of toothpicks was obtained. For macro-tensile (Ma), the smallest base of the conical specimens was 2 mm. In both tests the specimens were stored differently: G1 Mi and G3 Ma for 24 hours in water, G2 Mi and G4 Ma were artificially aged by thermocycling and then the tests were performed. Data were submitted to exploratory analysis; Weibull analysis; 2-way ANOVA and Tukey; and Student's t-test. Descriptive statistics and Weibull analysis results for the UK (MPa) data were: G1 (modulus; mean ± standard deviation: (2.54; 10.76±4.21); G2 (3.36; 19.34±6.42), G3 (1.96; 3.17±1.51), G4 (1.75; 2.86±1.68). The 2-way ANOVA test, α=5 % indicates significant interaction effect and Tukey (5%). Conclusion: the different statistical strategies indicated the same results.
Copyright © 2019, Ivan Balducci et al., This is an open access article distributed under the Creative Commons Attribution License, which permits unrestricted use, distribution, and reproduction in any medium, provided the original work is properly cited.
INTRODUCTION
Adhesion has been improved significantly by acid etching technique (Buonocore 1955). In the search for improving this technique, it has passed three steps started with no-etch technology and then updated to total-etch and finally to self-etch technology of enamel and dentin, to improve the adhesion between composite resin and dental substrate, by demineralization of the organic portion of the dental substrate (Sofan et al., 2017). The application of a phosphoric acid gel results in micro-retentions and exposure of dentin collagen fibers, which are impregnated by resinous monomers associated to solvents, establishing a bond with the dentin
structure, called a hybrid or intermediate layer, composed of collagen and resinous monomer (Nakabayashi et al., 1982). In this sense and in order to evaluate the adhesion of the composite resin, shear and tensile bond strength (BS)were studied by variety of mechanical tests, however, the tensile BS test is more appropriate for evaluating the adhesive capabilities of resin composites(Della Bona and van Noort 1995), by macro-tensile test (Braga et al., 2010) micro-tensile test (Sano
et al., 1994; Cengiz and Ünal 2019). In macro-tensile tests, the specimens are single large units, less fragile when handled, dispensing with the cutting process, without extra forces being impressed on them, thereby eliminating premature failures, however, the BS evaluation is restricted to only one interface
ISSN: 2230-9926
International Journal of Development Research
Vol. 09, Issue, 10, pp. 30371-30376, October, 2019
Article History:
Received 17th July, 2019
Received in revised form 26th August, 2019
Accepted 04th September, 2019
Published online 16th October, 2019
Key Words:
Bond strength, Weibull analysis, 2-way ANOVA, Student's t-test.
*Corresponding author: Amjad Abu Hasna
Citation: Ivan Balducci, Fernanda Alves Feitosa, Amjad Abu Hasna et al, 2019. “Statistical approaches in tensile tests of bond strength”, International Journal of Development Research, 09, (10), 30371-30376.
(Braga et al., 2010). On the other hand, in micro-tensile tests, the technique is very sensitive due to the cutting process that induces an addition stress, reflected in pre-test failures, but more samples could be obtained and more interfaces evaluated and thus more accurate results could be founded (Guzmán-Ruiz et al., 2001). A specific methodology was developed to perform micro-tensile tests by means of serial sectioning of the samples, resulting in regular sticks consisting of resin composite/adhesive and tooth structure. These sticks are well fixed onto an appropriate device for the micro-tensile test, and submitted to testing in a universal test machine (Gamborgi et al., 2007; Shori et al., 2013; Sathish et al., 2019). In this test it is possible to obtain multiple specimens from a single unit of material, and evaluate the BS in diminutive areas (≤ 1mm2) there by favoring the measurement of strength in clinically important substrates (Pashley et al., 1995). In micro-tensile test, the technique is complex, and during the serial cuts, a significant loss of material may occur due to the thickness of the cutting discs. The obtained results may be influenced by factors such as the type of device used, mode of specimen fixation onto the devices, specimen dimension and geometry, bonded surface area and speed of the test used (Poitevin et al.,
2008; Armstrong et al., 2010). There are still doubts about the results of tensile tests, because if there is the possibility of evaluating smaller areas and a larger number of samples in micro-tensile tests, on the other hand, various cuts lead to loss of material and may affect the end results. Thus, the aim of the present study was to compare different statistical approaches used in tensile studies, associating the results with the benefits and difficulties inherent to both types. The null hypothesis was that the different statistical strategies would indicate the similar results.
MATERIALS AND METHODS
Specimen preparation: Forty-eight bovine teeth were selected. All roots were sectioned with diamond disk (Dremel, Breda, Holland) approximately 2 mm below the cement-enamel junction. The obtained crowns were flattened and polished with abrasive paper in a polishing machine (DP-10, Panambra, São Paulo-SP, Brazil) under water cooling, to expose the dentin area and divided into 2 groups/N=24: macro-tensile and micro-macro-tensile. On the lingual surface of the crowns, an opening was made at the cingulum with a 1016 HL spherical drill (KG Sorensen, Rio de Janeiro, RJ, Brazil) to permit the entrance of a thickness gauge (Golgran, São Caetano do Sul, SP, Brazil) in order to be measure and standardize the thickness of dentin in 2 mm. Then, the hole of the lingual surface was closed with utility wax and the teeth crowns embedded in colorless self-polymerized acrylic resin (Jet- Articles Odontológicos Clássicos LTDA., São Paulo-SP) using an industrial silicone matrix (Rhodorsil - Classical Dental Articles, Campo Limpo Paulista, SP, Brazil). Dentin was etched with 37% phosphoric-acid (Condac, FGM, Joinvile, Santa Catarina, Brazil) for 15s and washed with water. Adhesive (Adper Single Bond 2, 3M/ESPE, St. Paul, Mn, USA) was applied and light-cured (XL3000, 3M/ESPE, St. Paul, MN-USA - power density of 600mW/cm2), according to manufacturer´s instructions. For Ma, the resin-composite was inserted using a Teflon mold to produce a truncated-cone shaped specimen with a 2mm narrower diameter base (bonding interface), and a 4mm wider base diameter, with a length of 4mm. Specimens were stored for 24h. For Mi, the resin composite (Z350 XT, 3M/ESPE, St. Paul, Mn, USA) was
inserted using a silicone matrix with an orifice 8mm-diameter by the incremental technique and light-cured for 20s. After 24h storage in distilled water/38ºC, samples were sectioned.
Ma and Mi samples were divided into 2 subgroups (n=12) according to the storage conditions before the tensile test.
Group1 (Ma) = macro-tensile test of samples after 24h in water storage (Ma).
Group2 (Mi) = micro-tensile test of samples after 24h in water storage (Mi).
Group3 (MaT) = macro-tensile test of samples after submitted to artificial aging by thermo cycling (TC) in a thermal cycling machine (Ética Equipamentos, Vargem Grande Paulista, Sao Paulo, Brazil) for 5000x/30s baths (~55 and 5ºC).
Group4 (MiT) = micro-tensile test of samples after submitted to artificial aging as in MaT group.
Bond strength analysis: Mi groups- The 24 samples were placed in a circular device located in the upper part of the machine and fixed with screws to keep in parallel to the cutting blade of the cutter. The specimens were sectioned parallel to the cutting blade of the cutter. Sectioning was performed in the cervico-incisal direction into slices, and then in the mesiodistal direction in beams, using a precision cutting machine with water cooling (Labcut 1010; Extec, Enfield, CT, USA), This generated a number of sticks consisting of composite resin and dentine. The distance between the cuts was standardized by three turns of the cutter for all sections, in order to obtain slices of close lateral dimensions varying between 0.8 and 1.0 mm. This procedure was repeated five times, obtaining in this way four slices in the cervico-incisal direction. The direction of the cutter was then rotated so that the same number of cuts were obtained in mesio-distal direction. In this way, sticks were obtained from the samples, in different numbers due to losses during cutting. These were duly identified and separated, each group of sticks corresponding to a respective sample. The edges of the sample were discarded, and only the sticks that presented a rectangular shape with dentin and a sharply composed resin were considered. Each stick was measured with a digital caliper and bonded with cyanoacrylate-gel adhesive (Henkel, Itapevi, SP, Brazil) to the test device by its extremity. Ma groups-a bipartite copper device was attached to the resin cylinder which received a steel ring for joining the parts of the copper device and the assembly coupled by a screw that allowed attachment to the Emic test machine. The specimens were submitted to the mechanical tests in a universal test machine (EMIC DL-1000, ERIOS, São José dos Pinhais, PR, Brazil), with a load cell of 10kgf, at the speed of 0.5mm/min, in accordance with the ISO/TR 11405:1994. (ISO, 1994).
Later, the samples were submitted to fracture analysis using a stereomicroscope (Discovery V20, ZEISS, Oberkochen, Germany). Fractures were classified as:
1. Cohesive fracture in composite resin; 2. Cohesive fracture in dentin;
3. Adhesive fracture in dentin / adhesive interface; 4. Adhesive fracture in adhesive / resin interface;
Statistical analysis: The experimental design of this work used as factors, or experimental variables, the type of storage (24 h and 6 months) and the method (macro-tensile and micro-tensile). Data were submitted to exploratory analysis; Weibull analysis, parametric approach (ANOVA and Tukey) and Student's t-test. The sample size was estimated by means of a power calculation, under two conditions of population variability. In the first condition, the variability was expressed via standard deviation equal to 5MPa. In the other condition the value was 10MPa. (Al-Salehi and Burke 1997; Braga et al.,
2010)
RESULTS
To analyze the obtained BS data under two thermal cycling conditions (with and without accelerated aging), the Weibull model was applied. Table 1 and Figure 1. Showed the Weibull analysis for the data of Ma and Mi testes, of all groups. In the Ma test, it could be verified that: (i) there were values with a high level of variability, (ii) the modulus values are similar, they did not differ statistically (test 2 = 0.0627; gl =1; p-value = 0.802>0.05).In the Mi test, it could be verified that: (i) the localization values (or scale) differed (test 2 = 14.283; gl = 1; p-value = 0.0001>0.05); while the modulus values are similar (test 2 = 0.532; gl = 1; p-value = 0.466>0.05). In both tests, the BS values followed the Weibull model, because the adjustment indication value, "r" value, is close to 1.
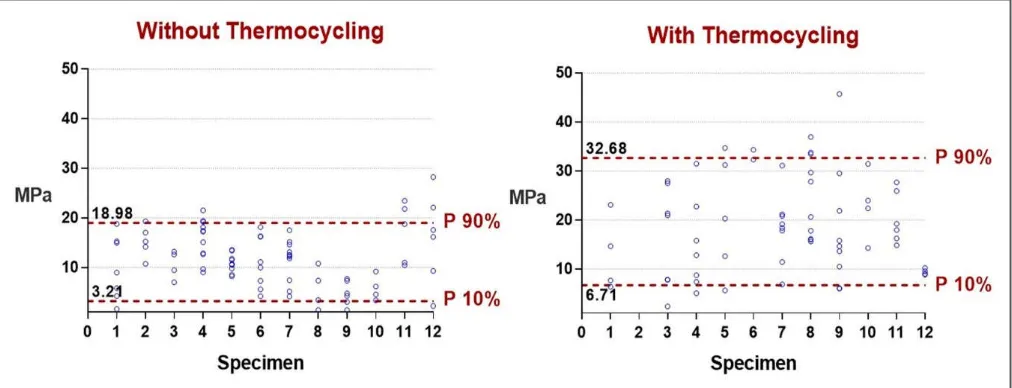
[image:3.595.40.559.402.531.2]In order to evaluate the influence of the Pre-Test Failures (PTF) on the BS values, under two thermal cycling conditions, PTF prevalence rates equal to 37% (=4) for the condition without thermal cycling, and PTF equal to 32% (=21/66) for the condition with thermal cycling were observed (Figure 2). In table 2, the standard deviation values of the micro-tensile test are 3 to 4 times higher than the macro-tensile test. In order to make a direct comparison between the Ma and Mi tests, via the analysis of variance (ANOVA) model, it was noted that the requisite of homoscedasticity is not met, therefore, making it impossible to apply the ANOVA model. To evaluate the effect of extreme measurements, analysis was performed with data in the percentile range, with the intention of being able to meet the supposition of homoscedasticity. Therefore, direct comparison was made between the two types of bond strength tests via the Tukey test (5%), after verifying that the effect of interaction was statistically significant, Table 3. Regardless the treatment, it was noted that the result of the multiple comparisons was maintained; that is (i) the data obtained in the Ma test differed statistically from the data obtained in the Mi test, with or without thermal cycling; (ii) thermal cycling had an influence on the micro-tensile test. In terms of BS, it was verified that the thermal cycled samples presented higher bond strength values for the adhesive, cohesive dentin and cohesive resin types of failures. According to the Student's t-test, the mean values differed statistically in the case of adhesive failures (t = 2.32; gl = 15; p-value = 0.031<0.05) and in the
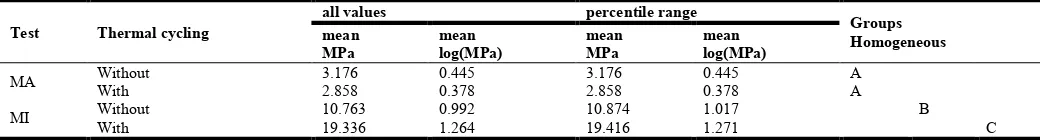
Table 1. Weibull Analysis* for the data** of MA and MI testing, according to aging
Statistics Macrotensile Microtensile
WOT WT General WOT WT
N 10 10 20 12 11
mean 3.176 2.858 3.017 10.76 19.34
Sd 1.505 1.682 1.562 4.21 6.42
cv(%) 47.38 58.84 51.76 39.16 33.21
modulus 1.959 1.754 1.946 2.548 3.362
scale 3.644 3.218 3.415 12.101 21.497
coeff. corr. (r) 0.984 0.945 0.978 0.934 0.986
σ1º 0.348 0.239 0.321 1.990 5.473
σ5º 0.800 0.592 0.742 3.773 8.887
σ10º 1.156 0.892 1.074 5.004 11.008
σ50% 3.022 2.612 2.829 10.480 19.277
(WOT: without thermal cycling; WT: with thermal Cycling).
[image:3.595.38.561.585.646.2]*estimate of parameters: method of minimum squares,** two teeth were lost in the macrotensile test, and one tooth in the microtensile test under accelerated artificial aging.
Table 2. Result of t-test(Student's)
Test WOT WT Student’s-t test – gl (range) (17 to 19) IC (95%) p-Value
MA 3.18±1.50 2.86±1.68 0.45 -1.18 to 1.82 p = 0.662
MI 10.76±4.21 19.34±6.42 3.75 3.75 to 13.40 p = 0.002*
MI (PTF=0) 8.12±4.21 15.40±4.86 3.82 3.30 to 11.26 p = 0.001*
MI (PTF=4) 9.22±3.68 16.13±4.66 3.92 3.22 to 10.60 p = 0.001*
MI (PTF=1/2) 8.65±4.24 16.57±5.48 3.85 3.60 to 12.24 p = 0.001*
Without Thermal Cycling (WOT) vs. With Thermal Cycling (WT) Mean (± standard deviation) BS data (MPa) in MA and MI tests. Interval of Confidence (IC: 95%) and hypothesis test in comparison of mean values.
PTF: pre-test failure (values attributed: zero, 4 MPa and half of the minimum value in the group).*p<0.05
Table 3. Result of Tukey multiple comparison of means test (5%) for the four experimental conditions. Formation of homogeneous groups in terms of bond strength
Test Thermal cycling
all values percentile range
Groups Homogeneous mean
MPa
mean log(MPa)
mean MPa
mean log(MPa)
MA Without 3.176 0.445 3.176 0.445 A
With 2.858 0.378 2.858 0.378 A
MI Without 10.763 0.992 10.874 1.017 B
With 19.336 1.264 19.416 1.271 C
(1) 2-way ANOVA, interaction effect, F statistics
gl(1;39) = 12.60; p-value = 0.001; (2) F statisticsgl(1;39) = 17.54; p-value = 0.001; (3) F statisticsgl(1;39) = 5.94;
p-value = 0.020; (4) F statistics
[image:3.595.38.558.716.786.2]case of cohesive dentin failures (t = 2.53; gl = 9; p-value = 0.032<0.05), however, no difference was verified for the case of cohesive resin type failures (t = 1.04; gl = 8; p-value = 0.327>0.05).
DISCUSSION
Adhesion is a revolutionary technique that introduced to dentistry firstly by (Buonocore 1955). It started by no-etch technology and then updated to total-etch and finally to self-etch technology (Sofan et al., 2017). Therefore, many studies were elaborated in this area. However, diverse results were obtained due to different statistical approaches used(Braga et al., 2010; Cengiz and Ünal 2019; Sathish et al., 2019; Armstrong et al., 2010; Armstrong et al., 2017). In this study, two different methodologies were used in order to evaluate the bond strength by macro-tensile and micro-tensile testes. In addition, two groups of each test were studied the specimens of first group were stored at 37° C for 24 h in water, and the specimen of the second group were submitted to artificial aging by thermo cycling (TC) in a thermal cycling machine for 5000x/30s baths (~55 and 5ºC). In this study, bovine teeth were used due to the similarity in the chemical composition of these teeth with the human teeth, in another study, bovine teeth were considered as the best choice to substitute the human teeth in laboratory research (Teruel et al., 2015). The proposal of this study was to evaluate the obtained results in various statistical approaches with tow variances, the first one was the method of test, Ma and Mi, and the second one was the storage period, for 24 hours and thermo-cycled simulating 6 months of artificial aging. The statistical test may frequently determine variations in results, compromising comparisons between researches (Van Meerbeek et al., 2010; Burrow et al., 2004). In micro-tensile test, the tested area was 8 mm2, in order to allow cutting and to obtain a sufficient number of sticks for validating the research; that is, a mean number of 5 sticks per specimen. The procedure to perform macro-tensile test is easier as it is performed with a single sample, which probably induces a lower probability of processing errors(al-Salehi and Burke 1997; Sirisha, Rambabu, Shankar, et al., 2014). However, Micro-tensile tests are more reliable than macro-tensile tests (Sirisha, Rambabu, Ravishankar, et al., 2014; Otani et al., 2015). To analyze obtained data of BS and tensile
tests of restorative materials, Burrow et al.19concluded that Weibull analysis is suitable test to determine the reliability of strength measurements. In this study, the obtained data were submitted to Weibull analysis, and the results showed that in Ma the TC condition did not influence the BS values (Table 1). The same results were found in previous researches, without significant differences between the 24h and TC conditions (Scherrer et al., 2010; Ghassemieh 2008). However, in micro-tensile test, the TC influenced the results the statistical differences. Otherwise, the same results were obtained when other statistical methods were used to analyze the obtained data in both micro-tensile and macro-tensile tests, as in 2-way ANOVA and Student's t-test. In a recent study, (Nicoloso et al., 2019) evaluating the BS of adhesive systems, 2-way ANOVA and Tukey test were used to evaluate the obtained data of micro-tensile test. In this study, two different artificial aging methods were used, in addition to 24 hours storage method, and the results showed no statistical difference founded between the methods of artificial aging when compared to 24 hours storage method. In the present study, the same results were obtained in macro-tensile test but not to micro-tensile strength. However, similar results were obtained by the same statistical method, in which as in the results of the present study in micro-tensile test, greater BS of adhesive system was founded after artificial aging of the samples due to the presence of methacryloyloxydecyl dihydrogen phosphate in these system according to the same study (Muñoz et al.,
2015). In this study, the different statistical strategies indicated the same results, confirming the null hypothesis tested. When analyzing the BS results under the influence of the type of test and condition of thermal cycling, via the two-way ANOVA model, the requirements for valid application of this statistical model, especially homoscedasticity, were considered; i.e., the same variability among the four groups. Therefore, in a direct comparison between Ma-Mi test, in various approaches (with or without logarithmic transformation), the same performance could always be found; that is, the same result between the four mean BS values (Table 3). An explanation of why MA test resulted in lower values may be the shape of the samples, thereby generating non uniform distribution of stresses and low bond strength values, which is verified by previous research, especially in regard to conical shape (Goracci et al.,
[image:4.595.46.552.60.254.2]2004; Braga et al., 2010). In the exploratory analysis, the Figure 1. Dotplot Graph of the BS values obtained in the microtensile test for each "stick" (indicated by the blue-colored circle), irrespective of type of failure (TF) according to the tooth. Traced lines indicate percentage values 10% and 90%. Without thermal
influence of extreme values in comparison with mean values was evaluated. It was verified that analysis of the data could be performed ignoring 10% of the extreme values, thus obtaining more representative data, with reduction in the coefficient of variation. In Table 2 the coefficient of variation (cv) was elevated, corroborating the study of (Scherrer et al., 2010), which found values (cv) between 20 and 50%. Student t-test is also a suitable statistical approach to be used to evaluate the obtianed data of BS testes. Maroun et al., (2019) used the Student t-test to evaluate the BS of self-adhesive resin cement to ceramic of zirconia. In the present study, Student t-test presented the same results obtained with the other statistical methods. Comparative evaluation between the TC conditions for the micro-tensileteste showed the same prevalence of adhesive failures, being around 40% for the Mi group and 42% for the MiT group. Prevalence of adhesive failures was also found by a other study (Betamar et al., 2007). In macro-tensile test, the failures were predominantly adhesive (80%) and in the remaining 20% of the samples they were cohesive in resin, and this could be due to the fact that smaller test areas result in a larger number of adhesive failures according to previous studies (Phrukkanon et al., 1998; Braga et al., 2010; Guzmán-Ruiz et al., 2001). Nicoloso et al., (2019) showed that the adhesive failures were the predominant type at the resin-dentin interface followed by adhesive failures mixed with cohesive failure of the adjacent substrate in a study evaluated four different types of adhesive systems. These results agree with another study evaluated the shear bond strength of seven adhesive systems, in a study that used bovine teeth, and founded that the adhesive failure were the dominant type (Franz et al., 2018). It may be observed that due to the great variability of the tests and methodology of the studies, it is difficult to compare the obtained results. Thus, different results are generated and correlation among them is difficult. However, as the proposal of the present study was to use different statistical approaches in analyzing the obtained data and compare the results. It was concluded that different statistical approaches showed the same results.
Acknowledgment: The authors declare no conflict of interest, the authors had no financial support.
REFERENCES
Al-Salehi, S.K. And Burke, F.J. 1997. Methods Used In Dentin Bonding Tests: An Analysis Of 50 Investigations On Bond Strength. Quintessence International (Berlin,
Germany : 1985) 28(11), Pp. 717–723.
Armstrong, S., Breschi, L., Özcan, M., Pfefferkorn, F., Ferrari, M. And Van Meerbeek, B. 2017. Academy Of Dental Materials Guidance On In Vitro Testing Of Dental Composite Bonding Effectiveness To Dentin/Enamel Using Micro-Tensile Bond Strength (Μtbs) Approach.
Dental Materials : Official Publication Of The Academy Of Dental Materials 33(2), Pp. 133–143.
Armstrong, S., Geraldeli, S., Maia, R., Raposo, L.H.A., Soares, C.J. And Yamagawa, J. 2010. Adhesion To Tooth Structure: A Critical Review Of “Micro” Bond Strength Test Methods. Dental Materials : Official Publication Of
The Academy Of Dental Materials 26(2), Pp. E50–62.
Betamar, N., Cardew, G. And Van Noort, R. 2007. Influence Of Specimen Designs On The Microtensile Bond Strength To Dentin. The Journal Of Adhesive Dentistry 9(2), Pp. 159–168.
Braga, R.R., Meira, J.B.C., Boaro, L.C.C. And Xavier, T.A. 2010. Adhesion To Tooth Structure: A Critical Review Of “Macro” Test Methods. Dental Materials : Official Publication Of The Academy Of Dental Materials 26(2), Pp. E38–49.
Buonocore, M.G. 1955. A Simple Method Of Increasing The Adhesion Of Acrylic Filling Materials To Enamel Surfaces. Journal Of Dental Research 34(6), Pp. 849–853. Burrow, M.F., Thomas, D., Swain, M.V. And Tyas, M.J. 2004.
Analysis Of Tensile Bond Strengths Using Weibull Statistics. Biomaterials 25(20), Pp. 5031–5035.
Cengiz, T. And Ünal, M. 2019. Comparison Of Microtensile Bond Strength And Resin-Dentin Interfaces Of Two Self-Adhesive Flowable Composite Resins By Using Different Universal Adhesives: Scanning Electron Microscope Study. Microscopy Research And Technique.
Della Bona, A. And Van Noort, R. 1995. Shear Vs. Tensile Bond Strength Of Resin Composite Bonded To Ceramic.
Journal Of Dental Research 74(9), Pp. 1591–1596.
Franz, A., Lettner, S., Watts, D.C., Graf, A., Moritz, A. And Schedle, A. 2018. Analysis Of Pre-Test Failures And Bond-Strengths Of Seven Adhesive Systems To Bovine Dentine: A Nine-Year Novice/Beginner Operator Study.
Dental Materials : Official Publication Of The Academy Of Dental Materials 34(11), Pp. 1599–1609.
Gamborgi, G.P., Loguercio, A.D. And Reis, A. 2007. Influence Of Enamel Border And Regional Variability On Durability Of Resin-Dentin Bonds. Journal Of Dentistry
35(5), Pp. 371–376.
Ghassemieh, E. 2008. Evaluation Of Sources Of Uncertainties In Microtensile Bond Strength Of Dental Adhesive System For Different Specimen Geometries. Dental Materials : Official Publication Of The Academy Of Dental Materials
24(4), Pp. 536–547.
Goracci, C., Sadek, F.T., Monticelli, F., Cardoso, P.E.C. And Ferrari, M. 2004. Influence Of Substrate, Shape, And Thickness On Microtensile Specimens’ Structural Integrity And Their Measured Bond Strengths. Dental Materials : Official Publication Of The Academy Of Dental Materials
20(7), Pp. 643–654.
Guzmán-Ruiz, S., Armstrong, S.R., Cobb, D.S. And Vargas, M.A. 2001. Association Between Microtensile Bond
Strength And Leakage In The Indirect Resin
Composite/Dentin Adhesively Bonded Joint. Journal Of Dentistry 29(2), Pp. 145–153.
Maroun, E.V., Guimarães, J., De Miranda, W.G., Netto, L., Elias, A.B. And Da Silva, E.M. 2019. Bond Strength Stability Of Self-Adhesive Resin Cement To Etched Vitrified Yttria-Stabilized Tetragonal Zirconia Polycrystal Ceramic After Thermomechanical Cycling. Operative Dentistry.
Van Meerbeek, B., Peumans, M., Poitevin, A., Et Al., 2010. Relationship Between Bond-Strength Tests And Clinical Outcomes. Dental Materials : Official Publication Of The
Academy Of Dental Materials 26(2), Pp. E100–21.
Muñoz, M.A., Luque-Martinez, I., Malaquias, P., Et Al., 2015. In Vitro Longevity Of Bonding Properties Of Universal Adhesives To Dentin. Operative Dentistry 40(3), Pp. 282– 292.
Nakabayashi, N., Kojima, K. And Masuhara, E. 1982. The Promotion Of Adhesion By The Infiltration Of Monomers Into Tooth Substrates. Journal Of Biomedical Materials Research 16(3), Pp. 265–273.
Bond Strength Of Adhesive Systems. General Dentistry
67(3), Pp. 71–76.
Otani, A., Amaral, M., May, L.G., Cesar, P.F. And Valandro, L.F. 2015. A Critical Evaluation Of Bond Strength Tests For The Assessment Of Bonding To Y-Tzp. Dental Materials : Official Publication of The Academy Of Dental Materials 31(6), Pp. 648–656.
Pashley, D.H., Sano, H., Ciucchi, B., Yoshiyama, M. And Carvalho, R.M. 1995. Adhesion Testing Of Dentin Bonding Agents: A Review. Dental Materials : Official Publication Of The Academy Of Dental Materials 11(2), Pp. 117–125.
Phrukkanon, S., Burrow, M.F. And Tyas, M.J. 1998. The Influence Of Cross-Sectional Shape And Surface Area On The Microtensile Bond Test. Dental Materials : Official Publication Of The Academy of Dental Materials 14(3), Pp. 212–221.
Poitevin, A., De Munck, J., Van Landuyt, K., Et Al., 2008. Critical Analysis Of The Influence Of Different Parameters On The Microtensile Bond Strength Of Adhesives To Dentin. The Journal Of Adhesive Dentistry 10(1), Pp. 7–16. Sano, H., Shono, T., Sonoda, H., Et Al., 1994. Relationship Between Surface Area For Adhesion And Tensile Bond Strength--Evaluation Of A Micro-Tensile Bond Test.
Dental Materials : Official Publication of The Academy Of Dental Materials 10(4), Pp. 236–240.
Sathish, S., Lakshmi, S., Patel, P. And Annapoorni, H. 2019. Effect Of Thermocycling On The Micro-Tensile Bond Strength Between Self-Adhesive Resin Cement And Nonphosphate Monomer Cements On Zirconium-Oxide
Ceramics. Indian Journal Of Dental Research : Official Publication Of Indian Society for Dental Research 30(1), Pp. 73–79.
Scherrer, S.S., Cesar, P.F. And Swain, M.V. 2010. Direct Comparison Of The Bond Strength Results Of The Different Test Methods: A Critical Literature Review.
Dental Materials : Official Publication of The Academy Of Dental Materials 26(2), Pp. E78–93.
Shori, D., Pandey, S., Kubde, R., Rathod, Y., Atara, R. And Rathi, S. 2013. To Evaluate And Compare The Effect Of Different Post Surface Treatments On The Tensile Bond Strength Between Fiber Posts And Composite Resin.
Journal Of International Oral Health : Jioh 5(5), Pp. 27– 32.
Sirisha, K., Rambabu, T., Ravishankar, Y. And Ravikumar, P. 2014. Validity Of Bond Strength Tests: A Critical Review-Part Ii. Journal Of Conservative Dentistry : Jcd 17(5), Pp. 420–426.
Sirisha, K., Rambabu, T., Shankar, Y.R. And Ravikumar, P. 2014. Validity Of Bond Strength Tests: A Critical Review: Part I. Journal Of Conservative Dentistry : Jcd 17(4), Pp. 305–311.
Sofan, E., Sofan, A., Palaia, G., Tenore, G., Romeo, U. And Migliau, G. 2017. Classification Review Of Dental Adhesive Systems: From The Iv Generation To The Universal Type. Annalidistomatologia 8(1), Pp. 1–17. Teruel, J. De D., Alcolea, A., Hernández, A. And Ruiz, A.J.O.
2015. Comparison Of Chemical Composition Of Enamel And Dentine In Human, Bovine, Porcine And Ovine Teeth.
Archives of Oral Biology 60(5), Pp. 768–775.