IJPSR (2013), Vol. 4, Issue 11 (Research Article)
Received on 30 May, 2013; received in revised form, 01 July, 2013; accepted, 26 September, 2013; published 01 November, 2013
RP-HPLC METHOD DEVELOPMENT AND VALIDATION OF CAPECITABINE EXTENDED RELEASE TABLET DOSAGE FORM
A. Santosh Kumar Sreevatsav* and A.K. Harishbabu
MRR Institute of Pharmacy, Nadergul, Saroornagar, Andhra Pradesh, India
ABSTRACT: A Simple, Rapid, Precise, Accurate, Robust and Stability indicating Reverse Phase HPLC method has been developed to estimate Capecitabine in tablet dosage form using mobile phase mixture consisting of Phosphate buffer : Acetonitrile (80:20) v/v at the flow rate of 1.2ml/min. The Hypersil BDS C8 column (250mm x 4.6mm x 5mm) was used as the stationary phase. The mobile phase was run for 15 min at the wavelength of 240 nm. The mean recovery was found to be 99.91%. The linearity range was 50% to 150% and was found to be successful under 0.999. The proposed method has fulfilled all the validation parameters such as linearity, Robustness, Accuracy, System Precision, intermediate precision, method precision,
solution stability.
INTRODUCTION: Capecitabine 1 CAP (N4-Pentoxy carbonyl-5-deoxy-5-fluorocytidine) is an anti-cancer prodrug of 5 FluoroUracil (5-FU) that was designed to undergo preferential conversion to
5FU within tumors 2, 3, 6.
The activation of Capecitabine follows a pathway with three enzymatic steps and two intermediate metabolites, 5’ deoxy-5 fluorocytidine (5’-DFCR) and 5’-deox-fluorouridine (5’-DFUR) to form 5-fluoro Uracil.
Extensive pharmacokinetic studies have been performed on Capecitabine and its metabolites base
on phase II and III trials 4-9. A very few physic
chemical methods appeared in the literature survey
for Capecitabine in biological fluids and
pharmaceutical formulations.
QUICK RESPONSE CODE
DOI:
10.13040/IJPSR.0975-8232.4(11).4477-87
Article can be accessed online on: www.ijpsr.com
DOI link: http://dx.doi.org/10.13040/IJPSR.0975-8232.4(11).4477-87
Most of them are based upon HPLC, UV,
LC-MS, LC-MS/MS 8, 12 methods for its determination
in Human plasma and Pharmaceutical dosage
forms 10. The present work aims to develop simple,
selective, accurate, linear, robust, precise and stable method for the estimation of capecitabine in tablet dosage forms by Reverse phase HPLC using
UV detector 11.
Structure:
CAPECITABINE
MATERIALS AND METHODS:
Instruments / Equipments Required: High performance liquid chromatograph, with UV / PDA detector, HPLC Analytical column of BDS
Hypersil, C8, 250mm x 5mm x 5µ, Analytical
weighing balance - Mettler Toledo B204S, Millipore Nylon 0.2µm, Laboratory accessories.
Keywords:
Capecitabine tablets, RP-HPLC, Stability, Acetonitrile, Recovery
Correspondence to Author:
A. Santosh Kumar Sreevatsav
H. No. 8-4-369/260, Swaraj nagar, Borabanda, Hyderabad, Andhra Pradesh, India
Chemicals Required: Capecitabine working standard, Caplive (Capecitabine Tablets IP 500mg)
Tablets, Placebo or Excipient mixture (about 100g),
Potassium Dihydrogen Ortho Phosphate – AR, Acetonitrile – AR, Orthophosphoric Acid - AR
Analytical method: The quantitative determination is carried out by HPLC system equipped with UV/VIS detector.
Chromatographic conditions:
Column : Hypersil BDS C8, 250, 5mm
Buffer : Weigh accurately and transfer 27.22 g of Potassium dihydrogen orthophosphate to a 1000 ml
volumetric flask. Add about 980 ml of water, dissolve and dilute to volume with water.
Mobile Phase :
For isocratic system, prepare a mixture of buffer, and Acetonitrile in the proportion 80:20 respectively. Mix well; adjust the pH to 4.0 orthophosphoric acid. Filter through 0.2 µ Nylon
membrane filter paper and degas prior to use.
Wavelength : 240 nm
Flow Rate : 1.2 ml / minute
Injection volume : 20 μl
Run time : 15 minutes
Blank solution : Use Mobile phase as blank
Diluent : Use Mobile phase as diluent
a) Preparation of Capecitabine Standard Solution: Weigh accurately about 25 mg of Capecitabine working standard and transfer to a 25 ml volumetric flask. Add 10 ml of diluent and sonicate to dissolve. Dilute to volume with diluent and mix. Transfer 1.0 ml of solution into a 10 ml of volumetric flask and dilute to volume with the diluent and mix.
(Dilution scheme: 25mg 25.0 ml 1 ml /10.0
ml)
b) Preparation of Test Solution: Weigh and transfer 40mg of sample powder into a 25 ml volumetric flask. Add about 10 ml of diluent and shake for 20 minutes by mechanical means or manually and further sonicate for 30 minutes. Dilute up to mark with diluent. Centrifuge this solution at 8000 rpm for 10 minutes. Decant the supernatant solution into another test tube and transfer 1.0 ml of supernatant solution into another 10 ml volumetric flask and make up the volume with diluent. Further transfer 1.0ml of solution into another 10 ml volumetric flask and make up the volume with diluent. Filter the solution through 0.2µm nylon membrane filter.
(Dilution scheme: 40 25 ml 1 ml 10.0 ml)
System Suitability Solution: Use Capecitabine standard working solution as system suitability solution.
Procedure: Separately inject equal volumes of blank, five replicate injections of system suitability
solution (Capecitabine standard working solution).
Then inject two injections of test solution and record the chromatograms. Disregard any peak due to blank in the test solution. Calculate % RSD of five replicate injections of system suitability
solution (Capecitabine standard working solution).
Check tailing factor and theoretical plates of the
peak in the chromatogram obtained with 5th
injection of system suitability solution
(Capecitabinestandard working solution).
The limits are as below,
1) Theoretical plates should be not less than
3000.
2) Tailing factor should be less than 2.0.
3) % RSD should be not more than 2.0%.
Injection scheme:
Sr. No. Solutions to be injected No. of injections
01 Diluent Blank solution 1
02 System suitability solution (Capecitabine standard
working solution)
5
03 Test Solution 2
AT: Average Peak area of Capecitabine in test solution; AS: Mean peak area of Capecitabine in system suitability solution; WS: Weight of Capecitabine working standard taken in mg; WT: Weight of Tablet powder taken in mg; P: Assay of Capecitabine working standard in % on as is basis; L.C.: Label Claim; LOD: Loss on drying; Express the results up to two decimals.
RESULTS AND DISCUSSIONS: The system suitability parameters were monitored throughout the validation study and are recorded in the validation report.
The validation data is summarized below:
Specificity / Selectivity: Selectivity was performed by injecting the diluent blank solution, system suitability solution, test solution.
Acceptance criteria: The Capecitabine peak should be well resolved from any other peak and from each other.
The diluent blank solution, excipient blend solution should not show any peak at the retention time of the Capecitabine.
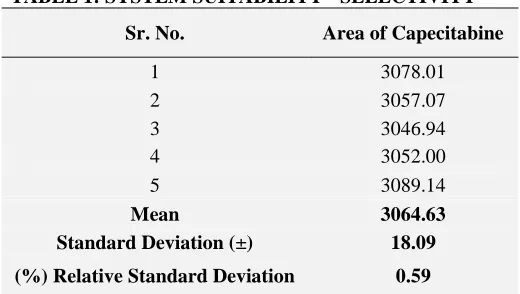
Results: The system suitability criteria were found to meet the pre-established acceptance criteria as
per the analytical method (table 1).
TABLE 1: SYSTEM SUITABILITY - SELECTIVITY
Sr. No. Area of Capecitabine
1 3078.01
2 3057.07
3 3046.94
4 3052.00
5 3089.14
Mean 3064.63
Standard Deviation (±) 18.09
(%) Relative Standard Deviation 0.59
All the injections were processed at the wavelength provided in the method. There was no interference
observed from diluent blank solution, excipient blend solution with Capecitabine peak.
Linearity:
Linearity and Range for standard: For the
linearity study five standard solutions of
Capecitabine were prepared from the range starting from 50% to 150% of the theoretical concentration of assay preparation.
The system suitability solution and the linearity solutions were injected as per the protocol. The linearity graph of concentration against peak response was plotted and the correlation coefficient was determined.
Acceptance criteria: Correlation coefficient should be greater than or equal to 0.999.
Results: The system suitability criteria were found to meet the pre-established acceptance criteria as
per the analytical method. (Refer to Table 2 for
system suitability results).
TABLE 2: SYSTEM SUITABILITY - LINEARITY OF STANDARD
Sr. No. Area of Capecitabine
1 3248.517
2 3257.89
3 3220.543
4 3200.623
5 3295.77
Mean 3244.66
Standard Deviation (±) 36.47
(%) Relative Standard Deviation 1.12
The average peak area of Capecitabine peak at each concentration level was determined and the linearity graph was plotted against the sample concentration in percentage. The results of linearity
[image:3.612.43.303.526.673.2]TABLE 3: RESULTS OF LINEARITY OF STANDARD
Linearity Level Concentration Sample
(in %)
Sample Concentration
(in ppm)
Average Area (n = 2)
Correlation Coefficient
Level – 1 50 50 1350.228
0.999
Level – 2 75 75 2011.678
Level – 3 100 100 2586.334
Level – 4 125 125 3257.89
Level – 5 150 150 3805.535
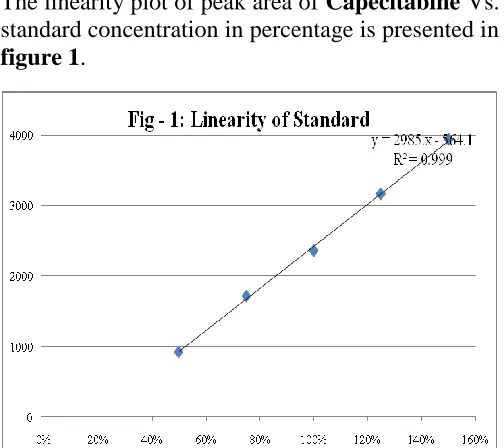
The linearity plot of peak area of Capecitabine Vs.
standard concentration in percentage is presented in
figure 1.
FIGURE 1: LINEARITY GRAPH OF CAPECITABINE STANDARD
Linearity and Range for standard in presence of placebo:
Procedure: For the linearity study five standard solutions of Capecitabine were prepared from the range starting from 50% to 150% of the theoretical concentration of assay preparation.
The system suitability solution and the linearity solutions were injected as per the protocol. The
linearity graph of concentration against peak response was plotted and the correlation coefficient was determined.
Acceptance criteria: Correlation coefficient should be greater than or equal to 0.999.
Results: The system suitability criteria were found to meet the pre-established acceptance criteria as
per the analytical method (Refer to Table 4 for
system suitability results).
TABLE 4: SYSTEM SUITABILITY - LINEARITY OF STANDARD IN PRESENCE OF PLACEBO
Sr. No. Area of Capecitabine
1 2940.783
2 2921.874
3 2997.412
4 2991.986
5 2925.39
Mean 2955.49
Standard Deviation (±) 36.5
(%) Relative Standard Deviation 1.2
The average peak area of Capecitabine peak at each concentration level was determined and the linearity graph was plotted against the sample concentration in percentage. The results of linearity
[image:4.612.48.300.147.371.2]study are as given in Table 5.
TABLE 5: RESULTS OF LINEARITY OF STANDARD IN PRESENCE OF PLACEBO
Linearity Level
Standard Concentration
(in %)
standard Concentration
(in ppm)
Placebo added to the standard solution
Average Area (n = 1)
Correlation Coefficient
Level – 1 50 50 15mg 1350.23
0.999
Level – 2 75 75 15mg 2011.68
Level – 3 100 100 15mg 2586.33
Level – 4 125 125 15mg 3257.89
Level – 5 150 150 15mg 3805.53
The linearity plot of peak area of Capecitabine Vs.
standard concentration in presence of placebo in
percentage is presented in figure 2.
Precision:
System Precision:
[image:4.612.311.568.312.456.2] [image:4.612.44.570.557.672.2]Acceptance criteria: % RSD of peak areas of ten replicate injections of system suitability solution should not be more than 2.0% and system suitability criteria should pass as per analytical method.
Results: The system suitability criteria were found to meet the pre-established acceptance criteria as per the analytical method. The system suitability criterion was found to meet the pre-established acceptance criteria as per the analytical method. The results of assay obtained from six test solutions
preparations are presented in Table 6.
[image:5.612.292.565.201.718.2]FIGURE 2: LINEARITY GRAPH OF CAPECITABINE STANDARD IN PLACEBO
TABLE 6: SYSTEM PRECISION
Sr. No. Area of Capecitabine
1 2921.87
2 2997.41
3 3028.38
4 2973.56
5 2905.42
6 3033.04
7 3048.50
8 2991.99
9 2925.39
10 3059.64
Mean 2988.52
Standard Deviation (±) 55.65
(%) Relative Standard
Deviation 1.86
Method Precision:
Procedure: Six test solutions of Capecitabine in Caplive Tablets were prepared as per the analytical method. The % RSD of % assay of six test solutions was calculated.
Acceptance criteria: % RSD of the results of six test solutions should not be more than 2.0%.
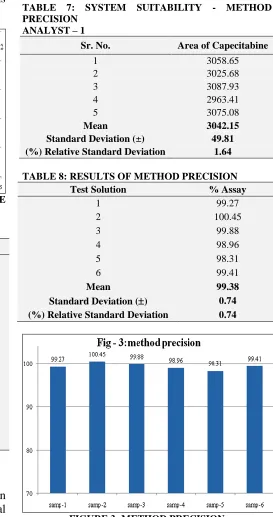
Results: The system suitability criterion was found to meet the pre-established acceptance criteria as per the analytical method. The results of assay obtained from six test solutions preparations are
presented in Table 8. The system suitability criteria
were found to meet the pre-established acceptance criteria as per the analytical method (Refer to
Table 7 for system suitability results).
TABLE 7: SYSTEM SUITABILITY - METHOD PRECISION
ANALYST – 1
Sr. No. Area of Capecitabine
1 3058.65
2 3025.68
3 3087.93
4 2963.41
5 3075.08
Mean 3042.15
Standard Deviation (±) 49.81
(%) Relative Standard Deviation 1.64
TABLE 8: RESULTS OF METHOD PRECISION
Test Solution % Assay
1 99.27
2 100.45
3 99.88
4 98.96
5 98.31
6 99.41
Mean 99.38
Standard Deviation () 0.74
(%) Relative Standard Deviation 0.74
[image:5.612.45.300.436.654.2]Intermediate Precision:
Procedure: Six test solutions of Caplive Tablets Extended Release Tablets and were prepared as per the analytical method on different day. These test solutions were analyzed by a different analyst using different HPLC column of same make but having different serial number and different HPLC system. The % RSD of % assay results of twelve test solutions (six samples from method precision and six samples from intermediate precision) was calculated.
Acceptance criteria: % RSD of the results of twelve test solutions (six of method precision and six of intermediate precision) should not be more than 2.0%.
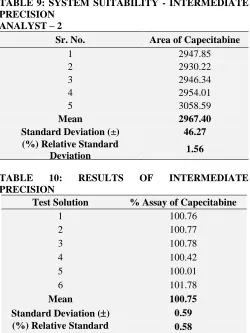
Results: The system suitability criteria were found to meet the pre-established acceptance criteria as
per the analytical method. (Refer to Table 9 for
system suitability results). The results of assay obtained from six test solutions are presented in
Table 10. % RSD of assay results from method precision and intermediate precision (12 results) are
presented in Table 11.
TABLE 9: SYSTEM SUITABILITY - INTERMEDIATE PRECISION
ANALYST – 2
Sr. No. Area of Capecitabine
1 2947.85
2 2930.22
3 2946.34
4 2954.01
5 3058.59
Mean 2967.40
Standard Deviation (±) 46.27
(%) Relative Standard
Deviation 1.56
TABLE 10: RESULTS OF INTERMEDIATE
PRECISION
Test Solution % Assay of Capecitabine
1 100.76
2 100.77
3 100.78
4 100.42
5 100.01
6 101.78
Mean 100.75
Standard Deviation () 0.59
(%) Relative Standard Deviation
[image:6.612.316.564.44.218.2]0.58
FIGURE 4: INTERMEDIATE PRECISION
TABLE 11: RESULTS OF TWELVE TEST
SOLUTIONS OF CAPECITABINE IN CAPLIVE TABLETS (six of method precision & six of intermediate precision)
Analysis performed during method precision study By Analyst 1 on system 1 and on column 1 on day 1
Same column % Assay of Capecitabine
1 99.27
2 100.45
3 99.88
4 98.96
5 98.31
6 99.41
Analysis performed during intermediate precision study By Analyst 2 on system 2 and on column 2 on day 2
Column sr. no. 015337030136 01
Test Solution % Assay of Capecitabine
7 100.76
8 100.77
9 100.78
10 100.42
11 100.01
12 101.78
Mean of twelve samples 100.07
Standard Deviation () 0.96
(%) Relative Standard
Deviation 0.96
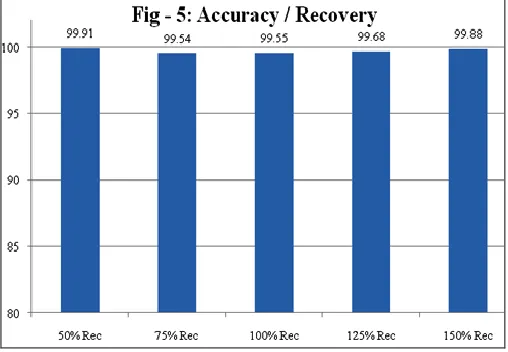
[image:6.612.312.566.301.728.2] [image:6.612.49.299.409.742.2]Accuracy (% Recovery):
Procedure: Accuracy study was performed by analyzing Capecitabine test solutions which were prepared by mixing Capecitabine API with excipient blend.
These test solutions were prepared by adding a quantity of Capecitabine API to excipient blend to produce three different concentration solutions equivalent to 50%, 75%, 100%, 125% and 150% of test concentration.
Acceptance criteria: Mean recovery at each concentration level should be between 97.0% and 102.0%.
Results: The system suitability criteria were found to meet the pre-established acceptance criteria as
per the analytical method (Refer to Table 12 for
system suitability result). The results of accuracy
study obtained are presented in Table 13.
TABLE 12: SYSTEM SUITABILITY - ACCURACY (%RECOVERY)
Sr. No. Area of Capecitabine
1 2940.78
2 2921.87
3 2997.41
4 2991.99
5 2925.39
Mean 2955.49
Standard Deviation (±) 36.54
(%) Relative Standard Deviation
[image:7.612.52.558.157.420.2]1.24 TABLE 13: ACCURACY (%RECOVERY) – RESULTS
Level of addition
Amount of Capecitabine added in mg
Amount of Capecitabine found in mg
Recovery (%)
First Level (Rec-50 %) 11.7 11.69 99.91
Second Level (Rec-75 ) 17.5 17.42 99.54
Third Level (Rec-100%) 22.5 22.40 99.55
Fourth Level (Rec-125%) 28.3 28.21 99.68
Fifth Level (Rec-150 %) 33.0 32.96 99.88
Mean 99.71
Standard Deviation (±) 0.18
(%) Relative Standard Deviation 0.18
Remarks: The percentage recovery for Capecitabine at each level lies between 97.0% and 102.0%. % RSD at each recovery level is less than 2.0%. The analytical method meets the pre-established acceptance criteria for recovery study as per protocol.
[image:7.612.48.302.553.729.2]Hence, it is concluded that the method is accurate.
FIGURE 5: ACCURACY/RECOVEERY
Acceptance criteria: System suitability criteria should pass as per analytical method and the % RSD between results obtained with changed condition and average result of method precision should not be more than 2.0%.
Robustness:
Experiment: Prepare two test solutions of the same lot (as used in 7.0.a and 7.0.b) of Capecitabine in Caplive (Capecitabine Tablets IP 500mg) as per analytical method. Inject this solution along with diluent blank solution and
system suitability solution along different
chromatographic conditions as shown below:
Change in column lot (same make, different serial no.)
Change in flow rate ( 0.2 ml/minute)
Change in wavelength (± 2 nm)
Change in Column Lot:
[Normal Experimental Condition: Hypersil BDS
C8, 250, 5mm). The system suitability criteria were
found to meet the pre-established acceptance
criteria as per the analytical method. (Refer to
Table 14 for system suitability results).
TABLE 14: SYSTEM SUITABILITY - ROBUSTNESS WITH CHANGE IN COLUMN LOT
Sr. No. Area of Capecitabine
Same column Diff column
1 2983.89 3315.75
2 2937.68 3294.98
Mean 2960.78 3305.36
Standard Deviation (±) 32.68 14.69
(%) Relative Standard Deviation 1.10 0.44
The assay results obtained with different flow rate
conditions are as given in Table 15.
TABLE 15: RESULTS FOR CHANGE IN COLUMN LOT
Flow rate Same column Diff column
Sample % Assay
Test solution 99.27 98.33
Average assay result from method precision 99.38 99.38
Mean 99.33 98.85
Standard Deviation () 0.08 0.74
(%) Relative Standard Deviation 0.08 0.75
Change in Flow Rate ( 0.2 mL/minute): (Normal Experimental Condition: 1.2ml/minute)
The system suitability criteria were found to meet the pre-established acceptance criteria as per the
analytical method. (Refer to Table 16 for system
suitability results).
TABLE 16: SYSTEM SUITABILITY - ROBUSTNESS WITH CHANGE IN FLOW RATE
Sr. No. Area of Capecitabine
1.0mL/minute 1.4 mL/minute
1 2454.13 3160.42
2 2415.73 3161.25
Mean 2434.93 3160.83
Standard Deviation (±) 27.1529 0.59
(%) Relative Standard Deviation 1.12 0.02
The assay results obtained with different flow rate
conditions are as given in Table 17.
Table 17: Results for change in flow rate
Flow rate 1.0mL/minute 1.4 mL/minute
Sample % Assay
Test solution 100.44 100.16
Average assay result from method precision 99.38 99.38
Mean 99.91 99.77
Standard Deviation () 0.75 0.55
(%) Relative Standard Deviation 0.75 0.55
Change in Wavelength (± 2 nm): (Normal Experimental Condition: 240nm)
The system suitability criteria were found to meet the pre-established acceptance criteria as per the
analytical method. (Refer to Table 18 for system
TABLE 18: SYSTEM SUITABILITY - ROBUSTNESS WITH CHANGE IN WAVELENGTH
Sr. No. Area of Capecitabine mestlate
238nm 242nm
1 2870.91 2862.74
2 2862.74 2886.30
Mean 2866.82 2874.52
Standard Deviation () 5.78 16.65
(%) Relative Standard Deviation 0.20 0.58
The assay results obtained with different
wavelength conditions are as given in Table 19.
TABLE 19: RESULTS FOR CHANGE IN WAVELENGTH
Wavelength 238nm 242 nm
Sample % Assay
Test solution 100.72 101.28
Average assay result from method precision 99.38 99.38
Mean 100.05 100.33
Standard Deviation () 0.95 1.34
(%) Relative Standard Deviation 0.95 1.34
Change in pH of Mobile Phase (± 0.2 units): (Normal Experimental Condition: pH = 4.0)
The system suitability criteria were found to meet the pre-established acceptance criteria as per the
analytical method (Refer to Table 20 for system
suitability results).
TABLE 20: SYSTEM SUITABILITY - ROBUSTNESS WITH CHANGE IN PH OF MOBILE PHASE
Sr. No. Area of Capecitabine
pH 3.8 pH 4.2
1 3069.88 3045.38
2 3023.47 3070.79
Mean 3046.67 3058.08
Standard Deviation () 32.81 17.96
(%) Relative Standard Deviation 1.07 0.58
The assay results obtained with change in pH of
mobile phase are as given in Table 21.
TABLE 21: RESULTS FOR CHANGE IN PH OF MOBILE PHASE
pH 3.8 4.2
Sample % Assay
Test solution 100.11 101.41
Average assay result from method precision 99.38 99.38
Mean 99.74 100.39
Standard Deviation () 0.51 1.43
(%) Relative Standard Deviation 0.51 1.42
Remarks: The analysis of the same lot of CAPLIVE TABLETS was carried out at different conditions of column lot, flow rate, wavelength, and pH of mobile phase. The system suitability was found to meet the pre-established criteria at all the conditions and the % RSD between results obtained with changed condition and average result of method precision is not more than 2.0%. The analytical method meets the pre-established acceptance criteria for robustness study as per protocol. Thus, the method is robust.
Stability of Analytical Solution:
The assay of CAPLIVE TABLETS in the sample was calculated.
Acceptance criteria: The analyte is considered stable if there is no significant change in % assay.
Results: The system suitability criteria were found to meet the pre-established acceptance criteria as
per the analytical method (Refer to Table 22 for
[image:10.612.47.564.123.322.2]system suitability results).
TABLE 22: SYSTEM SUITABILITY - SOLUTION STABILITY
TIME Std. Area Avg. std. area Spl. area Avg. Spl. area
0th hr 2460.18 2457.11 2533.31 2494.62
2454.03 2455.93
12th hr 2459.56 2458.30 2464.48 2464.20
2457.03 2463.91
24 hr 2377.50 2494.36 2534.88 2537.90
2611.22 2540.91
36 hr 2532.96 2481.07 2453.10 2453.39
2429.19 2453.69
48 hr 2440.41 2452.03 2462.17 2448.79
2464.65 2535.20
Mean 2468.57 2468.57 2489.75 2479.78
Standard Deviation () 62.93 18.24 38.04 37.07
(%) Relative Standard Deviation 2.54 0.73 1.53 1.49
TABLE 23: RESULTS FOR SOLUTION STABILITY
% Assay results calculated against the freshly prepared system suitability standard
Sample % Assay of Capecitabine
0th hr 98.26
12th hr 96.78
24 hr 98.43
36 hr 95.60
48 hr 96.21
Mean 97.05
Standard Deviation () 1.24
(%) Relative Standard Deviation 1.28
Remark: The system suitability was found to meet the pre-established criteria and the % RSD between assay results obtained for freshly prepared test solution and the stored test solutions is less than
2.0%. There is no significant change in assay level observed up to 48Hrs for test solution at room temperature. Thus, it can be concluded that the solution is stable upto 48Hrs at room temperature.
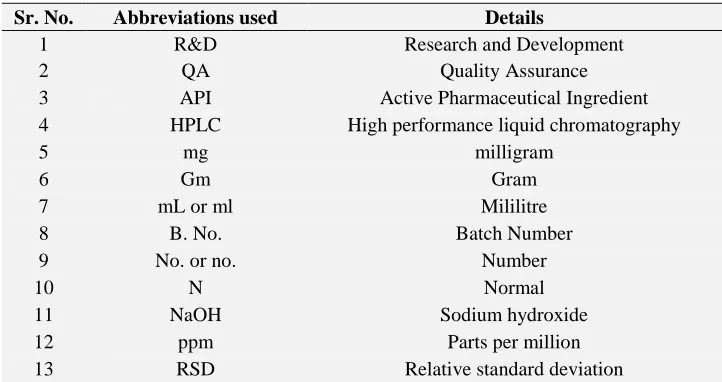
LIST OF ABBREVIATIONS:
Sr. No. Abbreviations used Details
1 R&D Research and Development
2 QA Quality Assurance
3 API Active Pharmaceutical Ingredient
4 HPLC High performance liquid chromatography
5 mg milligram
6 Gm Gram
7 mL or ml Mililitre
8 B. No. Batch Number
9 No. or no. Number
10 N Normal
11 NaOH Sodium hydroxide
12 ppm Parts per million
[image:10.612.125.486.555.746.2]14 rpm Rotations per minute
15 nm Nanometer
16 °C Degree centigrade
17 µl Microlitre
18 % Percentage
19 & and
20 Sr. No. Serial Number
21 µm Micrometer
22 R.T. Room Temperature
CONCLUSION: The above performed method development and validation of Capecitabine HCl tablet dosage form is rapid, precise, accurate and inexpensive and stability indicating method. It has
got all he values under the limits set by ICH.
REFERENCES:
1. http://www.drugbank.com
2. Fathima Anjum, Tangadpally Radhika, Kondepudi Rajani Kumari, Makula Ajitha, Analytical method development and validation of capecitabine in Bulk by RP-HPLC method, International Research Journal of Pharmacy, 2012; 177-180.
3. F. Desmoulin, V. Gilard, M. Malet-Martino, R. Martino, Drug Metab. Dispos 2002; 30: 1221.
4. Indian Pharmacopoeia, Vol. 2 2010; 972-3.
5. Lange. Basic and Clinical Pharmacology, 11th edition; 947. 6. I.R. Judson, P.J. Beale, J.M. Trigo, W. Atherne, T. Crompton, D. Jones, E. Bush, B. Reigner, Ivnest. New Drugs. 1999; 17, 49.
7. Rd bv Gieschke, H.O. Burger, B. Reigner, K.S. Blesch, J.L. Steiner, Br.J.Clin. Pharmacol. 2003; 55: 252.
8. S. Jayaseelan, SK. Bajivali, U. Ramesh, V. Sekar, P.Perumal, Bioanalytical method Development and validation of Capecitabine by RP-HPLC method, International journal of ChemTech Research, 2010; Vol. 2: 2086-2090.
9. P.M. Hoff, R. Ansari, G. Batist, J. Cox, W. Kocha, M. Kuperminc, J. Maroun, D. Walde, C. Weaver, E. Harrison, H.O. Burger, J. Clin.Oncol. 2001; 19: 2282. 10. Narendra Devanaboyina, Y.Saikishore, P. Pushpalatha, N.
Mamatha, P. Venkatesh. Development and validation of new RP HPLC method for analysis of Capecitabine in pharmaceutial dosage form, 2013; 21-30.
11. Rajitha Kandimalla, D. Nagavalli, Validated estimation of Capecitabine by UV-Spectroscopic, RP- HPLC and HPTLC method, IRJP 2012; 163-166.
12. Pani kumar AD, Venkata Raju Y, Sunitha G, Ramakrishna K, Ceema M and Venkateshwara Rao A, Development of validated stability indicating RP-HPLC method for the estimation of Capecitabine in pure and pharmaceutical formulations, International Journal of Research in Pharmaceutical and Biomedical Sciences 2011; 2(1): 175-181.
All © 2013 are reserved by International Journal of Pharmaceutical Sciences and Research. This Journal licensed under a Creative Commons Attribution-NonCommercial-ShareAlike 3.0 Unported License.
This article can be downloaded to ANDROID OS based mobile. Scan QR Code using Code/Bar Scanner from your mobile. (Scanners are available on Google Playstore)
How to cite this article: