CONTEXT EFFECTS IN SOCIAL SURVEYS:
A Study of Question Order Effects
Gudbjorg Andrea Jonsdottir
Thesis submitted for the degree of Doctor of Philosophy
Department of Social Psychology
London School of Economics and Political Science
University of London
UMI Number: U198551
All rights reserved
INFORMATION TO ALL USERS
The quality of this reproduction is dependent upon the quality of the copy submitted.
In the unlikely event that the author did not send a complete manuscript and there are missing pages, these will be noted. Also, if material had to be removed,
a note will indicate the deletion.
Dissertation Publishing
UMI U198551
Published by ProQuest LLC 2014. Copyright in the Dissertation held by the Author. Microform Edition © ProQuest LLC.
All rights reserved. This work is protected against unauthorized copying under Title 17, United States Code.
ProQuest LLC
789 East Eisenhower Parkway P.O. Box 1346
T H e S Q
c
F
jn tis n u ttw y o t Political 3nd Economic Science
Abstract
Contents
Abstract
...
3
Contents
...
4
List o f tables
... 7
List o f figures
...
15
Acknowledgements
...
16
Introduction
...
18
Theoretical background...18
Overview of the contents... 20
1 Context effects and attitude research
...
25
1.1 Origins of the sample survey... 25
1.2 Context effects... 31
1.3 Errors in attitude measurement... 46
1.4 The social nature of context effects... 71
1.5 Summary... 77
2 Pilot study.
...
79
2.1 Introduction... 79
2.2 Design... 80
2.3 Sample and response rate... 81
2.4 Method... 83
2.5 Results and discussion... 83
Experiment 1 - The effect of knowledge questions on reported interest in politics... 83
Experiment 2 - The most important issues and prompting... 89
Experiment 3 - Sequence effects, the most important issues...93
2.6 Conclusion... 94
3 Methodology
...
96
3.1 Introduction... 96
3.2 Design... 96
Experiment 1 - The effect of knowledge questions on responses to a question about political interest... 98
Experiment 2 - The most important national issues... 102
Experiment 3 - Context effects on attitudes towards abortion and declaring the Nordic countries free of nuclear weapons... 105
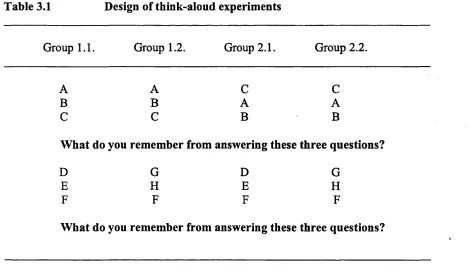
Think-aloud experiments...109
3.4 Method of analysis...113
4 The effect o f knowledge questions on political interest
...
116
4.1 Introduction...116
4.2 Effect of question order on responses to a general question concerning interest in politics...117
4.3 Logit analysis of political interest in Wave 1...121
4.4 Logit analysis of effect of knowledge questions on political interest in Wave 1... 129
4.5 The effect of the two knowledge questions...136
4.6 Logit analysis of the effects of the two knowledge questions... 140
4.7 Effect of question order in Wave 1 on political interest in Wave 2 ...147
4.8 Changes in political interest between waves...154
4.9 The effect of knowledge on changes between waves... 159
4.10 News consumption and the effect of question order on political interest...164
4.11 Think-aloud and political interest...166
4.12 Conclusion... 170
5
The most important issues.
...
174
5.1 Introduction...174
5.2 Effect of prompting...176
5.3 Effect of prompting and demographic variables... 180
5.4 Prompting and non-response...186
5.5 Effect of specific and general examples...195
5.6 The most important issues and changes between waves... 197
5.7 Conclusion...201
6 Context effects on attitudes towards abortion and declaring the
Nordic countries free o f nuclear weapons
...
203
6.1 Introduction...203
6.2 Context effect on attitude towards abortion... 204
6.3 Logit analysis of attitudes towards abortion, context and strength of attitude... 217
6.4 Logit analysis of the effects of context, and background variables, on attitudes towards abortion... 223
6.5 Think-aloud and attitudes towards abortion... 231
6.6 Summary of effects of context on attitudes towards abortion...233
6.8 Logit analysis of the effects of context and strength of attitude on changes in attitudes towards declaring the Nordic countries free of
nuclear weapons... 242
6.9 Logit analysis of change in attitudes towards declaring the Nordic countries free of nuclear weapons and the effects of context, strength of attitude, and agreement with the context items...245
6.10 Logit analysis of change in attitudes towards declaring the Nordic countries free of nuclear weapons and the effects of context and background variables... 248
6.11 Logit analysis of changes in attitudes towards declaring the Nordic countries free of nuclear weapons, and the effects of context, strength of attitude, and sex... 251
6.11 Summary of effects of context on attitudes towards declaring the Nordic countries free of nuclear weapons... 256
6.12 Conclusion...257
7 Conclusion and discussion
...
258
7.1 Overview...258
7.2 Summary of results in experiment on knowledge questions and political interest...265
7.3 Summary of experiments on the most important problems facing the nation...268
7.4 Summary of experiments on effects of context on attitudes toward abortion and declaring the Nordic countries free of nuclear weapons...270
7.5 Conclusion and discussion... 273
7.6 Implications for survey results... 278
7.7 Limitations of the present study and further research... 279
References
...
283
Appendix 1 Questionnaire in Wave 1
...
305
Appendix 2 Questionnaire in Wave 2
...
316
List of tables
Table 1.1 Classification of context and order effects... 35 Table 1.2 Context effects and cognitive stages in the
question-answering process... 43 Table 1.3 Axioms of Zaller’s Recieve-Accept-Sample model...58 Table 2.1 Number of subjects in each condition, and response
rate... 82 Table 2.2 Response rate and gender... 82 Table 2.3 The effect of political knowledge questions on reports
of interest in government and public affairs...84 Table 2.4 Answers to knowledge questions about number of
MPs in constituency and name of Minister of sSport...85 Table 2.5 Relation between political interest and political
knowledge where interest question preceded
knowledge questions... 86 Table 2.6 Relation between political interest and political
knowledge where interest question followed
knowledge questions... 86 Table 2.7 Relation between political interest and news
consumption- All respondents... 87 Table 2.8 Relation between political interest and news
consumption - Interest question preceded knowledge
questions...88 Table 2.9 Relation between political interest and news
consumption - Knowledge questions preceded
interest question... 88 Table 2.10 The most important issues by experimental condition...90 Table 2.11 The three most important issues by experimental
condition...91 Table 2.12 The most important issues... 92 Table 2.13 The most important issues, experimental condition,
and education... 92 Table 2.14 The most important issues and the position of the
question...93 T able 3.1 Design of think-aloud experiments...I l l Table 4.2.1. Political interest by order of questions...117 Table 4.2.2 Effect of question order on political interest by sex... 119 Table 4.2.3 Effect of question order on political interest by a g e ... 119 Table 4.2.4 Effect of question order on political interest by
education... 121 Table 4.3.1 Models for political interest with order, sex, age and
education as explanatory variables... 122 Table 4.3.2 Test for main effects of sex, education, age, and
question order on political interest... 123 Table 4.3.3 Test for two-way interactions between order, age,
Table 4.3.4 Observed, (expected) frequencies and standardized residuals for the model with main effects of background variables and order and interactions
between order and education; and age and se x ...125 Table 4.3.5 Parameter estimates for the best model, odds, and
proportion saying they follow what is going on in government and public affairs, ‘some of the time or
less’... 126 Table 4.3.6 Expected log-odds, odds, and proportion of
respondents saying they follow what is going on in government and public affairs ‘some of the time or less’ for every combination of the explanatory
variables... 128 Table 4.4.1 Education and answers to the knowledge questions...130 Table 4.4.2 Models for political interest with knowledge, order,
and, education as explanatory variables... 131 Table 4.4.3 Test for two-way interactions between knowledge,
order of questions, and education... 131 Table 4.4.4 Test for main effects of knowledge, order, and
education on political interest... 132 Table 4.4.5 X- Parameters, log-odds, odds, predicted, and actual
proportion of respondents saying they follow what is going on in government and public affairs ‘some of the time or less’, based on a model with main effects of knowledge, order, and education on political
interest... 133 Table 4.4.6 Observed, (expected) frequencies, and standardized
residuals for the model with main effects of order,
knowledge and education on political interest...134 Table 4.4.7 Log-odds, odds, predicted proportion, and observed
proportion saying they follow what is going on in government and public affairs, ‘some of the time’ or less, for the model with main effects of order,
knowledge, and education on political interest...135 Table 4.5.1 Responses to the knowledge questions... 136 Table 4.5.2 Political interest by order of questions, controlling for
responses to the question: ‘Do you happen to know who is the Speaker of the plenary session of both
houses of Parliament?’ ... 137 Table 4.5.3 Political interest by order of questions, controlling for
responses to the question: ‘Do you happen to know which minister is responsible for the administration
of the Statistical Bureau?’ ... 139 Table 4.5.4 Effect of knowledge questions on the probability of
respondents’ saying they follow what is going on
‘most of the time’ ... 140 Table 4.6.1 Mean age of respondents and answers to knowledge
Table 4.6.3 Models for political interest with order, knowledge
questions, education and age as explanatory variables...143 Table 4.6.4 Odds, and predicted proportion of respondents saying
‘some of the time or less’, based on a saturated model...144 Table 4.7.1 Political interest (Wave 2) by order of questions
(Wave 1)...148 Table 4.7.2 Chi-square statistics for pairwise comparisons of
political interest in Wave 2...149 Table 4.7.3 Political interest in Wave 2, by political interest in
Wave 1, controlling for experimental condition... 149 Table 4.7.4 Comparison of marginals for political interest in
Waves 1 and 2 ...151 Table 4.7.5 Mean response to political interest question in Wave
1 and Wave 2 by order... 153 Table 4.8.1 Changes in political interest between waves by order
of questions (in Wave 1 )... 155 Table 4.8.2 Models for change in political interest with order,
sex, and education as explanatory variables...155 Table 4.8.3 Test for main effects of sex, education, and order on
change in political interest...156 Table 4.8.4 Test for two-way interactions between order, sex, and
education...156 Table 4.8.5 Test for conditioning effects of age on order, sex, and
education...157 Table 4.8.6 Parameter estimates for the best model, odds, and
proportion 1) changing the response, or 2) if
changing, changing in a negative direction... 158 Table 4.8.7 Observed, (expected) frequencies and standardized
residuals for the model with main effects of order on
change in political interest...159 Table 4.9.1 Models for change in political interest with order,
knowledge, sex, and education as explanatory
variables...160 Table 4.9.2 Test for main effects of sex, education, knowledge,
and order on change in political interest... 160 Table 4.9.3 Test for conditioning effects of age on order,
knowledge, sex, and education... 160 Table 4.9.4 Test for two-way interactions between order,
knowledge, sex, and education... 161 Table 4.9.5 Parameter estimates for the best model, odds, and
proportion 1) changing the response, or 2) if
changing, changing in a negative direction... 162 Table 4.9.6 Observed, (expected) frequencies and standardized
residuals for the model with main effects of order, and an interacting effect of knowledge and sex on
change in political interest...164 Table 4.10.1 Political interest (Wave 1) by order of questions,
controlling for news consumption... 166 Table 4.11.1 Political knowledge and interest in think-aloud
Table 5.2.1 The most important issues and experimental
condition in Wave 1 ...177 Table 5.2.2 The most important issues in Wave 2 and the
experimental condition in Wave 1...178 Table 5.2.3 The most important issues in Wave 3 ... 179 Table 5.2.4 The most important issues in Waves 1, 2, and 3
(multiple response)...180 Table 5.3.1 The most important issues in Wave 1 and education
of respondents...181 Table 5.3.2 Mean number of issues mentioned in each condition
in the first wave by education...182 Table 5.3.3 Reliability or stability of answers in Wave 1 and
Wave 2 and education (i.e., % of respondents giving
the same response in Wave 1 and Wave 2 )... 183 Table 5.3.4 The most important issues in Wave 1 and sex of
respondents...184 Table 5.3.5 The most important issues in Wave 1 and education
of respondents... ..185 Table 5.3.6 The most important issues in Wave 1 and news
consumption of respondents...186 Table 5.4.1 Non-response and prompting in Wave 1... 187 Table 5.4.2 Models for non-response with prompting, sex,
education and age as explanatory variables... 188 Table 5.4.3 Test for main effects of prompting, sex, education
and age, on non-response...188 Table 5.4.4 Significance test for two-way interactions between
prompting, sex, education and age...189 Table 5.4.5 Significance test for two-way interactions between
prompting, sex, education and age...189 Table 5.4.6 X- Parameters, log-odds, odds, predicted, and actual
proportion of respondents who mention no issue... 190 Table 5.4.7 Effects of prompting and political interest on non
response to question about the most important issues... 192 Table 5.4.8 Effects of prompting, political interest, and sex on
non-response to question about the most important
issues... 194 Table 5.5.1 Percent of respondents who say the prompts given in
Wave 1 are the most important issues of national
importance... 196 Table 5.6.1 Stability of responses to the question about what are
the most important issues in Waves 1, 2, and 3, and
experimental condition in Wave 1...198 Table 5.6.2 Percent of respondents who give the same answer in
Waves 1 and 2 and effects of prompting, age and
education...199 Table 5.6.3 Percent of respondents who give the same answer in
Waves 1 and 2 and effects of prompting, sex and
Table 5.6.4 Percent of respondents who give the same answer in Waves 1, 2 and 3 and effects of prompting, age and
education... 200
Table 6.2.1 Abortion by context...204
Table 6.2.2 Abortion (dichotomous) by context...205
Table 6.2.3 Abortion (base rate question) by context...205
Table 6.2.4 Abortion by context, controlling for responses to the base rate question...206
Table 6.2.5 Abortion (dichotomous) by context, controlling for responses to the base rate question... 207
Table 6.2.6 Abortion (dichotomous) by context, controlling for sex... 209
Table 6.2.7a Abortion (dichotomous) by context, controlling for base-rate attitude towards abortion. Male respondents only... 210
Table 6.2.7b Abortion (dichotomous) by context, controlling for base-rate attitude towards abortion. Female respondents only... 211
Table 6.2.8 Attitude towards abortion by strength...212
Table 6.2.9 Abortion (dichotomous) by context, controlling for ag e... 214
Table 6.2.10 Abortion (dichotomous, base-rate question) by age... 215
Table 6.2.11 Abortion (dichotomous) by context, controlling for education... 217
Table 6.3.1 Goodness-of-fit statistics for attitude towards abortion - with abortion (base-rate measure), context, and strength of attitude as explanatory variables...218
Table 6.3.2 Significance test for main effects of abortion (base-rate measure), context, and strength of attitude on attitude towards abortion... 219
Table 6.3.3 Significance test for two-way interactions between abortion (base-rate measure), context, and strength of attitude... 219
Table 6.3.4 Changes in attitude towards abortion between studies, broken down by context and strength of attitude...220
Table 6.3.5 ^-parameters, log-odds, odds, predicted, and actual proportion of respondents saying they favour abortion on demand, based on the saturated model for the variables: attitude towards abortion (target), base-rate attitude, context, and strength of attitude...222
Table 6.4.1 Goodness-of-fit statistics for attitude towards abortion - with abortion (base-rate measure), context, sex and education as explanatory variables...224
Table 6.4.2 Significance test for main effects of abortion (base-rate measure), context, sex, and education on attitude towards abortion... 224
Table 6.4.4 Significance test for three-way interactions between abortion (base-rate measure), context, sex, and
education... 225 Table 6.4.5 ^-parameters, log-odds, odds, predicted, and actual
proportion of respondents saying they favour abortion on demand, based on a model with a main effect of base rate attitude, and a three-way interaction
between context, sex, and education... 226 Table 6.4.6 Observed, (expected) frequencies and standardized
residuals for the model with main effects of the base- rate attitude, context, sex, and education, and two- and three-way interactions between context, sex, and
education... 227 Table 6.4.7 Significance tests for the conditioning effects of age
on base-rate attitude, context, sex, and education...228 Table 6.4.8 Average agreement to context items on women’s
rights (pro) and traditional values (anti)... 229 Table 6.4.9 Effect of context and agreement to context items on
attitude towards abortion... 230 Table 6.4.10 Effect of context, agreement to context items and sex
on attitude towards abortion... 230 Table 6.5.1 Agreement with context items and attitudes towards
abortion in think-aloud interviews... 232 Table 6.7.1 ‘Nuclear-free North’ by context... 234 Table 6.7.2 ‘Nuclear-free North’ by context... 235 Table 6.7.3 ‘Nuclear-free North’ by context, controlling for
responses to the base rate question... 235 Table 6.7.4 ‘Nuclear-free North’ (dichotomous) by context,
controlling for responses to the base rate question...236 Table 6.7.5 Change in attitude towards ‘nuclear-free North’ by
context... 237 Table 6.7.6 Change in attitude towards ‘nuclear-free North’ by
strength of attitude... 238 Table 6.7.7 Change in attitude towards ‘nuclear-free North’ by
context, controlling for strength of attitude... 239 Table 6.7.8 Change in attitude towards ‘nuclear-free North’ by
context, controlling for sex... 240 Table 6.7.9 Change in attitude towards ‘nuclear-free North’ by
context, controlling for a g e ... 241 Table 6.7.10 Change in attitude towards ‘nuclear-free North’ by
context, controlling for education... 242 Table 6.8.1 Goodness-of-fit statistics for change in attitudes
towards declaring the Nordic countries free of nuclear weapons with context, and strength o f attitude as
explanatory variables... 243 Table 6.8.2 Significance test for main effects of context, and
strength of attitude on changes in attitude towards declaring the Nordic countries free of nuclear
Table 6.8.3 Table 6.8.4 Table 6.9.1 Table 6.9.2 Table 6.9.3 Table 6.9.4 Table 6.9.5 Table 6.10.1 Table 6.10.2 Table 6.10.3 Table 6.10.4 Table 6.11.1
^-parameters, log-odds, odds, predicted, and actual proportion of respondents 1) changing their response, and 2) who changed their response, change towards oppose, and the effects of context and strength of
attitude... 244 Observed, (expected) frequencies and standardized
residuals for the model with main effects of context and strength of attitude on changes in attitude
towards declaring the Nordic countries free of nuclear
weapons... 245 Goodness-of-fit statistics for change in attitudes
towards declaring the Nordic countries free of nuclear weapons with context, strength of attitude, and
agreement with the context items, as explanatory
variables... 246 Significance test for main effects of context, strength
of attitude, and agreement on changes in attitude towards declaring the Nordic countries free of nuclear
weapons... 246 Significance tests for two-way interactions between
context, strength of attitude, and agreement...247 ^-parameters, log-odds, odds, predicted, and actual
proportion of respondents 1) changing their response, and 2) who change their response, change towards oppose, and the effects of context and strength of
attitude... 247 Observed, (expected) frequencies and standardized
residuals for the model with main effects of context and strength of attitude on changes in attitude
towards declaring the Nordic countries free of nuclear
weapons... 248 Goodness-of-fit statistics for change in attitudes
towards declaring the Nordic countries free of nuclear weapons with context, sex, education and age as
explanatory variables... 248 Significance test for main effects of context, sex
education, and age on changes in attitude towards declaring the Nordic countries free of nuclear
weapons... 249 Significance tests for two-way interactions between
context, sex, education, and age... 250 Observed, (expected) frequencies and standardized
residuals for the independence model for changes in attitude towards declaring the Nordic countries free
of nuclear weapons... 250 Goodness-of-fit statistics for change in attitudes
towards declaring the Nordic countries free of nuclear weapons with context, strength of attitude, and sex as
Table 6.11.2 Significance test for main effects of context, strength of attitude, and sex on changes in attitude towards declaring the Nordic countries free of nuclear
weapons... 252 Table 6.11.3 Significance tests for two-way interactions between
context, sex, and strength of attitude...252 Table 6.11.4 ^-parameters, log-odds, odds, predicted, and actual
proportion of respondents 1) changing their response, and 2) who changed their response, change towards oppose, and the effects of context, sex, and strength
List of figures
Figure 1.1 Respondents’ task in a survey situation...40 Figure 1.2. Inclusion/exclusion and the emergence of
assimilation and contrast effects... 45 Figure 1.3 Latitudes of acceptance, non-commitment and
rejection: Target-communicator discrepancy and
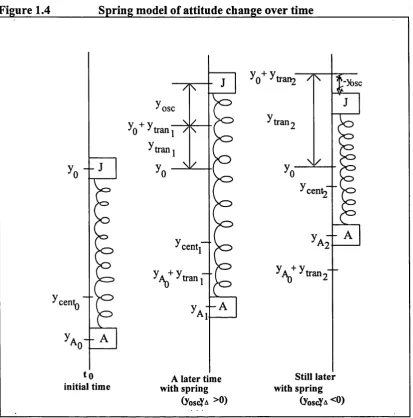
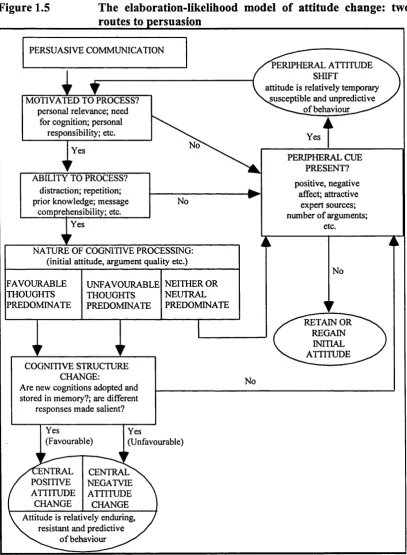
attitude change... 52 Figure 1.4 Spring model of attitude change over tim e... 56 Figure 1.5 The elaboration-likelihood model of attitude change:
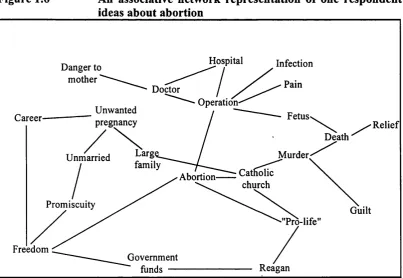
two routes to persuasion... 61 Figure 1.6 An associative network representation of one
respondent’s ideas about abortion... 65 Figure 2.1 Structure of pilot study...81 Figure 3.1 Design of experiment on effect of knowledge
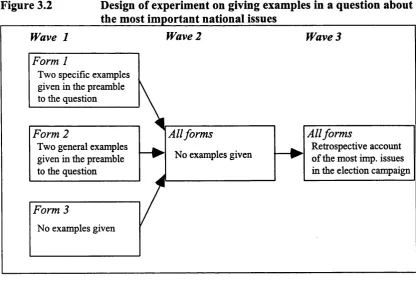
questions on reported political interest... 100 Figure 3.2 Design of experiment on giving examples in a
question about the most important national issues...104 Figure 3.3 Design of experiment on context effects on attitudes
towards abortion and attitudes towards declaring the
Nordic countries free of nuclear weapons... 108 Figure 4.6.1 Relation between size of context effect, political
knowledge and education for the age group 18-30...145 Figure 4.6.2 Relation between size of context effect, political
knowledge and education for the age group 31-50...146 Figure 4.6.3 Relation between size of context effect, political
Acknowledgements
The writing of this thesis has been a long and sometimes difficult process. On many different occasions I thought I would never be able to find the time to finish what I had started. Many people have helped me realize my dream and deserve being mentioned and thanked for their support and the help they have provided me throughout the years. First of all, I would like to thank Gudmundur Runar Amason, a fellow PhD student at LSE, who conducted the research with me and used the same data in his thesis about the parliamentary election campaign in 1987. I would also like to offer my gratitude to the 148 people who participated in the pilot study and the 1042 people who took part in the main survey and agreed to being interviewed on three different occasions, as well as the 17 students whom I interviewed face to face.
Important financial support was contributed by the Icelandic Research Council without which this research would never have seen the light of day. Special thanks are also due to the Social Science Research Institute at the University of Iceland for providing me and my colleague with the facilities to conduct the research, and for their continuing support during my various part-time leaves after I started working for them in 1991. I am also very thankful to my present boss, Dr. Gerdur G. Oskarsdottir, Superintendent of Schools in Reykjavik, for her support through the final stages, and to Dr. Terry G. Lacy for her help in editing.
A project of this size and duration inevitably becomes something of a trial to one’s family and I would like to thank my husband and my three children for their endless encouragement and patience. My mother and my mother-in-law also deserve to be thanked for their assistance in looking after the children while I have been away.
Finally, I wish to express special thanks to my supervisors, George Gaskell and Colm O’Muircheartaigh, who have shown me much more support and patience than I deserve.
Introduction
Theoretical background
Rosenthal, 1966). Is the ‘noise’ caused by some such variables operating in the survey interview? Is it possible that we have neglected the simple fact that not only do researchers think, but so do their respondents? Or has the observed unreliablilty something to do with the nature of attitudes? These questions, along with more practical considerations guided the research described in this thesis. Despite the fact that English-speaking nations have been using sample surveys to gather data about the general public’s opinions since the middle of the twentieth century, the method did not gain popularity in Iceland until the mid-1980s and very few people had specialized in survey methodolgy. Hence, this research provided the opportunity to combine the best of both worlds, i.e., to satiate my curiosity and to give me practical experience for future research in social surveys.
Suggestions that asking people questions in a survey interview, can lead to a change both in people’s attitudes and behaviours guided the design of the research although no attempt was made to observe people’s behaviours (cf. Bishop, 1987). My choice of questions was influenced not only by the context effects literature but also by a colleagues disciplinary interest in politics. Hence, I selected questions that had some bearing on attitudes towards politics or political behaviour. Bearing in mind the idea of reactivity, i.e., that simply asking questions may lead to a change in people’s attitudes an attempt was made to examine how long lasting context effects are by interviewing the same sample on three different occasions. Are context effects temporary or will the context in the first interview possibly influence responses in interviews taken a month later?
The questions that shaped the orientations and conduct of this project reflected the above concerns. My main foci in this respect were:
• Do preceding questions affect responses to subsequent questions in a questionnaire in a systematic fashion?
• Do we change people’s attitudes and self-perceptions by asking them questions?
• If asking questions has the effect of changing people’s attitudes, how long- lasting are these changes?
• Are context effects artifactual or can they be explained with reference to the social nature of the interview situation?
• Can theories about the nature of attitudes explain some of the instability frequently observed in attitudinal responses?
Overview o f the contents
were published after I designed my research and collected my data. A tentative categorization of attitudes on criteria of stability/instability is presented in chapter 1. This categoriztion did not inform the design of the study but may provide a basis for interpreting the results and be informative for further research. It is argued that responses to questions about attitudes that are inherently unstable or attitudes in which little emotion is invested are likely to be susceptible to the context within which they are asked. Furthermore, when the wording of questions is vague or unclear, respondents are likley to use adjacent questions to aid in the interpretation. Thus, it is important for questionnaire designers to ask clear and specific questions. The clearer the question, the less likely it is that respondents need to guess what the questioner means and the less likely they are to use previous questions to clarify the meaning.
Chapter 2 describes a pilot study that was designed to test various questions’ susceptibility to context and order effects before a final decision was made about which questions to choose for the main study. Three experiments were counducted to test: 1) the effect of political knowledge questions on responses to a question on interest in government and public affairs; 2) the effect of giving examples (prompting) in the preamble to a question asking which issues of national importance respondents are most concerned about, and; 3) sequence effects, i.e., the positioning of the question about the most important issues was varied. The pilot experiment on sequence effects did not provide any convincing results, and being of another nature than the other two experiments (not related to the content of the previous questions or the target question itself) it was omitted from the main study.
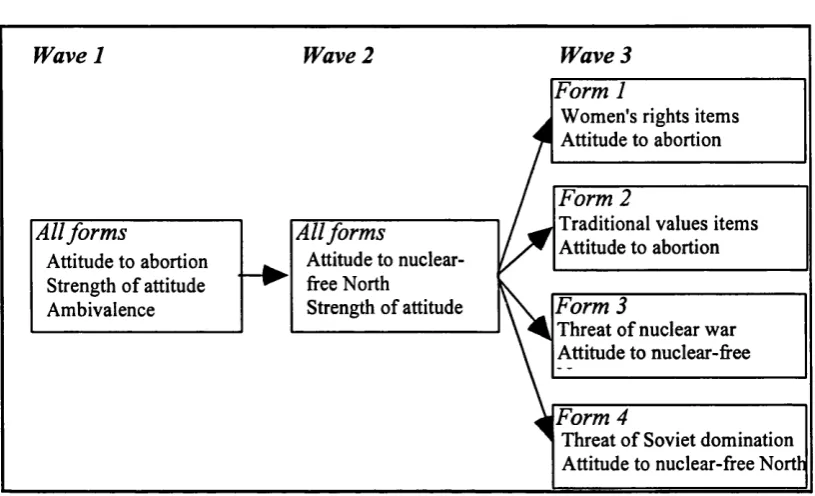
political knowledge questions on interest; 2) the effect of prompting when asking about the most important issues facing the nation; and finally, not tested in the pilot study; 3) the effect of asking respondents if they agreed or disagreed with pro- or anti-attitudinal assertions before asking about their attitude towards abortion and separately declaring the Nordic countries free of nuclear weapons. Think-aloud interviews (cf. Ericsson and Simon, 1980) were conducted in an attempt to identify the cognitive steps involved in answering survey questions and to gain insight into respondents’ train of thought. Each of the three experiments is discussed in detail in the following chapters.
Chapter 4 discusses the results of the experiment on the effect of asking political knowledge questions immediately before asking about how often people follow what goes on in government and public affairs. It is concluded that that researcher interventions do not change people’s self-perceptions of how frequently they think they follow what is going on in government and public affairs, but rather that such interventions provide the definition of what is meant by following government and public affairs ‘most of the time’. That is, asking respondents about their ‘political knowledge’ in the same questionnaire as the question about how well they follow what is going on in government and public affairs implies that a person who follows what is going on ‘most of the time’ knows the answers to these and similar questions.
difference between the two groups that were prompted was that the respondents prompted with the specific examples were much more likely to proclaim issues other than the examples given as the most important ones. This result, along with no differences found between the group prompted with the general examples and the group not prompted at all, strongly suggest that the specific examples had an effect on the interpretation of the question by widening its frame of reference.
Chapter 6 explains how the probability of respondents giving a favourable response to questions about attitudes towards abortion and declaring the Nordic countries free of nuclear weapons is increased or decreased by asking them if they agreed or disagreed with pro- or anti-attitudinal assertions. It was found that the context did not have a strong effect leading to respondents changing their attitudes from one side to the other. For both attitudes towards abortion and attitudes towards declaring the Nordic countries free of nuclear weapons did strength o f the attitude affect reliability in such a way that respondents with very strong attitudes were less likely to change their response. This does not necessarily mean that respondents with ‘not very strong’ attitudes were more susceptible to the context, and, indeed the pattern of the changes among these respondents suggests that these changes may to a large extent be explained by random variations.
1
Context effects and attitude research
1.1 Origins o f the sample survey
The sample survey is undoubtedly the most important method in monitoring public opinion (Phillips, 1971) and the National Research Council in the USA has claimed it to be ‘the single most important information-gathering invention in the social sciences’ (Adams, Smelser, & Treiman, 1982). Information gathered through survey interviews is widely used to plan and evaluate public policy, political and advertising campaigns, and to monitor various trends in society. Although the method as such, that of asking people questions, has been used for centuries for the collection of census data, it was not until the late 1930s and early 1940s that it took on the form we know today. For the most part, contemporary survey research is a product of American researchers in the twentieth century, although Karl Marx as early as 1880 mailed questionnaires to some 25,000 French workers to determine the extent of exploitation by employers (Babbie, 1973) and others had questioned respondents even earlier.
vital. One of Booth’s successors, an industrialist named Rowntree, who conducted an inquiry into poverty in a ‘typical’ English town, can be regarded as one of the pioneers in this field. His work was in many respects more sophisticated than Booth’s. He used interviewers and structured schedules to obtain the information he wanted directly from the families and placed greater emphasis on defining the concept of poverty. But, according to Marsh (1982, p. 25), it was Bowley who was responsible for ‘the decisive methodological breakthroughs for the social survey as we know it today. He was responsible for a much more rigorous attitude towards the precise questions to be asked and the precise definitions of the unit under investigation’ and his book The Measurement o f Social Phenomena was published in 1915. However, the careful administration of standardized questionnaires is often traced to psychologists working in market research, using methods reminiscent of laboratory experiments. It is here, through the emphasis on standardization that the philosophy of behaviourism filters into survey methodology. As a result, a question in a questionnaire came to be treated as an isolated stimulus and the answer to the question as a response to that particular stimulus.
interviewers were each given an assigned quota specifying the number of men, women and persons of various economic levels to be interviewed (Mosteller et al., 1949). This provided the polls or the sample surveys with more respectability and emphasis was placed on further development of the sampling techniques. In England, some major advances had been made in surveying long before this, even before the First World War. The statistical ideas underlying random sampling had been known for a long time, the chi-square distribution had been discovered and Gossett (Student) and Fisher had discovered the distribution of a large number of sample statistics before the First World War, but Bowley was among the first to apply these ideas to social surveys. In 1913, Bowley who is more famous for his use of practical sampling schemes than for his emphasis on standardized questions and definitions, constructed complete lists of houses and drew a random sample from this. He also made an attempt to estimate the reliability of his research and calculated confidence intervals for his findings (Marsh, 1982). These factors, i.e., ‘standardized’ interviews and particular sampling methods, along with advances in multivariate data analysis have come to constitute the core of the sample survey method, making it a relatively systematic and standardized approach to the collection of information.
to be adequately considered by the media, the arts, the social scientists or even by the political leaders’ (Harrisson, 1978, p. 13; cited in Marsh, 1982, p. 32). Marsh (1982) argues that the Mass-Observations must be treated as an important precursor of the ‘systematic social observation’ survey method in the USA. During the Second World War government survey activity, both in the UK and the USA, increased markedly. Not only was it intended to examine the physical conditions of those who were expected to fight or work in the munitions industry, but also to survey the conditions of the civilian population in the UK, since it was feared that civilian morale might collapse under the pressure of aerial bombardment. Public opinion polling was first systematically used for policy purposes in the USA and in the UK after the Second World War began. Although the Wartime Social Survey, founded in England in 1940, was in the beginning run by academics, the active involvement of academics was much more marked in the USA. The most extensive use of the American data was probably through the Department of the Army’s Information and Education Branch, headed by Samuel A. Stouffer (Rossi et al., 1983), but the major difference between the British and the American wartime surveys lay in the use that was made of the material. The British data were covered by the Official Secrets act and not released to anyone, whereas the American data were carefully analysed by academics and results published in The American Soldier, edited by Stouffer et al. (1949).
Measurement of Opinion, Attitudes and Consumer Wants’, chaired by Samuel Stouffer. One of the most important problems identified by this committee was ‘the validity of statements, opinion and information furnished by respondents’ (Turner and Martin, 1984). The committee recommended that methodological research was concentrated on the improvement of sampling methods, questions concerning interviewer bias, concealment of opinions, selection and training of interviewers, and the relation between opinions and behaviours.
At that time (i.e., in the 1940s) it was already recognized by survey researchers that the overall response distribution to a question was in part a function of the question wording. Parten (1950) claims that poor question framing (the wording of the question) is one of the greatest sources of bias in surveys. That is, ‘leading questions, those that state the issues in a biased manner, questions which assume knowledge on the part of the informant in fields where his knowledge is very slight or lacking entirely will lead to biased replies’ (p. 407).
and Social and Community Planning Research in England began to give the matter some attention.
1.2 Context effects
‘Students of public opinion research are fast coming to the realization that, relatively speaking, too much attention has been directed toward sample design, and too little toward question design’ (Gallup, 1947, p. 385).
Despite the fact that the above quotation was written in 1947 it is as good a description of the 1970s and ‘80s as it was of the ‘40s. At that time it was already recognized that different questionnaire designs can lead to much greater variation in results than different sampling techniques. From the 1950s to the 1970s wording experiments came to be treated anecdotally and reported as illustrative warnings but they were not developed within a theoretical framework. Researchers concentrated more on the interviewer as a source of bias. In the 1970s, however, research on survey methodology shifted again from focusing on interviewer characteristics to formal characteristics of survey questions, partly as a result of the work of Ome (1962, 1969), Rosenthal (1966) and others (cf. Rosenthal and Rosnow, 1969) in psychology, who demonstrated experimenter and other effects on responses even in experimental studies previously believed robust. Another factor contributing to this revived interest in question wording and question form was the finding by Schuman and Duncan (1974) that the relationship between variables depended on the specific questions asked. Finally, since 1970 there has been a constant growth in the use of survey measurements of subjective phenomena1 both in the USA and in Britain. Researchers interested in social trends have stressed the need for measuring such phenomena and authors of the British annual report Social Trends have argued that ‘the way forward lies not in adding more measures of conventional hard statistics,
but rather in supplementing the existing ones by adding ... a dimension of the satisfaction (happiness, contentment, psychological well-being, etc.) felt by those who constitute the community’ (Abrams, 1973, p. 36; cited in Turner and Martin, 1984, p. 4). This growing use of survey measurements of subjective phenomena has again raised questions concerning the reliability and validity of such measurements.
Since the early 1970s numerous studies have demonstrated the vulnerability of survey questions to different contexts (see Sudman and Bradbum, 1974; Schuman and Presser, 1981; Hippier and Schwarz, 1987; Schuman, 1992; Schwarz and Sudman, 1995; Sudman, Bradbum and Schwarz, 1995 for reviews), although there has not been full agreement as to the pervasiveness of these effects. An apparent change can be seen over the last decades of the twentieth century in the importance social scientists give to such effects:
‘What strikes me most as a social psychologist is the extent to which respondents apparently consider each question in and of itself without much attention to the earlier questions presented to them. The well managed survey interview is more like a slide show than a motion picture, with each item viewed quite apart from what preceded or is to succeed it.’ (Schuman, 1974).
In 1992 the same author asks himself:
‘How could I have been so clearly wrong in 1974, particularly when it seems intuitively obvious that context shapes all of our behavior?’ (Schuman, 1992, p. 5).
In an attempt to estimate the pervasiveness of unanticipated context effects Smith (1992) conjectures that such effects may occur once in every 40-60 questions (p. 174)2. Turner and Krauss (1978) point out that context effects in surveys pose a particularly serious threat when surveys are used to derive ‘indicators of the subjective state of the nation’. This type of research combines data from two or more
surveys and usually interprets differences of 5-10% as indicators of ‘true’ changes in the population. In light of the research that has been done on context and order effects, there is little justification for interpreting such a small fluctuation as a ‘true’ change without some further support. Turner and Krauss argue that ‘Inferences about changes in the state of the nation may be misleading if based upon indicator fluctuations of less than 15%.... Social indicators that are this insensitive would be of limited usefulness except for confirming obvious social changes after they have happened’ (p. 469). Other reasons for systematic research on context effects are that attempts to generalize survey results must be suspect if responses are a function of the particular context - or if opinions of respondents can be altered simply by the mode of administration of the questionnaire (Billiet, Loosveldt, and Waterplas, 1989). Still further complications may arise if only certain groups are affected by the context. Many studies have found interactions between context and background variables such as education (Schuman and Presser, 1981) and marital status (McClendon and O’Brien, 1988). Finally, conclusions drawn from experimental research on question wording, or question form may be misleading if context effects caused by preceding questions intervene (Schuman and Presser, 1981).
Many researchers have used the terms ‘context effects’ and ‘question order effects’ more or less interchangeably, despite the fact that there are important differences between these terms. For example, we can have order effects that are not caused by ‘tranfers of meaning’ (Schuman and Presser, 1981, p. 23) but are due to the position of the question within the questionnaire (e.g., fatigue and rapport effects). It may be argued that despite the diversity of context and order effects there are four major types of effects (Smith, 1986). These are effects that are:
2) unrelated to the substance of the previous questions but related to the content of the target question or its response scale (wording, etc.)
3) related to the content of the prior questions but not dependent on the way in which they were answered (unconditional context effects)
4) related to the content of preceding questions and to the way in which these questions were answered (conditional context effects)
Context effects are believed to occur when two or more questions deal with aspects of the same or closely related issues. Questions that require a general evaluation about a particular issue seem to be more sensitive to context effects than are more specific questions. This may well be because the general questions’ frame of reference is open to many different interpretations and respondents may find it difficult to answer such questions without specifying them in some way (Schuman and Presser, 1981). The behaviour in question may also be ill-defined and open to interpretation. As Schwarz (1990) points out, this is particularly likely when researchers are interested in subjective experiences. For example, before a respondent can give an answer to how often (s)he has been recently ‘really annoyed’, (s)he must decide what the researcher means by ‘really annoyed’. If the respondent cannot ask the interviewer to explain what (s)he means, or the interviewer cannot or must not define it, the respondent is likely to look for some relevant information in the questionnaire that can help her/him clarify the meaning. If the antecedent questions deal with some specific aspects of the same issue, they may provide respondents with the specification or clarification they need, and hence, lead to a context effect.
1) Classification of context effects into different types according to their cause and effect.
2) Delimitation of the cognitive steps involved in answering a question and an explanation of how context effects may arise at each step.
Among those researchers who have attempted to classify order and context effects with respect to their cause (question type) and effect are Schuman and Presser (1981) and Bradbum (Bradbum and Mason, 1964; Bradbum, 1983). Their classification of effects can be seen in table 1.1.
Table 1.1 Classification of context and order effects
Schuman and Presser Bradbum
I. Context effects (transfers of meaning) A. Part-part consistency
1. Normative principles
2. Logical inference 1. Consistency
B. Part-whole consistency C. Part-part contrast D. Part-whole contrast
1. Subtraction 2. Redundancy
2. Simple contrast
E. Salience 3. Salience
II. Sequence effects (mechanical types of artifacts)
A. Rapport 4. Rapport
B. Fatigue 5. Fatigue
C. Initial frame of reference
From: Smith (1992).
respondent, leading to more accurate or precise answers. Fatigue effects occur when the respondent begins to feel tired, leading to less thoughtful and less complete answers. The final type of sequence effects are the so-called initial frame of reference effects. That is, an item receives its highest or lowest score when presented first in a block of related items, and then serves as an anchor or a standard of comparison for the following items. Since these effects are believed to be independent of the content of previous questions, they will not be further discussed.
Communist reporters to America. Schuman and Presser (1981) call this a part-part consistency effect since both questions are at the same level of abstraction. They argue that this effect cannot be attributed to ambiguities or vagueness in the question wording. As Schuman and Presser (1981, p. 30) claim, ‘the ambiguity has to do with the nature of language, the fact that words and sentences take part of their meaning from the context in which they occur (cf. Searle, 1979)’. It is difficult to distinguish between what Schuman and Presser call part-whole consistency effects and salience effects. A typical part-whole consistency effect they quote was reported by Smith (1979). He found that asking married people about their marital happiness before asking about their general happiness led to more positive responses to the general question. This certainly is a part-whole consistency effect, i.e., positive responses to the specific question (part) increase the likelihood of a positive response to the general item (whole), but it may well be due to the ‘consciousness-raising process’ (Schuman and Presser, 1981, p. 44) created by the marital item.
Not many part-part contrast effects have been demonstrated, but one such effect was reported by Willick and Ashley (1971). They found that students were more likely to say that their political party identification was the same as their parents if the question about the parents’ party preceded, rather than followed, the question on one’s own views.
Schuman and Presser argue that this may be because respondents subtract these special circumstances from the general question and thus redefine the question to mean abortion under other circumstances than those mentioned above.
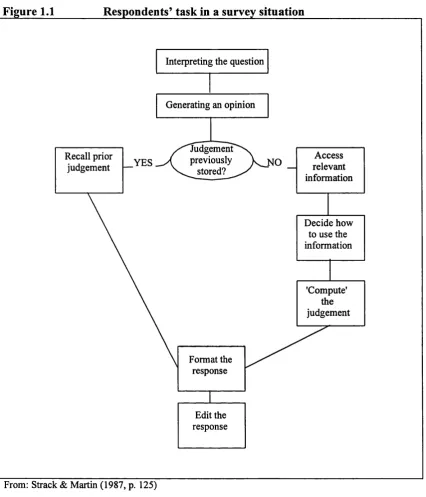
principle, it is possible for the respondent to ask for clarification if (s)he is faced with some sort of ambiguity, (s)he is not likely to get any further explanations in the survey interview. For the sake of standardization, interviewers are usually discouraged from explaining terms or questions to respondents (cf. Martin, 1984, p. 280). In such situations, the respondent is likely to use any information available to her/him to infer what the survey researcher wants to know. Strack and Martin (1987)’ argue that this information can be obtained from three different sources:
1) Content of the question itself 2) The question’s response scale
Figure 1.1 Respondents’ task in a survey situation
Judgement previously
stored? NO YES
Interpreting the question Generating an opinion
Format the response
Edit the response Recall prior
judgement
Decide how to use the information
'Compute' the judgement
Access relevant information
From: Strack & Martin (1987, p. 125)
or understandings. (Tourangeau, 1984). Hence it should come as no surprise to find that previous questions and answers to those questions influence responses to later questions.
Having interpreted or misinterpreted the question, the respondent faces the problem of how to answer it. Almost all questions require us to search memories for an answer. Anderson (1976) views long-term memory as an associative network and argues that we remember by searching relevant portions of the memory network. This perspective implies that good cues for remembering something are those that activate the right part of the network and that in most cases the best cue is the item itself. The principle of cognitive accessibility (Wyer, 1980; Wyer and Srull, 1986) suggests that when answering survey questions, respondents do not systematically retrieve all the information stored in memory that might be relevant, but that they search only until they encounter some information upon which to base their answer. Hence, they are likely to use the most accessible or salient information. An important factor in determining the accessibility is the recency with which the information has been cognitively processed or thought about. Because heightened accessibility is believed to be temporary and to decrease over time (Anderson, 1983; Posner, 1978), it should be possible to diminish context effects by interposing buffers of unrelated items between the specific context questions and the more general target question. But as Bishop et al. (1983), Tourangeau et al. (1989a), and others have pointed out, evidence on this buffering prediction is mixed.
following a simple rule, such as multiplication, addition or averaging. The most important assumptions made here are: a) people readily evaluate diverse pieces of information on a common scale and b) they then combine the information according to simple formulae (Anderson, 1974; 1981). Fishbein & Ajzen (1975) also claim that people follow simple rules when they are making a judgement, but they emphasize that the span of human memory is so limited that each judgement is only based on 5- 9 pieces of information, the most salient beliefs at any one time. A contrasting view presented by Tversky and Kahneman (1973) is that we apply loose rules of thumb in making judgements. They have identified three such heuristics and shown how they can lead to systematic errors in judgement of frequency and likelihood. These heuristics are availability, representativeness and anchoring and adjustment. Although Tversky and Kahneman’s view is fundamentally different from that of Anderson and of Fishbein and Ajzen, it may well explain which beliefs are the most salient at any one time.
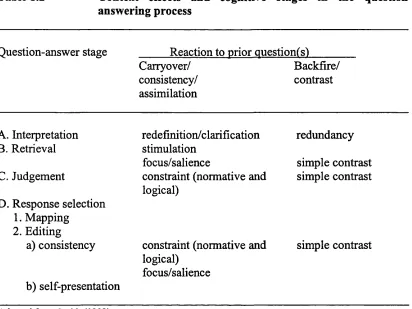
Table 1.2 Context effects and cognitive stages in the question-answering process
Question-answer stage Reaction to prior question(s)_____
Carryover/ Backfire/
consistency/ contrast
assimilation
A. Interpretation redefinition/clarification
B. Retrieval stimulation
focus/salience
C. Judgement constraint (normative and logical)
D. Response selection 1. Mapping
2. Editing
a) consistency constraint (normative and logical)
focus/salience b) self-presentation
Adapted from Smith (1992).
Although the prevailing view is that context effects arise because prior questions increase the accessibility of particular beliefs, prior questions can also affect the way in which the respondent uses the retrieved information. However, predictions about what effects the context will have, have proved to be difficult. The effect can be either in the direction of consistency, to make responses to one question similar to responses to other (i.e., what Schwarz and Bless, 1992 call an assimilation effect), or a contrast effect, making responses dissimilar (also called a ‘backfire-effect’ (Tourangeau and Rasinski, 1986)).
Although accessibility is believed to be temporary and to decrease over time, several studies (cf. Bishop, Oldendick and Tuchfarber, 1983; Schuman, Kalton and Ludwig, 1983) have demonstrated that it is not the temporal contiguity of questions that determines the context effect, but rather the perceived relevance of the questions. Schwarz and Bless (1992) have proposed a model to account for how this may happen. If the respondent perceives the information activated by the preceding
redundancy simple contrast simple contrast
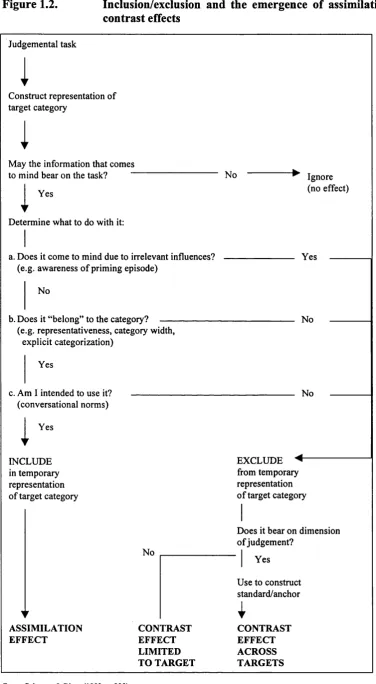
Figure 1.2. Inclusion/exclusion and the emergence of assimilation and contrast effects
Judgemental task
1
Construct representation of target category
1
May the information that comes to mind bear on the task? ~
1
Yes
Determine what to do with it:
No Ignore (no effect)
a. Does it come to mind due to irrelevant influences? (e.g. awareness of priming episode)
No
b. Does it “belong” to the category?
Yes
(e.g. representativeness, category width, explicit categorization)
Yes
c. Am I intended to use it? (conversational norms)
i
YesINCLUDE in temporary representation of target category
No ASSIMILATION EFFECT CONTRAST EFFECT LIMITED TO TARGET No No EXCLUDE from temporary representation of target category
Does it bear on dimension of judgement?
| Yes Use to construct standard/anchor I CONTRAST EFFECT ACROSS TARGETS
1.3 Errors in attitude measurement
‘“What is the truth? said jesting Pilate; and would not stay for an answer.” Thus Francis Bacon opens his essay “O f Truth”. Yet we cannot scoff at truth in trying to deal with measurement and error. We must begin with some sense or understanding or even faith that there is a true quantity, a true value under measurement, for error means discrepancy from truth.’ (Turner and Martin, 1984, p. 97).
There are numerous aspects of the social survey that can lead to ‘errors’ in measurement, and thus poor reliability and validity. These ‘errors’ have generally been divided into two main classes: sampling errors (variability due to sample size and complexity of sampling plan) and nonsampling errors. Sampling theory is relatively well established, but theories and knowledge about nonsampling errors are more fragmented. Nonsampling errors are of two major types: 1) non-response errors arising from difficulties in the execution of the sample, either by item non response or by failure to get interviews with members of the selected sample, and 2) response errors caused by other factors such as respondents misinterpreting a question or deliberately lying. Sudman and Bradbum (1974) distinguish three sources of response errors: the characteristics of the task itself (the questionnaire), the interviewer’s performance and the respondent. Hence, a theory of response errors has to take into account the interaction between these three sources. Despite realizing the importance of this interaction, the questionnaire and context and order effects will be the focus of attention in this thesis, since the bulk of research on response errors has focussed on the characteristics of the interviewer.
knowledge, can be argued to be inherently different from the two others. There is little doubt that when we ask a person how often (s)he has been to a dinner party in the last six months there is a true value that exists. That is, although the definition of a dinner party may be vague, the person has been to a specific number of such parties. The same applies to knowledge questions. There is usually a true answer to such questions, which the respondent knows or does not know. However, the fact that both behavioural questions and knowledge questions are known to be subject to various kinds of errors or biases depending on factors such as interpretation of concepts, ease of retrieval from memory, amount of telescoping of behaviour and self-presentation should not be ignored (cf. Kalton & Schuman, 1982). For example, attitude questions about crime have been shown to lead to more reports of criminal victimization (Cowan Murphy, & Wiener, 1978; Gibson, Shapiro, Murphy, & Stanko, 1978).
(Brown, 1970; Pierce & Rose, 1974; Achen, 1975, 1983; Dean and Moran, 1977; Erikson, 1979; Feldman, 1989). They contend that the fluctuations or measurement errors stem from the difficulty of mapping the attitudes onto the unavoidably vague language of survey questions. Therefore, it is important to distinguish between two different types of attitude stability: stability at the psychological level, i.e., stability of the hypothetical attitude concept, and stability of attitudinal responses. Following Bradbum (1983) I question the use of the term error in the case of attitude questions, because, as argued above, it is by no means clear that there is ‘one’ true value for attitudes, opinions, beliefs, emotions, etc. Hence, a question that needs to be addressed is whether the apparent inconsistencies are purely artifacts of changes in question order and/or response scales, or to some extent due to the inherent nature of attitudes. Is the observed instability only at the response level or can it also be found at the psychological level in the hypothetical construct (if in fact an attitude exists at the psychological level)?
The determination of potential attitude stability and attitude changeability is an important prerequisite for the prediction and explanation of context effects. How much do we expect attitudes to fluctuate? What is needed for an attitude to change? Which characteristics of the respondent in a survey situation are most likely to influence or mediate effects of previous questions (i.e., the context)?
1981; Feldman, 1989; Zaller, 1990). However, most researchers dealing with the consistency or stability of attitudes over time have made little attempt to separate random error of measurement from ‘true attitude change’ (Kendall, 1954; Converse, 1964, 1970, 1980; Schuman & Presser, 1981), but have instead made the assumption that no attitude change took place from one time to another and all the inconsistencies over time could be attributed to random measurement error. Viewing all fluctuations in attitudes as random measurement error also implies that there exists a fixed attitude which, in theory, one should be able to measure. Therefore, one would like to separate random fluctuations at the intermediate level and random error of measurement related to the measuring device, the questionnaire. Random error of measurement can be argued to occur at the level of measurement only, whereas random fluctuations in attitudes and systematic attitude change also occur at the intermediate level, in the hypothetical construct itself.
As pointed out by Zaller and Feldman (1992): ‘Virtually all public opinion research proceeds on the assumption that citizens possess reasonably well formed attitudes on major political issues, and that surveys are passive measures of these attitudes. The standard view is that when survey respondents say they favor X they are simply describing a preexisting state of feeling favorably toward X’ (p. 579). But do attitude theories lend support to this prevailing view of survey researchers that attitudes are preexisting psychological states that should not be affected by measurement? Can one assume that despite considerable instability in attitudinal responses the attitude will maintain its stability at the intermediate level?
context. This view seems to be the prevailing view within the psychological attitude theories, but whether survey researchers and other social scientists have accepted this is not clear. Cantril (1944) contends that ‘the respondent’s mental context is solidly structured ... the same answer is likely to be obtained irrespective of the way questions are asked (pp. 48-49). A similar view is reflected in Payne’s (1951) argument: ‘Where people have strong convictions, the wording of the question should not greatly change the stand they take. The question can be loaded heavily on one side, or heavily on the other side, but if people feel strongly their replies should come out about the same. It is only issues where opinion is not crystallized that answers can be swayed from one side of the issue to the other by changes in the statement of the issue’ (p. 179).
Many of the traditional theories on attitudes are based on the assumption that attitudes are psychological entities in people’s minds although they vary considerably in their view of the stability or endurance of attitudes. The main challenge for the psychologist in the 1930s and ‘40s was finding a way to get to those attitudes, i.e., measure them with acceptable precision. This is apparent in the writings of Allport (1935) where he states that: ‘Attitude scales should be regarded only as the roughest approximations of the way in which attitudes actually exist in the mental life of individuals’ (in Fishbein, 1967, pp. 11-12). Unreliable measures were a major concern, but fluctuations should also be expected because ‘attitudes often change, and an investigation made under one set of conditions may not for long present a true picture of the attitudes of any given group’ (in Fishbein, 1967, p.
12).
itself. Attitude theories that explicitly allow for some instability in attitudes are for example Sherif and Hovland’s (1961) concept of latitude of acceptance, McGuire’s (1969; McGuire & McGuire, 1991) loose linkages and Kaplowitz, Fink and Bauer’s (1983) oscillations. Such theories are based on the idea that attitudes may be divided into different components, i.e., stable basal components plus peripheral components that are readily changed by persuasion (N.H. Anderson, 1959; Lazarsfeld, 1959; Kelman, 1980).
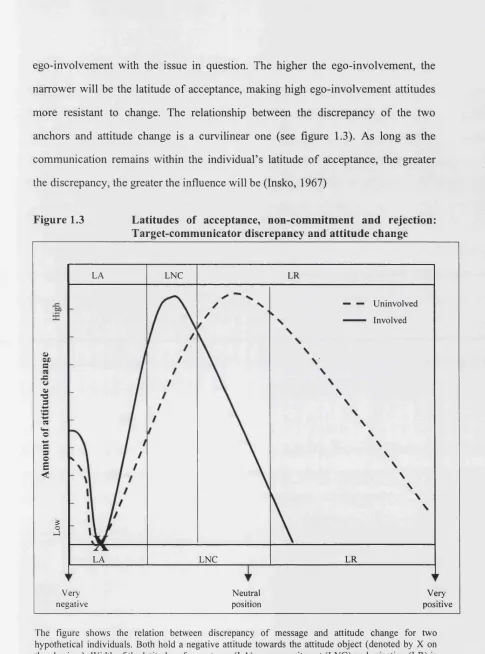
ego-involvement with the issue in question. The higher the ego-involvement, the
narrower will be the latitude o f acceptance, making high ego-involvement attitudes
more resistant to change. The relationship between the discrepancy o f the two
anchors and attitude change is a curvilinear one (see figure 1.3). As long as the
communication remains within the individual’s latitude o f acceptance, the greater
[image:54.595.26.511.34.688.2]the discrepancy, the greater the influence will be (Insko, 1967)
Figure 1.3 Latitudes of acceptance, non-commitment and rejection: Target-communicator discrepancy and attitude change
o> ©x
G
~ -=
© IS
3
3 <*-© G 3 © E
<
LA LNC LR
Uninvolved
Involved
£
o
LA LNC LR
Very negative
Neutral position
Very positive
The theory of assimilation-contrast places greatest emphasis on the target- communicator discrepancy (see also Petty & Cacioppo, 1986a; Granberg & Campbell, 1977). There are two major problems with the discrepancy idea. First, the principle of regression toward the mean guarantees that the most discrepant individuals (i.e., furthest away from the mean) will change the most. Second/ individuals occupying the most extreme positions are known to be more certain of their stand (Cantril, 1944; Suchman, 1950) and are considered to be more ego- involved (Sherif and Hovland, 1961). Thus, a neutral com